China Plastic Pipe Industry Report, 2012-2015
-
Mar.2013
- Hard Copy
- USD
$2,000
-
- Pages:85
- Single User License
(PDF Unprintable)
- USD
$1,900
-
- Code:
CYH009
- Enterprise-wide License
(PDF Printable & Editable)
- USD
$3,000
-
- Hard Copy + Single User License
- USD
$2,200
-
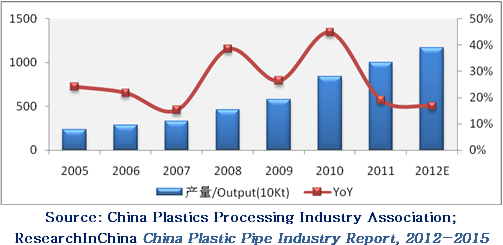
As the world’s largest producer and consumer of plastic pipe, China’s output of plastic pipe reached 10 million tons in 2011 (a year-on-year increase of 19.0%), and about 11.67 million tons in 2012.
Output and YoY Growth Rate of Plastic Pipes in China, 2005-2012
In today’s China plastic pipe industry, PVC pipe still holds a dominant position, with output accounting for approximately 55% of the total. However, with the increasingly serious environmental pollution as well as support policies, China’s PE and PP pipe market share will usher in fast growth.
There are more than 3,000 enterprises engaged in the production and operation of plastic pipes in China, but only a few with capacity up to the 10,000-ton level. In 2012, China Liansu Group Holdings Limited, Cangzhou Mingzhu Plastic Co., Ltd., Fujian Newchoice Pipe Technology Co., Ltd., Goody Technology Co.,Ltd and other listed companies occupied leading positions in annual production capacity, of which, China Liansu, by virtue of the 1.75 million tons/a scale, became one of the country’s largest plastic pipe enterprises. Stimulated by the accelerated process of urbanization and other favorable factors, major domestic playersare actively seeking financing for expansion.
As a leader in domestic PE gas and water supply pipe industry, Cangzhou Mingzhu Plastic realized PE pipe capacity of 62,000 tons as of the end of 2012, of which, 47,000 tons was located in the Cangzhou headquarter, 15,000 tons in the Wuhu subsidiary. In 2011, it raised funds of RMB152 million by means of non-public issuance for the construction of the 19,800-ton PE Pipe & Fittings Project expected to be put into production in 2013.
Fujian Newchoice Pipe Technology is one of China’s core enterprises of HDPE winding intensifier tubes and auxiliary fittings. In 2011, it added six new HDPE winding intensifier tube production lines (new capacity of 14,400 tons) with IPO funds, all of which are to be put into production in early 2013. So far, the company has possessed 11 HDPE winding intensifier tube production lines in three production bases in Quanzhou (headquarter), Tianjin and Wuhan, with aggregate productivity of 25,500 tons/a. In addition, it plans to build two new production bases (each with two 2,400-ton production lines ) which are expected to go into operation by the end of 2014.
Being one of influential manufacturers of plastic pipes in China, Goody Technology has a total of eight production bases, with products covering PVC, PE and PP series. In August 2012, the company’s Hubei Goody 43,000 tons/a Plastic Pipeline Project (already put into production at end-2012) and Chongqing Goody 26,500 tons/a Plastic Pipeline Project with IPO funds began construction, of which, the former is expected to be completed and commissioned in the second half of 2013, when the company’s plastic pipe business might realize a total annual capacity of 232,000 tons.
China Plastic Pipe Industry Report, 2012-2015 of ResearchInChina mainly covers the followings: 
Supply & demand, imports & exports, product structure, regional structure, competition pattern, price, development trend, etc. of Chinese plastic pipe industry;
Supply & demand, imports & exports, competition pattern, development trend, etc. of Chinese plastic pipe industry market segments;
Development status, development tendency, etc. of China’s downstream plastic pipe industry;
Operation, plastic pipe business, development prospects, etc. of nine Chinese plastic pipe manufacturers.
1. Overview of Plastic Pipe Industry
1.1 Definition
1.2 Classification
2. China Plastic Pipe Market Development
2.1 Global Plastic Pipe Market Development
2.2 China Plastic Pipe Market Supply
2.3 China Plastic Pipe Market Demand
2.4 China Plastic Pipe Exports
2.5 China Plastic Pipe Imports
2.6 Product Structure
2.7 Regional Structure
2.8 Competition Pattern
2.9 Price
2.10 Development Trend
3. China Plastic Pipe Market Segments
3.1 PVC Pipe
3.1.1 Market Supply
3.1.2 Imports
3.1.3 Exports
3.1.4 Development Trend
3.2 PE Pipe
3.2.1 Market Supply and Demand
3.2.2 Imports
3.2.3 Exports
3.2.4 Development Trend
3.3 PP Pipe
3.3.1 Market Supply and Demand
3.3.2 Imports
3.3.3 Exports
3.3.4 Competition Pattern
4. China Downstream Plastic Pipe Industry
4.1 Municipal Water Supply Pipe
4.1.1 Development Status
4.1.2 Development Trend
4.2 Municipal Drainage Pipe
4.3 Municipal Gas Pipe
4.4 Others
5. Key Enterprises
5.1 Cangzhou Mingzhu Plastic Co., Ltd.
5.1.1 Profile
5.1.2 Operation
5.1.3 Revenue Structure
5.1.4 Gross Margin
5.1.5 Clients & Suppliers
5.1.6 R&D and Investment
5.1.7 Plastic Pipe Business
5.1.8 Development Prospect
5.2 Zhejiang Weixing New Building Materials Co., Ltd
5.2.1 Profile
5.2.2 Operation
5.2.3 Revenue Structure
5.2.4 Gross Margin
5.2.5 Clients & Suppliers
5.2.6 R&D and Investment
5.2.7 Development Prospect
5.3 Fujian Newchoice Pipe Technology Co., Ltd.
5.3.1 Profile
5.3.2 Operation
5.3.3 Revenue Structure
5.3.4 Gross Margin
5.3.5 Clients & Suppliers
5.3.6 R&D and Investment
5.3.7 Development Prospect
5.4 Ningxia Qinglong Pipes Industry Co.,Ltd.
5.4.1 Profile
5.4.2 Operation
5.4.3 Revenue Structure
5.4.4 Gross Margin
5.4.5 Clients & Suppliers
5.4.6 R&D and Investment
5.4.7 Plastic Pipe Business
5.4.8 Development Prospect
5.5 Xinjiang Guotong Pipeline Co., Ltd.
5.5.1 Profile
5.5.2 Operation
5.5.3 Revenue Structure
5.5.4 Gross Margin
5.5.5 Clients & Suppliers
5.5.6 R&D
5.5.7 Development Prospect
5.6 Yonggao Co., Ltd.
5.6.1 Profile
5.6.2 Operation
5.6.3 Revenue Structure
5.6.4 Gross Margin
5.6.5 Clients & Suppliers
5.6.6 R&D and Investment
5.6.7 Development Prospect
5.7 Goody Technology Co.,Ltd
5.7.1 Profile
5.7.2 Operation
5.7.3 Revenue Structure
5.7.4 Gross Margin
5.7.5 Clients & Suppliers
5.7.6 R&D and Investment
5.7.7 Output and Sales Volume
5.7.8 Development Prospect
5.8 China Liansu Group Holdings Limited
5.8.1 Profile
5.8.2 Operation
5.8.3 Revenue Structure
5.8.4 Plastic Pipe Business
5.8.5 Development Prospect
5.9 Anhui Guotong Hi-Tech Pipes Industry Co., Ltd
5.9.1 Profile
5.9.2 Operation
5.9.3 Revenue Structure
5.9.4 Gross Margin
5.9.5 Clients
5.9.6 Development Prospect
Classification and Uses of Plastic Pipe (by Material)
Global Plastic Pipe Production and Per Capita Consumption (by Country/Year)
China Plastic Pipe Capacity and YoY Growth Rate, 2005-2012
China Plastic Pipe Output and YoY Growth Rate, 2005-2012
China Plastic Pipe Market Demand Structure (by Application), 2011 vs. 2016
Export Volume and YoY Growth Rate of China Plastic Pipe and Fittings, 2005-2012
China Plastic Pipe Export Volume Structure (by Country), 2012
China Plastic Pipe Import Volume and YoY Growth Rate, 2009-2012
China Plastic Pipe Import Volume Structure (by Country), 2012
China Plastic Pipe Output Structure (by Type), 2011
Proportion of Total Output of China’s Top Plastic Pipe Areas, 2001-2010
Output and Market Share of China’s Top 20 Plastic Pipe Enterprises, 2003-2010
Revenue of China’s Major Plastic Pipe Enterprises, 2009-2012
Capacity of China’s Plastic Pipe Enterprises, 2012 (Part)
China Plastic Pipe Guiding Price (by Product), 2007-2012
China Plastic Pipe Capacity and Output, 2011-2016E
Development Trends of China Plastic Pipe Products (by Application)
China Rigid PVC Pipe Import Volume and YoY Growth Rate, 2009-2012
China Rigid PVC Pipe Import Value and YoY Growth Rate, 2009-2012
China Rigid PVC Pipe Export Volume and YoY Growth Rate, 2009-2012
China Rigid PVC Pipe Export Value and YoY Growth Rate, 2009-2012
Global HDPE Pipe Demand (by Region), 1990-2010
China Rigid PE Pipe Import Volume and YoY Growth Rate, 2009-2012
China Rigid PE Pipe Import Value and YoY Growth Rate, 2009-2012
China Rigid PE Pipe Export Volume and YoY Growth Rate, 2009-2012
China Rigid PE Pipe Export Value and YoY Growth Rate, 2009-2012
China PP Pipe Market Demand (by Variety), 2008-2011
China Rigid PP Pipe Import Volume and YoY Growth Rate, 2009-2012
China Rigid PP Pipe Import Value and YoY Growth Rate, 2009-2012
China Rigid PP Pipe Export Volume and YoY Growth Rate, 2009-2012
China Rigid PP Pipe Export Value and YoY, Growth Rate 2009-2012
China PP-R Pipe Capacity, Output and Raw Material Sources (by Enterprise), 2010
Downstream Application of Plastic Pipes
China Urban Water Supply Pipe Lengths and YoY Growth Rate, 2002-2011
China Urban Hot Water Pipe Length and YoY Growth Rate, 2002-2011
China Urban Drainage Pipe Length and Density, 1990-2011
China Urban Pipe Length (by Gas Type), 2002-2011
Distribution of Cangzhou Mingzhu Plastic’s Subsidiaries, 2012
Revenue and YoY Growth Rate of Cangzhou Mingzhu Plastic, 2007-2012
Net Income and YoY Growth Rate of Cangzhou Mingzhu Plastic, 2007-2012
Revenue Breakdown of Cangzhou Mingzhu Plastic by Product, 2007-2012
Revenue Breakdown of Cangzhou Mingzhu Plastic by Region, 2007-2012
Gross Margin of Cangzhou Mingzhu Plastic by Product, 2007-2012
Cangzhou Mingzhu Plastic’s Procurement from Top 5 Suppliers and % of Total Procurement, 2009-2011
Cangzhou Mingzhu Plastic’s Revenue from Top 5 Clients and % of Total Revenue, 2009-2012
Name List and Revenue Contribution of Cangzhou Mingzhu Plastic’s Top 5 Clients, 2012
R&D Costs and % of Total Revenue of Cangzhou Mingzhu Plastic, 2009-2011
Cangzhou Mingzhu Plastic’s Projects under Construction, 2011
PE Pipe Sales Volume of Cangzhou Mingzhu Plastic, 2005-2011
Revenue and Net Income of Cangzhou Mingzhu Plastic, 2011-2015E
Distribution of Weixing NBM’s Plastic Pipe Subsidiaries, 2012
Types and Uses of Weixing NBM’s Products, 2012
Capacity of Weixing NBM by Product, 2007-2012
Revenue and YoY Growth Rate of Weixing NBM, 2007-2012
Net Income and YoY Growth Rate of Weixing NBM, 2007-2012
Revenue Breakdown of Weixing NBM by Product, 2007-2012
Revenue Breakdown of Weixing NBM by Region, 2007-2012
Gross Margin of Weixing NBM by Product, 2007-2012
Weixing NBM’s Procurement from Top 5 Suppliers and % of Total Procurement, 2009-2011
Weixing NBM’s Revenue from Top 5 Clients and % of Total Revenue, 2009-2011
R&D Costs and % of Total Revenue of Weixing NBM, 2008-2012
Key Construction Projects of Weixing NBM, 2012
Revenue and Net Income of Weixing NBM, 2011-2015E
Distribution of Fujian Newchoice Pipe Technology’s Subsidiaries, 2012
Plastic Pipe Capacity of Fujian Newchoice Pipe Technology by Bases, 2007-2012
Revenue and YoY Growth Rate of Fujian Newchoice Pipe Technology, 2007-2012
Net Income and YoY Growth Rate of Fujian Newchoice Pipe Technology, 2007-2012
HDPE Winding Reinforced Tube Capacity and YoY Growth Rate of Fujian Newchoice Pipe Technology, 2007-2014E
Revenue Breakdown of Fujian Newchoice Pipe Technology by Product, 2007-2012
Revenue Breakdown of Fujian Newchoice Pipe Technology by Region, 2007-2012
Gross Margin of Fujian Newchoice Pipe Technology by Products, 2007-2012
Fujian Newchoice Pipe Technology’s Procurement from Top 5 Suppliers and % of Total Procurement, 2007-2010
Fujian Newchoice Pipe Technology’s Revenue from Top 5 Clients and % of Total Revenue, 2007-2011
R&D Costs and % of Total Revenue of Fujian Newchoice Pipe Technology, 2007-2011
Fujian Newchoice Pipe Technology’s Projects under Construction by end-September 2012
Revenue and Net Income of Fujian Newchoice Pipe Technology, 2011-2015E
Subsidiaries of Ningxia Qinglong Pipes Industry, 2012
Revenue and YoY Growth Rate of Ningxia Qinglong Pipes Industry, 2007-2012
Net Income and YoY Growth Rate of Ningxia Qinglong Pipes Industry, 2007-2012
Revenue Breakdown of Ningxia Qinglong Pipes Industry by Product, 2007-2012
Revenue Breakdown of Ningxia Qinglong Pipes Industry by Region, 2007-2012
Gross Margin of Ningxia Qinglong Pipes Industry by Product,2007-2012
Ningxia Qinglong Pipes Industry’s Procurement from Top 5 Suppliers and % of Total Procurement, 2007-2011
Ningxia Qinglong Pipes Industry’s Revenue from Top 5 Clients and % of Total Revenue, 2007-2012
Name List and Revenue Contribution of Ningxia Qinglong Pipes Industry’s Top 5 Clients, 2012
R&D Costs and % of Total Revenue of Ningxia Qinglong Pipes Industry, 2009-2011
Ningxia Qinglong Pipes Industry’s Key Projects under Construction by end-June 2012
Plastic Pipe Revenue and YoY Growth Rate of Ningxia Qinglong Pipes Industry by Products, 2007-2012
Plastic Pipe Capacity, Output, Sales Volume and Average Price of Ningxia Qinglong Pipes Industry by Products, 2007-2009
Revenue and Net Income of Ningxia Qinglong Pipes Industry, 2011-2015E
Subsidiaries of Xinjiang Guotong Pipeline, 2012
Revenue and YoY Growth Rate of Xinjiang Guotong Pipeline, 2007-2012
Net Income and YoY Growth Rate of Xinjiang Guotong Pipeline, 2007-2012
Revenue Breakdown of Xinjiang Guotong Pipeline by Product, 2007-2012
Revenue Breakdown of Xinjiang Guotong Pipeline by Region, 2007-2012
Gross Margin of Xinjiang Guotong Pipeline by Product, 2007-2012
Xinjiang Guotong Pipeline’s Procurement from Top 5 Suppliers and % of Total Procurement, 2011
Xinjiang Guotong Pipeline’s Revenue from Top 5 Clients and % of Total Revenue, 2010-2012
R&D Costs and % of Total Revenue of Xinjiang Guotong Pipeline, 2008-2011
Revenue and Net Income of Xinjiang Guotong Pipeline, 2011-2015E
Subsidiaries of Yonggao, 2012
Revenue and YoY Growth Rate of Yonggao, 2008-2012
Net Income and YoY Growth Rate of Yonggao, 2008-2012
Capacity of Yonggao by Regions/Products, 2012
Revenue Breakdown of Yonggao by Products, 2008-2012
Revenue Breakdown of Yonggao by Regions, 2008-2012
Gross Margin of Yonggao by Products, 2008-2012
Yonggao’s Procurement from Top 5 Suppliers and % of Total Procurement, 2008-2011
Yonggao’s Revenue from Top 5 Clients and % of Total Revenue, 2008-2012
R&D Costs and % of Total Revenue of Yonggao, 2008-2011
Yonggao’s Projects under Construction by end-June 2012
Revenue and Net Income of Yonggao, 2011-2015E
Revenue and YoY Growth Rate of Goody Technology, 2009-2012
Net Income and YoY Growth Rate of Goody Technology, 2009-2012
Revenue Breakdown of Goody Technology by Product, 2009-2011
Revenue Breakdown of Goody Technology by Region, 2009-2011
Gross Margin of Goody Technology by Product, 2009-2011
Goody Technology’s Procurement from Top 5 Suppliers and % of Total Procurement, 2009-2011
Goody Technology’s Revenue from Top 5 Clients and % of Total Revenue, 2009-2011
R&D Costs and % of Total Revenue of Goody Technology, 2009-2011
Goody Technology’s Projects under Construction, 2012
Capacity Breakdown of Goody Technology by Product, 2009-2011
Output, Sales Volume and Sales-Output Ratio of Goody Technology by Products, 2009-2011
Revenue and Net Income of Goody Technology, 2011-2015E
Subsidiaries of China Liansu
Revenue and YoY Growth Rate of China Liansu, 2007-2012
Net Income and YoY Growth Rate of China Liansu, 2007-2011
Revenue Breakdown of China Liansu by Product, 2009-2012
Revenue Structure of China Liansu by Region, 2009-2012
Plastic Pipe Sales Volume and YoY Growth Rate of China Liansu (by Products), 2009-2012
Plastic Pipe Revenue Structure of China Liansu (by Applications), 2010-2012
Revenue and Net Income of China Liansu, 2010-2015E
Revenue and YoY Growth Rate of Guotong Pipes, 2007-2012
Net Income and YoY Growth Rate of Guotong Pipes, 2007-2012
Revenue Breakdown of Guotong Pipes by Product, 2007-2012
Revenue Breakdown of Guotong Pipes by Region, 2007-2012
Gross Margin of Guotong Pipes by Product, 2007-2012
Guotong Pipes’ Revenue from Top 5 Clients and % of Total Revenue, 2010-2012
Name List and Revenue Contribution of Guotong Pipes’ Top 5 Clients, 2011
Revenue and Net Income of Guotong Pipes, 2011-2015E
Global and China Optical Fiber Preform Industry Report, 2021-2026
Optical fiber preforms play a key role in the optical fiber communication industry chain. The global construction of 4G and FTTH requires less optical fiber and cable, which has dragged down the deman...
Global and China Photoresist Industry Report, 2021-2026
Since its invention in 1959, photoresist has been the most crucial process material for the semiconductor industry. Photoresist was improved as a key material used in the manufacturing process of prin...
Global and China Needle Coke Industry Report, 2021-2026
Needle coke is an important carbon material, featuring a low thermal expansion coefficient, a low electrical resistivity, and strong thermal shock resistance and oxidation resistance. It is suitable f...
Global and China 3D Glass Industry Report, 2021-2026
3D curved glass is light and thin, transparent and clean, anti-fingerprint, anti-glare, hard and scratch-resistant, and performs well in weather resistance. It is applicable to terminals such as high-...
Global and China Graphene Industry Report, 2020-2026
Graphene, a kind of 2D carbon nanomaterial, features excellent properties such as mechanical property and super electrical conductivity and thermal conductivity. Its downstream application ranges from...
Global and China Optical Fiber Preform Industry Report, 2020-2026
Optical fiber preform as a hi-tech product and a crucial link in the optical fiber industry chain contributes to 70% or so of profit margin. Global 4G and FTTH construction at dusk leads to the shrink...
Global and China 3D Glass Industry Report, 2020-2026
Global 3D glass market has been enlarging over the recent years amid demetallization of smartphone back covers and popularity of smart wearables, to approximately $2.86 billion in 2019 and to an estim...
Global and China Photoresist Industry Report, 2020-2026
In 2019, global photoresist market was valued at $8.3 billion, growing at a compound annual rate of 5.1% or so since 2010, and it will outnumber $12.7 billion in 2026 with advances in electronic techn...
Global and China Synthetic Diamond Industry Report, 2020-2026
While its mechanical property is given full play in fields like grinding and cutting, diamond with acoustic, optical, magnetic, thermal and other special properties, as superconducting material, intel...
Global and China Needle Coke Industry Report, 2020-2026
With the merits like small resistivity, excellent resistance to impact and good anti-oxidation property, needle coke has been widely used in ultra-high power graphite electrodes, nuclear reactor decel...
Global and China Optical Fiber Preform Industry Report, 2019-2025
Optical fiber preform, playing an important role in the optical fiber and cable industry chain, seizes about 70% profits of optical fiber. Global demand for optical fiber preform stood at 16.2kt in 20...
China Silicon Carbide Industry Report, 2019-2025
Silicon carbide (SiC) is the most mature and the most widely used among third-generation wide band gap semiconductor materials. Over the past two years, global SiC market capacity, however, hovered ar...
Global and China Photoresist Industry Report, 2019-2025
Photoresist, a sort of material indispensable to PCB, flat panel display, optoelectronic devices, among others, keeps expanding in market size amid the robust demand from downstream sectors. In 2018, ...
Global and China Graphene Industry Report, 2019-2025
Graphene is featured with excellent performance and enjoys a rosy prospect. The global graphene market was worth more than $100 million in 2018, with an anticipated CAGR of virtually 45% between 2019 ...
Global and China 3D Glass Industry Chain Report, 2019-2025
The evolution of AMOLED conduces to the steady development of 3D curved glass market. In 2018, the global 3D glass market expanded 37.7% on an annualized basis and reached $1.9 billion, a figure proje...
China Wood Flooring Industry Report, 2019-2025
With the better standard of living and the people’s desire for an elegant life, wood flooring sees a rising share in the flooring industry of China, up from 33.9% in 2009 to 38.9% in 2018, just behind...
Global and China Photovoltaic Glass Industry Report, 2019-2025
In China, PV installed capacity has ramped up since the issuance of photovoltaic (PV) subsidy policies, reaching 53GW in 2017, or over 50% of global total. However, the domestic PV demand was hit by t...
Global and China ITO Targets Industry Chain Report, 2019-2025
Featured by good electrical conductivity and transparency, ITO targets are widely applied to fields of LCD, flat-panel display, plasma display, touch screen, electronic paper, OLED, solar cell, antist...