Global and China Touch Screen (Panel)Industry Report, 2013-2014
-
Apr./2014
- Hard Copy
- USD
$2,700
-
- Pages:140
- Single User License
(PDF Unprintable)
- USD
$2,500
-
- Code:
ZYW168
- Enterprise-wide License
(PDF Printable & Editable)
- USD
$3,900
-
- Hard Copy + Single User License
- USD
$2,900
-
Global and China Touch Screen (Panel) Industry Report, 2013-2014 covers the followings:
1. Brief Introduction to Touch Screen (Panel)???
2. Technological Trends of Small, Medium and Large-sized Touch Screen (Panel)
3. Status Quo and Trends of Metal Mesh and AgNW
4. Touch Screen (Panel) Market
5. ITO Film Market
6. 9 Small and Medium-sized Display Companies
7. 19 Touch Screen (Panel) Companies
?
In 2013, the touch screen market was featured with fierce price war and far lower demand for touch screen laptops than expected.
In the GFF field, many vendors, especially the ones in Mainland China, conducted expansion aggressively in 2012, but had to trigger a price war to seize customers in 2013. As a result, some vendors witnessed a significant decline in revenue, even the winners also paid a heavy price. The high-profit era of touch screens was gone for ever. The Mainland Chinese vendor SHENZHEN O-FILM TECH won the crown of laurels in the GFF field, but its gross margin fell by about 4%. The revenue of South Korean company MELFAS violently surged by 322% year on year, while its operating margin plummeted from 8.6% to 0.04% in 2013. MELFAS has expressly claimed its exit from some low-margin areas in 2014, which means that its revenue is expected to drop sharply.
The vendors who focused on laptop touch screens felt frustrated because the demand for touch screen laptops was severely lower than expected. TPK is the most typical example. Owing to the insufficient demand, F-TPK turned to invest in Cando in order to save costs and expenses; on November 4, 2013, it announced the halt of Hsinchu Plant’s 3.5-generation line and 4.5-generation line; in late November, F-TPK also stopped the production of its subsidiary G&P Optical Solutions(Xiamen) Inc.
As for the technical aspect, GFF occupies the mainstream market by virtue of low prices, but threatened by the fast-growing OGS. Truly's revenue soared by 328% year on year in 2013 with the core product -- OGS, so that the company dominated the domestic high-end mobile phone market.
Metal Mesh has the merits below:
 ? Ultra low impedance, support for the touch screen with the maximum size of 24 inches.
? Competitive price, much lower than the ITO Film price
? Foldable and bendable, especially suitable for smart wearable products like iwatch
? Support ultra-narrow border design
For 13.3-inch laptops, Metal Mesh can control the border at 4 mm or less; for 15-inch laptops, it can do the border at 5 mm or less.
The upstream metal mesh industry chain is grasped by minority vendors including Fujifilm and Mitsubishi; moreover, it requires new equipment, so the initial cost is quite high. YOUNG FAST, SHENZHEN O-FILM TECH and J-Touch prefer Metal Mesh, and J-Touch targeting medium and large-sized fields makes the quickest progress.
The biggest advantage of AgNW lies in the small-scale transformation of touch sensor production equipment instead of buying new equipment. However, due to its high resistance and poor light transmission, it is not appropriate for the medium-sized field for the time being, but very suitable for the small-sized field which has lower requirements on quality. It is reported that TPK’s SNW has got the order from Apple iwatch for touch screens.
Apple adopts the IN-CELL design for iPhone5 and iPhone6 because of the unsatisfying GFF’s performance and OGS’ screen intensity. TOL meets Apple's requirements, but TPK's TOL monthly capacity is only 2 million and TPK is unlikely to implement expansion simply for Apple, as TPK’s over-reliance on Apple has caused declining performance. TPK's goal is to minimize the dependence on a single client, especially Apple.
As for iPhone6, Apple may still make advantage of IN-CELL or Hybrid In-cell/On-cell. Currently, JDI has performed maturely in Hybrid In-cell/On-cell, which can be accomplished through the original IN-CELL production lines to meet Apple’s huge demand with higher signal-to-noise ratio (SNR) and panel yield. Besides, such technology is fit for large-sized cell phones. However, only JDI and Snaptics master the patent of the technology, so Apple needs to buy the patent from them and then transfer it to Sharp and LG DISPLAY.
Few softwares make optimal design for Windows 8 Modern UI touch, and users can see the touch function mostly from Windows boot screen and photo / video zoom, while the most commonly used MS Office, browsers and other softwares do not need touch function. Therefore, touch laptop buyers feel sort of disappointed. The less useful the touch function becomes, the less consumers will pay, and the smaller the touch laptop market will be.
The cost difference between touch laptops (or Ultrabooks) and non-touch laptops does not rest with reduced costs of touch screens. Touch screen costs have dropped by over 50% over 2013, but the prices of solid state disk (SSD), lithium polymer batteries, thin casings and motherboards applied to Ultrabooks remain unchanged. Ultrabooks are still more expensive than ordinary laptops, so consumers prefer the latter.
1. Introduction to Touch Screen
1.1 Development Course
1.2 GLASS-TO-GLASS (G/G)
1.3 GLASS-TO-FILM-TO-FILM (G/F/F)
1.4 G1F
1.5 TOC
1.6 ON-CELL
1.7 IN-CELL
1.8 Development Trend of Mobile Phone Touch Screen Technology
1.9 Development Trend of Medium-sized Touch Screen
1.10 Development Trend of Laptop Touch Screen
1.11 AIO PC Touch Screen
1.12 Advantages of METAL MESH
1.13 METAL MESH Supply Chain
1.14 Silver Nanofibers Wires
2 Touch Screen Downstream Market
2.1 Touch Screen Market Size
2.2 Laptop Market
2.3 Tablet PC Market
2.4 Mobile Phone Market
2.4.1 Global Mobile Phone Market Size
2.4.2 Smart Phone Market and Industry
2.4.3 Chinese Mobile Phone Market and Industry
3 Touch Screen Industry
3.1 Touch Screen Industry Chain
3.2 ITO FILM Market Size
3.3 ITO FILM Supply Chain
3.4 ITO FILM Industry
3.5 Ranking of Touch Screen Vendors
3.6 Relationship between Touch Screen Vendors and Clients
4. Small and Medium-sized Display Companies
4.1 LTPS and IGZO Market
4.2 JAPAN DISPLAY
4.3 TIANMA
4.4 TRULY
4.5 HANNSTAR
4.6 CPT
4.7 AUO
4.8 INNOLUX
4.8.1 GIS
4.9 LG DISPLAY
4.10 SMD
5 Touch Screen Vendors
5.1 WINTEK
5.2 YOUNG FAST
5.3 JTOUCH
5.4 S-MAC
5.5 ILJIN DISPLAY
5.6 MELFAS
5.7 ELK
5.8 DIGITECH SYSTEMS
5.9 SINTEK PHOTRONIC
5.10 CANDO
5.11 NISSHA PRINTING
5.12 TPK
5.13 EELY
5.14 MUTTO OPTRONICS
5.15 LAIBAO HI-TECH (LAIBAO HI-TECH)
5.16 SHENZHEN O-FILM TECH
5.17 EACH
5.18 Top Touch
5.19 Junda
Glass-to-Glass (G/G) Projective Capacitive (P-cap) Touch Screen
Glass-to-Film-to-Film (G/F/F) P-cap Touch Screen
G1F Touch Screen
TOC Touch Screen
Sheet Type TOC
Piece Type TOC
Mobile Phone Touch Screen by Technology, 2011-2016E
Medium-sized Touch Screen by Technology, 2011-2015E
Laptop Touch Screen Shipment by Technology, 2012-2016E
AIO PC Touch Screen Shipment by Technology, 2012-2016E
Nano Silver Supply Chain
Global Touch Screen Market Size (by Value), 2010-2016E
Global Touch Screen Market Size (by Shipment), 2010-2016E
Global Touch Screen Market Shipment by Application, 2010-2015E
Laptop Shipment, 2008-2015E
Shipment of Major Global Laptop ODM Vendors, 2010-2013
Global Tablet PC Shipment, 2011-2016E
Market Share of Major Tablet PC Brands, 2013
Output of Global Tablet PC Vendors, 2012-2013
Global Mobile Phone Shipment, Q1 2011-Q4 2013
Global Mobile Phone Shipment, 2007-2014
Global 3G/4G Mobile Phone Shipment by Region, 2011-2014
Worldwide Smartphone Sales to End Users by Vendor, 2013
Worldwide Smartphone Sales to End Users by Operating System, 2013
Worldwide Mobile Phone Sales to End Users by Vendor, 2013
Shipment and Market Share of Smart Phone Operating Systems, Q2 2013
Shipment and Market Share of Major Android Mobile Phone Vendors, Q2 2013
Shipment and Market Share of Major Windows Phone Smart Phone Vendors, Q2 2013
Smart Phone Shipment of Chinese Major Vendors, 2011-2013
China's Monthly Mobile Phone Output, Feb-Dec 2013
China's Monthly Mobile Phone Export Value, 2013
Monthly Revenue and Profit of China Mobile Phone Industry, Feb-Dec 2013
Market Share of Major Vendors in Chinese Mobile Phone Market, 2013
China's Mobile Phone Output by Region, Jan-Nov 2013
Touch Screen Industry Chain
Touch Screen Production Process
Touch Screen Material Market Size, 2012-2017E
ITO Film Shipment, 2011-2016E
ITO Film Market Size, 2011-2016E
ITO Film Structure
ITO Film Supply Chain
Comparison between Major Vendors in Performance of ITO Film
Market Share of Major Global ITO Film Vendors, 2013
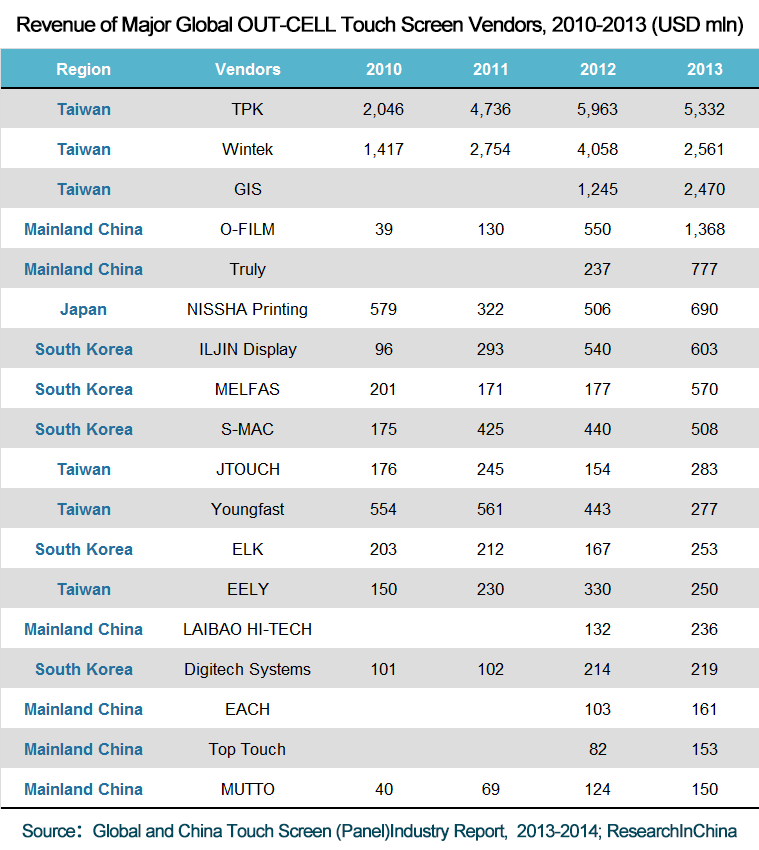
Revenue of Major Global OUT-CELL Touch Screen Vendors, 2010-2013
Operating Margin of Major Global OUT-CELL Touch Screen Vendors, 2012-2013
Shipment of Major Touch Screen Vendors, 2010-2013
Market Share of Samsung's Mobile Phone Touch Screen Suppliers, 2012-2013
Market Share of Samsung's Tablet PC Touch Screen Suppliers, 2012-2013
Nokia's Touch Screen Supplier Structure, 2012
LG's Touch Screen Supplier Structure, 2012
HTC's Touch Screen Supplier Structure, 2012
LTPS Mobile Phone Panel Shipment, Q1 2013-Q4 2014
Capacity of Global LTPS Production Lines, 2013-2014
Capacity of Global LTPS Vendors, 2013-2015E
TIANMA’s Revenue and Operating Margin, 2005-2013
Financial Data of TIANMA's Subsidiaries, 2012-2013
TRULY’s Revenue and Operating Margin, 2005-2013
TRULY’s LCD Revenue by Technology, 2006-2011
TRULY’s Semiconductor Revenue by Business, 2012-2013
TRULY’s Major Mobile Phone LCD Clients
TRULY’s Major Automotive Display Clients
TRULY’s Touch Screen Capacity
TRULY’s CCM Major Clients
HANNSTAR’s Organizational Structure
HANNSTAR’s Revenue and Operating Margin, 2006-2014
HANNSTAR’s Quarterly Revenue, Gross Margin and Operating Margin, Q3 2012-Q4 2013
HANNSTAR’s Quarterly Shipment, Q3 2012-Q4 2013
HANNSTAR’s Quarterly Revenue by Size, Q3 2012-Q4 2013
Distribution of HANNSTAR’s Bases
CPT’s Revenue and Operating Margin, 2004-2014
CPT’s Monthly Revenue and Shipment, Jan 2013-Feb 2014
AUO’s Revenue and Operating Margin, 2004-2013
AUO’s Monthly Revenue and Growth Rate, Jan 2012-Jan 2014
AUO’s Revenue by Application, Q1 2011-Q4 2013
AUO's Small and Medium-sized Product Shipment and Revenue, Q1 2011-Q4 2013
AUO's Revenue by Size, Q1 2011-Q4 2013
Capacity of AUO's Production Lines, Q1 2012
AUO's Capacity, Q4 2012-Q1 2014
INNOLUX's Revenue and Operating Margin, 2007-2013
INNOLUX's Revenue and Gross Margin, Q1 2012-Q4 2013
INNOLUX's Revenue by Application, Q1 2012-Q4 2013
INNOLUX's Revenue by Application, 2011-2012
INNOLUX's Revenue by Size, Q1 2012-Q4 2013
INNOLUX's Small and Medium-sized Product Revenue and Shipment, Q1 2012-Q4 2013
INNOLUX's Touch Screen Shipment, Q1 2011-Q4 2012
Capacity of INNOLUX's Production Lines, Q1 2012
Capacity of INNOLUX's Production Lines, Q4 2013
INNOLUX's Touch Sensor Capacity, Q1 2012
INNOLUX's Touch Sensor Capacity, Q4 2013
LG DISPLAY's Revenue and Operating Margin, 2002-2013
LG DISPLAY's Quarterly Revenue, Operating Margin and Gross Margin, Q1 2011-Q4 2013
LGD's Revenue by Application, Q1 2011-Q4 2013
Output of LGD's Production Lines, Q1 2011-Q1 2012
Output of LGD’s Production Lines, Q4 2012-Q4 2013
LGD’s Shipment and ASP, Q4 2012-Q4 2013
LGD’s Revenue by Region, 2012-2013
Assets, Liabilities, Sales and Net income of LGD's Key Subsidiaries, 2013
SMD’s Revenue and Operating Margin, 2009-2014
SMD’s Quarterly Revenue and Operating Margin, Q1 2011-Q4 2013
SMD’s AMOLED Capacity, 2010-2013
Revenue of Samsung LCD Division by Application, 2012-2014
SMD’s AMOLED Capacity, Q1 2011-Q4 2014
WINTEK's Revenue and Gross Margin, 2003-2013
WINTEK's Revenue and Operating Margin, 2003-2013
WINTEK's Monthly Revenue, Feb 2012 - Feb 2014
WINTEK's Global Presence
WINTEK's Revenue by Technology, 2006-2011
WINTEK's Revenue by Client, 2009-2012
WINTEK's Sales Volume, Sales Revenue and ASP, 2010-2011
WINTEK's Capacitor Touch Screen Capacity
WINTEK's Touch Screen COVER GLASS Capacity
WINTEK's ATT Structure
WINTEK's ATT Process
Comparison between WINTEK's ATT and Traditional Capacitor G / G Touch Screen
Financial Conditions of WINTEK's Subsidiaries in Mainland China, 2011
YOUNG FAST's Revenue and Operating Margin, 2005-2013
YOUNG FAST's Monthly Revenue and Growth Rate, Feb 2012-Feb 2014
YOUNG FAST's Revenue by Client, 2010-2013
YOUNG FAST's Capacity, Output and Sales Volume, 2008-2012
YOUNG FAST's Factory Distribution
JTOUCH's Revenue and Operating Margin, 2006-2013
JTOUCH's Monthly Revenue and Growth Rate, Feb 2012-Feb 2014
JTOUCH's Capacity, Output and Sales Volume, 2008-2012
JTOUCH's Revenue by Region, 2008-2011
SMAC's Revenue and Operating Margin, 2005-2014
SMAC's Production Process
SMAC's Quarterly Revenue by Business, Q1 2013 -2014
ILJIN Display's Organizational Structure
ILJIN Display's Revenue and Operating Margin, 2008-2014
ILJIN Display's Quarterly Revenue and Operating Margin, Q1 2011-Q4 2013
ILJIN Display's Revenue by Business, Q1 2011-Q4 2013
ILJIN Display's 7-inch TSP Output, Q1 2010-Q4 2013
Melfas' Revenue and Operating Margin, 2007-2014
Melfas' Revenue by Product, 2007-2014
Melfas' Quarterly Revenue and Operating Margin, Q1 2011-Q4 2013
ELK's Revenue and Operating Margin, 2006-2013
ELK's Revenue by Application, 2012-2013
ELK's Revenue by Client, 2012-2013
Digitech Systems' Revenue and Operating Margin, 2007-2014
Digitech Systems' Revenue by Product, 2009-2012
Sintek Photronic's Organizational Structure
Sintek Photronic's Revenue and Operating Margin, 2004-2013
Sintek Photronic's Monthly Revenue and Growth Rate, Feb 2012-Feb 2014
CANDO's Revenue and Operating Margin, 2004-2013
CANDO's Monthly Revenue and Growth Rate, Feb 2012-Feb 2014
NISSHA's Revenue and Operating Margin, FY2005-FY2014
NISSHA's Revenue by Business, FY2009-FY2014
NISSHA's Touch Panel Revenue by Application, FY2010-FY2014
NISSHA's Quarterly Revenue and Operating Margin, Q4 2010-Q4 2013
NISSHA's Quarterly Touch Panel Revenue and Operating Margin, Q4 2010-Q4 2013
TPK's Organizational Chart
TPK's Revenue, Gross Margin and Operating Margin, 2007-2014
TPK's Quarterly Revenue and Operating Margin, Q1 2011-Q4 2013
TPK's Quarterly Revenue and Gross Margin, Q1 2011-Q4 2013
TPK's Quarterly Revenue and Net Profit Margin, Q1 2011-Q4 2012
TPK's Quarterly Revenue by Size, Q1 2012-Q4 2013
TPK's Quarterly Revenue by Product, Q1 2012-Q3 2013
TPK's Monthly Revenue and Growth Rate, Jan 2012-Jan 2014
TPK's Touch Screen Capacity, Output and Sales Volume, 2008-2013
TPK Holding and Its Affiliated Companies
Revenue and Operating Margin of MUTTO OPTRONICS, 2008-2013
Revenue of MUTTO OPTRONICS by Client, 2012
Organizational Structure of LAIBAO HI-TECH
Revenue and Net Income of LAIBAO HI-TECH, 2005-2014
Revenue of LAIBAO HI-TECH by Business, 2012-H1 2013
Revenue of LAIBAO HI-TECH by Product, 2005-2011
Revenue and Operating Margin of SHENZHEN O-FILM TECH, 2007-2013
Revenue of SHENZHEN O-FILM TECH by Product, 2009-2013
Clients of SHENZHEN O-FILM TECH, 2012
Global and China CMOS Camera Module (CCM) Industry Report, 2020-2026
The global CCM market has been ballooning thanks to expeditious penetration of multi-camera phones and advances in automotive ADAS, being worth $22.723 billion with a year-on-year spike of 16.6% in 20...
Global and China Multi-Layer Ceramic Capacitor (MLCC) Industry Report, 2020-2025
Electronic components like MLCC enjoy a rosy prospect alongside the burgeoning electronic manufacturing, the thriving internet and the prevalence of smart hardware.
MLCC was much sought after and it...
Global and China Voice Coil Motor (VCM) Industry Report, 2019-2025
VCM (voice circle motor or voice coil actuator), a part for smartphone camera, shares around 6% of smartphone camera industry chain value.
Globally, popularity of smartphones such as those with mult...
Global and China Aluminum Electrolytic Capacitor Industry Report, 2019-2025
Chinese aluminum electrolytic capacitor market has been expanding amid a transfer of its downstream industries to China like home appliance illumination, cellphones and computers as well as automatic ...
Global and China Flexible Printed Circuit (FPC) Industry Report, 2019-2025
Flexible printed circuit (FPC) products make their way into consumer electronics like smartphone and tablet PC, in the form of modules for display, touch control, fingerprint recognition, etc. The vol...
Global and China GaAs Industry Report, 2019-2025
Gallium arsenide (GaAs), one of the most mature compound semiconductors, is an integral part of smartphone power amplifier (PA). In 2018, GaAs-based radio frequency (RF) seized over half of the GaAs w...
Global and China Advanced Packaging Industry Report, 2019-2025
The global semiconductor packaging and testing market is enlarging with the prevalence of consumer electronics, automotive semiconductors and the Internet of Things (IoT), with its size edging up 2.5%...
Global and China MLCC Electronic Ceramics Industry Report, 2019-2025
MLCC is mainly used in audio and video equipment, mobile phones, computers and automobiles. The prospective boom of MLCC formula powder hinges on demand: 1) The accelerated renewal of consumer electro...
Global and China OLED Industry Report, 2019-2025
OLED, a new-generation display technology, features simple display structure, green consumables and flexibility and can be rolled up, which makes it easier to transport and install without considering...
Global and China Camera Module Industry Report, 2019-2025
Affected by factors like the maturity of mobile phone markets worldwide and the prolonged replacement of mobile phone by users, the mobile phone market has undergone a slowdown in growth rate. From Q4...
Global and China Multi-Layer Ceramic Capacitor (MLCC) Industry Report, 2018-2023
MLCC finds most application in consumer electronics, automobile and industrial fields and gets beefed up remarkably with the approaching 5G era of cellphones and tablet PCs, the advances in automotive...
Global and China Aluminum Electrolytic Capacitor Industry Report, 2018-2023
Aluminum electrolytic capacitor, a core electronic component, is widely used in consumer electronics, computers and peripherals, industry, electric power, lighting and automobiles.
Global aluminum e...
Global and China CMOS Camera System Industry Report, 2017-2021
Global CCM (CMOS Camera Module) market was worth USD16.611 billion in 2015, a year-on-year rise of 3.8% from 2014, the slowest rate since 2010. Global market fell modestly in 2016 due to a drop in shi...
Global and China Organic Light-Emitting Diode (OLED) Industry Report, 2017-2021
Global OLED market size approximated USD15.7 billion in 2016, a 20.8% rise from a year earlier. Stimulated by reports that Apple will adopt OLED screen for multiple iPhone models in 2017-2018, OLED sc...
Global and China CMOS Camera System Industry Report, 2016-2020
Global and China CMOS Camera System Industry Report, 2016-2020 covers the following:1. Analysis of CMOS Image Sensor (CIS) Industry and Market, with 7 vendors involved.2. Analysis of CMOS Camera Lens ...
Global and China Multi-layer Ceramic Capacitor (MLCC) Industry Report, 2017-2020
The rapid development of consumer electronics and industrial intelligentization has greatly promoted the booming of passive components including multi-layer ceramic capacitor (MLCC). In 2015, China’s ...
Global PCB Industry Report, 2015-2020
Global PCB Industry Report, 2015-2020 highlights the followings:1. Global PCB Market and Status Quo of the Industry2. Global Downstream Markets of PCB3. Mobile Phone PCB Trends4. Tablet PC/Laptop Comp...
Global and China Organic Light-Emitting Diode (OLED) Industry Report, 2016-2020
The OLED market has been developing rapidly worldwide over the recent years, and its market size reached USD13 billion in 2015. With technology and capacity construction, OLED (from small-sized panels...