Global and China Fluorite Industry Report, 2014-2016
-
May 2014
- Hard Copy
- USD
$2,600
-
- Pages:123
- Single User License
(PDF Unprintable)
- USD
$2,400
-
- Code:
PQ007
- Enterprise-wide License
(PDF Printable & Editable)
- USD
$3,800
-
- Hard Copy + Single User License
- USD
$2,800
-
Of extensive use, fluorite is widely applied in fields of metallurgy, building materials, fluorine chemical industry, etc. In 2013, global fluorite reserves attained about 240 million tons, mainly distributed in a few countries like South Africa, Mexico, China and Mongolia, wherein China’s fluorite reserves accounted for about 10% of the world's total.
China is the uppermost fluorite producing country in the world with fluorite output approximating 4.3 million tons in 2013, accounting for 64% of the world’s total. However, due to the overquick exploration, fluorite reserves in China become increasingly deficient. Thus the government takes active measures to protect fluorite resources, including execution of fluorite exploration volume limit and industry entry. Especially, after Ministry of Industry and Information Technology released two batches of production line lists in conformity with Fluorite Industry Access Standards successively in 2012 and 2013, fluorite output in China had presented a downward trend. It is estimated that China’s fluorite output will slip to 2.85 million tons in 2016, proportion thereof down to 44.3% or so of the global total.
Against the background of a predicted decreasing fluorite output, China’s fluorite demand will mainly count on fluorite import and technology of fluorine extraction from phosphate. Fluorite equivalent in phosphate ore (by calcium fluoride) in China reached 265.8 million tons, equal to 11 times current fluorite reserves in China, which provides a sound material basis for China’s fluorite substitution. However, it still takes time to realize large-scale fluorite substitution due to immature production process of fluorine extraction from phosphate.
Multiple fluorite enterprises in the world are strengthening their integration of upstream and downstream industry chain of fluorite resources for achieving higher added value of products, and avoiding unfavorable price influence of fluorite market, etc.
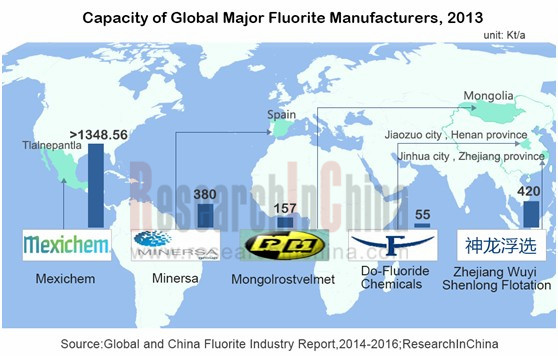
Mexichem is an enterprise with comparatively abundant fluorite resource reverses, fluorite capacity thereof in 2013 reaching at least 1,348 kt/a. Currently, it is devoted to production of Fluoropolymers and Fluoroelastomers with higher added value.
As the second largest acid fluorite producer, Minersa achieves acid fluorite capacity of around 380 kt/a. Via its subsidiary Derivados del Flúor (DDF), Minersa has got through fluorite-fluorine chemical industry chain. DDF is the top producer and distributor of European inorganic fluorides and its products are extensively utilized in areas of refrigerant, air-conditioning system, chemical building, etc.
Main fluorite manufacturers in China include Centralfluor Industries Group, Inc., Zhejiang Wuyi Shenlong Flotation Co., Ltd., etc., and fluorite capacity of them respectively attains 550 kt/a and 420 kt/a. Whereas, comparatively speaking, China’s fluorite enterprises are big but not strong and poor in downstream industry extension. While enterprises oriented to fluorine chemical industry, such as Sinochem Lantian Co., Ltd., Zhejiang Juhua Co., Ltd., Do-Fluoride Chemicals Co., Ltd., etc., accelerate improving fluorite-fluorine chemical industry chain layout. Taking Do-Fluoride Chemicals Co., Ltd. as an example, despite of the small fluorite capacity of only 55kt/a, the company has completed its “fluorite-lithium hexafluorophosphate-lithium ion battery” industry chain layout and become one of the major suppliers of lithium hexafluorophosphate (capacity of 2,200 t/a) in the world.
The report includes the following aspects:
 Global fluorite reserves, supply and demand analysis;
Reserves, competition pattern, supply & demand, import & export, and industry policies in China fluorite industry;
Influence of fluorite downstream market segments (such as building materials, fluorine chemical, iron and steel industry) on fluorite development;
Operation, fluorite business and development trends of six global and nine Chinese fluorite players.
1 Overview of Fluorite
1.1 Introduction
1.2 Application
1.3 Mining Process
2 Global Fluorite Industry
2.1 Supply
2.1.1 Reserves
2.1.2 Output
2.1.3 Global Trade Structure
2.1.4 Fluorite Output of Major Countries
2.2 Consumption
2.2.1 Consumption Structure
2.2.2 Fluorite Consumption in Developed Countries
3 China Fluorite Industry
3.1 Supply
3.1.1 Reserves
3.1.2 Characteristics of Fluorite Ore
3.1.3 Output
3.1.4 Producers
3.2 Demand
3.2.1 Building Materials Industry
3.2.2 Fluorine Chemical Industry
3.2.3 Iron and Steel Industry
3.3 Fluorite Price
3.4 Industrial Policy
3.5 Extraction of Fluoride from Phosphorite
4 Fluorite Import and Export in China
4.1 Fluorite with Calcium Fluoride Content>97%
4.2 Fluorite with Calcium Fluoride Content≤97%
4.3 Summary
5 Major Global Fluorite Enterprises
5.1 Mexichem
5.1.1 Profile
5.1.2 Operation
5.1.3 Revenue Structure
5.1.4 Fluorine Chemical Business
5.1.5 Fluorite Resources
5.2 SepFluor
5.2.1 Profile
5.2.2 Operation
5.2.3 Fluorite Business
5.3 Mongolrostsvetmet
5.3.1 Profile
5.3.2 Fluorite Business
5.3.3 Fluorite Projects
5.4 Minersa Group
5.4.1 Profile
5.4.2Fluorite Business
5.4.3 Fluorine Chemical Business
5.5 Vanoil Energy
5.5.1 Profile
5.5.2Operation
5.5.3 Fluorite Business
5.6 Rusal (Yaroslavsk)
5.6.1 Profile
5.6.2 Fluorite Business
6 Major Chinese Fluorite Enterprises
6.1 Sinochem Lantian
6.1.1 Profile
6.1.2 Operation
6.1.3 Fluorine Chemical Business
6.1.4 Fluorite Resources
6.2 China Kings Resources Group
6.2.1 Profile
6.2.2 Fluorite Resources
6.3 Centralfluor Industries Group
6.3.1 Profile
6.3.2 Fluorite Resources
6.3.3 Fluorine Chemical Business
6.4 Shenlong Flotation
6.4.1 Profile
6.4.2 Operation
6.4.3 Fluorite Resources
6.5 Shen Zhou Mining & Resources
6.5.1 Profile
6.5.2 Operation
6.5.3 Revenue Structure
6.5.4 Fluorite Business
6.5.5 Fluorite Resources
6.6 Juhua
6.6.1 Profile
6.6.2 Operation
6.6.3 Revenue Structure
6.6.4 Gross Margin
6.6.5 R&D Investment
6.6.6 Clients and Suppliers
6.6.7 Fluorite Resources
6.6.8 Fluorine Chemical Business
6.6.9 Forecast and Outlook
6.7 DO-Fluoride
6.7.1 Profile
6.7.2 Operation
6.7.3 Revenue Structure
6.7.4 Gross Margin
6.7.5 R&D Investment
6.7.6 Clients and Suppliers
6.7.7 Fluorite Resources
6.7.8 Fluorine Chemical Business
6.7.9 Forecast and Outlook
6.8 Zhejiang Yongtai Technology
6.8.1 Profile
6.8.2 Operation
6.8.3 Revenue Structure
6.8.4 Gross Margin
6.8.5 R & D
6.8.6 Clients and Suppliers
6.8.7 Fluorite Resources
6.8.8 Forecast and Outlook
6.9 Thaihot Group
6.9.1 Profile
6.9.2 Operation
6.9.3 Revenue Structure
6.9.4 Gross Margin
6.9.5Fluorite and Fluorine Chemical Business
6.9.6 Forecast and Outlook
7. Summary and Forecast
7.1 Summary
7.2 Forecast
Classification of Fluorite (by Calcium Fluoride Content)
Application of Fluorite
Fluorite Reserves of Major Countries in the World, 2013
Global Fluorite Output and Growth Rate, 2007-2013
Fluorite Output of Major Countries in the World, 2009-2013
Fluorite Reserve-Production Ratio of Major Countries in the World, 2013
Global Fluorite Consumption Structure (by Field), 2013
Global Fluorite Consumption Structure (by Region), 2013
Fluorite Consumption Structure of the United States, Western Europe and Japan (by Field), 2013
Fluorite Sources of Major Developed Countries in Europe and America
Fluorite Deposit Distribution in China
Number of Fluorite Mines in Some Provinces and Regions of China
China’s Fluorite Output and YoY Growth Rate, 2007-2013
Capacity of Major Fluorite Manufacturers in China, 2013
Fluorite Resources Control of Chinese Listed Fluorine Chemical Companies, 2013
Apparent Consumption of Fluorite and YoY Growth in China, 2007-2013
Downstream Fluorite Consumption Structure in China, 2013
Capacity of Major Fluorite Manufacturers Worldwide, 2013
Revenue of Major Fluorite Manufacturers in China, 2013-2014
Net Income of ajor Fluorite Manufacturers in China, 2013-2014
Global Fluorite Output and Growth Rate, 2012-2016E
Fluorite Output of Major Countries in the World, 2009-2013
Import & Export Volume of Fluorite in China, 2012-2016E
Apparent Consumption and Growth Rate of Fluorite in China, 2012-2016E
Global Fluorite Trade Volume (in terms of Calcium Fluoride content), 2013
Global Fluorite Export Market Structure (in terms of Calcium Fluoride content), 2013
Global Fluorite Import Market Structure (in terms of Calcium Fluoride content), 2013
Application of Fluorite in Building Materials Industry
China's Cement Output and YoY Growth, 2006-2013
Import & Export Volume of Hydrofluoric Acid in China, 2006-2013
Import & Export Value of Hydrofluoric Acid in China, 2006-2013
Import & Export Average Price of Hydrofluoric Acid in China, 2006-2013
China's Flat Glass Output and YoY Growth Rate, 2006-2013
Value Adding Path of Fluorine Chemical Products
Hydrofluoric Acid Capacity, Output and Operating Rate in China, 2006-2013
China’s Hydrofluoric Acid Export Destinations and Export Volume, 2009-2012
China’s Hydrofluoric Acid Export Destinations and Export Value, 2009-2012
Export Volume, Value and Average Price of Aluminum Fluoride in China, 2010-2013
Export Volume, Value and Average Price of Cryolite in China, 2006-2013
Ex-factory Price of Anran Fluorite in Zhejiang, 2011-2014
Fluorite Industrial Policies in China, 1999-2013
Quota on Fluorite Mining in China, 2010-2011
Production Lines in Compliance with Fluorite Industry Access Standards" (first batch)
Production Lines in Compliance with Fluorite Industry Access Standards" (2nd batch)
Fluorine Resources in Chinese Fluorite and Phosphorite, 2013
Policies about Extraction of Fluorine from Phosphorite in China, 2010-2012
Import and Export Volume of Fluorite with Calcium Fluoride Content>97% in China, 2007-2013
Import and Export Unit Price of Fluorite with Calcium Fluoride Content>97% in China, 2007-2013
Source Distribution of Fluorite with Calcium Fluoride Content>97% Imported by China (by Import Volume), 2013
Destination Distribution of Fluorite with Calcium Fluoride Content>97% Exported by China (by Export Volume), 2013
Import and Export Volume of Fluorite with Calcium Fluoride Content≤97% in China, 2007-2013
Import and Export Unit Price of Fluorite with Calcium Fluoride Content≤97% in China, 2007-2013
Source Distribution of Fluorite with Calcium Fluoride Content≤97% Imported by China (by Import Volume), 2013
Destination Distribution of Fluorite with Calcium Fluoride Content≤97% Exported by China (by Export Volume), 2013
Fluorite Import and Export Volume in China, 2007-2013
Import and Export Unit Price of Fluorite in China, 2007-2013
Net Sales and Net Income of Mexichem, 2009-2013
Net Sales Structure of Mexichem (by Product), 2009-2012
Net Sales Structure of Mexichem (by Region), 2009-2013
Fluorine Chemical Subsidiaries of Mexichem, 2013
Net Sales and Operating Income of Mexichem’s Fluorine Chemical Industrial Chain, 2009-2013
Extension of Mexichem’s Fluorine Chemical Industrial Chain
Assets and Liabilities of SepFluor, FY2011-FY2013
Other Revenue and Net Income of SepFluor, FY2011-FY2013
Fluorite Capacity of Mongolrostsvetmet (by Fluorite Production Units and Fluorite Type))
Fluorite Production Units of Mongolrostsvetmet
Fluorite Quality Parameters of Mongolrostsvetmet
Net Loss of Vanoil, FY2010-FY2013
Revenue and Net Income of Fluormin, 2010-2013
Subsidiaries of Sinochem Lantian
Revenue and Net Income of Sinochem Lantian, 2009-2012
Revenue Structure of Sinochem Lantian (by Product), 2009-2012
Capacity of Fluorine Chemical Products of Kings Fluoride Industry, 2013
Capacity of Main Products of Centralfluor Industries Group, 2012
Companies Invested by China Kings Resources Group
Main Products and Capacity of China Kings Resources Group, 2013
Fluorite Mines and Energy/Chemical Companies of Centralfluor Industries Group
Fluorite Resources of Centralfluor Industries Group, 2012
Fluorine Chemical Capacity Distribution of Centralfluor Industries Group (by Producer and Product)
Financial Indicators of Shenlong Flotation, 2008-2009
Main Fluorite Products and Their Applications of Shenlong Flotation
Output of Fluorite Products of Shenlong Flotation, 2009-2010
Main Subsidiaries and Main Business of Shen Zhou Mining & Resources
Ownership of Major Subsidiaries of Shen Zhou Mining & Resources, 2012
Revenue and Net Income of Shen Zhou Mining & Resources, 2009-2012
Revenue of Shen Zhou Mining & Resources (by Product), 2010-2012
Revenue Structure of Shen Zhou Mining & Resources (by Product), 2010-2012
Fluorite Revenue and Net Income of Shen Zhou Mining & Resources, 2009-2012
Name List, Revenue Contribution and Proportion of Top 3 Clients of Shen Zhou Mining & Resources in Fluorite Business, 2011
Fluorite Lump Ore Output and Its Proportion in Total Output of Shen Zhou Mining & Resources, 2008-2011
Fluorite Powder Output and Its Proportion in Total Output of Shen Zhou Mining & Resources, 2008-2011
Average Selling Prices of Fluorite Lump Ore and Fluorite Powder of Shen Zhou Mining & Resources, 2008-2011
Distribution of Fluorite Resources of Shen Zhou Mining & Resources, 2012
Classification of Fluorite Resources of Xiang Zhen Mining
Revenue and Net Income of Juhua, 2008-2014
Revenue of Juhua (by Product), 2010-2013
Revenue Structure of Juhua (by Product), 2010-2013
Revenue of Juhua (by Region), 2010-2012
Revenue Structure of Juhua (by Region), 2010-2012
Gross Margin of Juhua’s Main Products, 2008-2014
R&D Investment and Its Proportion to Total Revenue of Juhua, 2008-2013
Fluorine Chemical-related Projects and Investment of Juhua as of end of 2013
Revenue Contribution and Proportion of Juhua’s Top 5 Clients, 2009-2013
Name List, Revenue Contribution and Proportion of Juhua’s Top 5 Clients, 2013
Juhua’s Purchase Amount and Proportion for Top 5 Suppliers, 2009-2013
Name List, Procurement Amount and Proportion of Juhua’s Top 5 Suppliers, 2012
Fluorine Powder Revenue of Juhua, 2012-2013
Subsidiaries of Juhua in Fluorine Chemical Field, 2013
Revenue and Net Income of Juhua, 2010-2016E
Revenue and Net Income of DO-Fluoride, 2008-2014
Revenue of DO-Fluoride (by Product), 2010-2013
Revenue of DO-Fluoride (by Region), 2010-2013
Gross Margin of DO-Fluoride’s Main Products, 2008-2014
R&D Investment and Its Proportion to Total Revenue of DO-Fluoride , 2012-2013
Investment Progress of Fluorine Chemical Project of DO-Fluoride, as of the end of 2013
Revenue Contribution and Proportion of DO-Fluoride’s Top 5 Clients, 2009-2013
DO-Fluoride’s Purchase Amount and Proportion for Top 5 Suppliers, 2009-2013
Fluorite Mines Invested by DO-Fluoride
DO-Fluoride and Related Fluorite Companies (as of 2013)
Major Products and Operation of Fluorine Chemical Subsidiaries of DO-Fluoride, 2013
Revenue and Net Income of DO-Fluoride, 2010-2016E
Revenue and Net Income of Zhejiang Yongtai Technology, 2008-2014
Revenue of Zhejiang Yongtai Technology (by Product), 2010-2013
Revenue of Zhejiang Yongtai Technology (by Region), 2010-2013
Gross Margin of Main Products of Zhejiang Yongtai Technology, 2008-2014
R & D Expenses and Proportion in Total Revenue of Zhejiang Yongtai Technology, 2008-2013
Revenue Contribution and Proportion of Zhejiang Yongtai Technology’s Top 5 Clients, 2009-2013
Name List, Revenue Contribution and Proportion of Top 5 Clients of Zhejiang Yongtai Technology, 2012
Zhejiang Yongtai Technology’s Purchase Amount and Proportion for Top 5 Suppliers, 2009-2013
Name List, Procurement Amount and Proportion of Zhejiang Yongtai Technology’s Top 5 Suppliers, 2012
Revenue and Net Income of Zhejiang Yongtai Technology, 2012-2016E
Revenue and Net Income of Thaihot Group, 2008-2014
Revenue of Zhejiang Yongtai Technology (by Product), 2010-2013
Revenue of Thaihot Group (by Region), 2010-2013
Gross Margin of Main Products of Thaihot Group, 2008-2014
Revenue and Net Income of Zhejiang Yongtai Technology, 2012-2016E
Global and China Optical Fiber Preform Industry Report, 2021-2026
Optical fiber preforms play a key role in the optical fiber communication industry chain. The global construction of 4G and FTTH requires less optical fiber and cable, which has dragged down the deman...
Global and China Photoresist Industry Report, 2021-2026
Since its invention in 1959, photoresist has been the most crucial process material for the semiconductor industry. Photoresist was improved as a key material used in the manufacturing process of prin...
Global and China Needle Coke Industry Report, 2021-2026
Needle coke is an important carbon material, featuring a low thermal expansion coefficient, a low electrical resistivity, and strong thermal shock resistance and oxidation resistance. It is suitable f...
Global and China 3D Glass Industry Report, 2021-2026
3D curved glass is light and thin, transparent and clean, anti-fingerprint, anti-glare, hard and scratch-resistant, and performs well in weather resistance. It is applicable to terminals such as high-...
Global and China Graphene Industry Report, 2020-2026
Graphene, a kind of 2D carbon nanomaterial, features excellent properties such as mechanical property and super electrical conductivity and thermal conductivity. Its downstream application ranges from...
Global and China Optical Fiber Preform Industry Report, 2020-2026
Optical fiber preform as a hi-tech product and a crucial link in the optical fiber industry chain contributes to 70% or so of profit margin. Global 4G and FTTH construction at dusk leads to the shrink...
Global and China 3D Glass Industry Report, 2020-2026
Global 3D glass market has been enlarging over the recent years amid demetallization of smartphone back covers and popularity of smart wearables, to approximately $2.86 billion in 2019 and to an estim...
Global and China Photoresist Industry Report, 2020-2026
In 2019, global photoresist market was valued at $8.3 billion, growing at a compound annual rate of 5.1% or so since 2010, and it will outnumber $12.7 billion in 2026 with advances in electronic techn...
Global and China Synthetic Diamond Industry Report, 2020-2026
While its mechanical property is given full play in fields like grinding and cutting, diamond with acoustic, optical, magnetic, thermal and other special properties, as superconducting material, intel...
Global and China Needle Coke Industry Report, 2020-2026
With the merits like small resistivity, excellent resistance to impact and good anti-oxidation property, needle coke has been widely used in ultra-high power graphite electrodes, nuclear reactor decel...
Global and China Optical Fiber Preform Industry Report, 2019-2025
Optical fiber preform, playing an important role in the optical fiber and cable industry chain, seizes about 70% profits of optical fiber. Global demand for optical fiber preform stood at 16.2kt in 20...
China Silicon Carbide Industry Report, 2019-2025
Silicon carbide (SiC) is the most mature and the most widely used among third-generation wide band gap semiconductor materials. Over the past two years, global SiC market capacity, however, hovered ar...
Global and China Photoresist Industry Report, 2019-2025
Photoresist, a sort of material indispensable to PCB, flat panel display, optoelectronic devices, among others, keeps expanding in market size amid the robust demand from downstream sectors. In 2018, ...
Global and China Graphene Industry Report, 2019-2025
Graphene is featured with excellent performance and enjoys a rosy prospect. The global graphene market was worth more than $100 million in 2018, with an anticipated CAGR of virtually 45% between 2019 ...
Global and China 3D Glass Industry Chain Report, 2019-2025
The evolution of AMOLED conduces to the steady development of 3D curved glass market. In 2018, the global 3D glass market expanded 37.7% on an annualized basis and reached $1.9 billion, a figure proje...
China Wood Flooring Industry Report, 2019-2025
With the better standard of living and the people’s desire for an elegant life, wood flooring sees a rising share in the flooring industry of China, up from 33.9% in 2009 to 38.9% in 2018, just behind...
Global and China Photovoltaic Glass Industry Report, 2019-2025
In China, PV installed capacity has ramped up since the issuance of photovoltaic (PV) subsidy policies, reaching 53GW in 2017, or over 50% of global total. However, the domestic PV demand was hit by t...
Global and China ITO Targets Industry Chain Report, 2019-2025
Featured by good electrical conductivity and transparency, ITO targets are widely applied to fields of LCD, flat-panel display, plasma display, touch screen, electronic paper, OLED, solar cell, antist...