Global and China LED Industry Report, 2013-2014
-
June 2014
- Hard Copy
- USD
$2,800
-
- Pages:145
- Single User License
(PDF Unprintable)
- USD
$2,600
-
- Code:
ZYW174
- Enterprise-wide License
(PDF Printable & Editable)
- USD
$4,100
-
- Hard Copy + Single User License
- USD
$3,000
-
Global and China LED Industry Report, 2013-2014 mainly includes the following:
1, LED downstream market
2, Trends of LED packaging
3, Sapphire Ingot Industry and Market
4, LED industry
5,39 LED vendors
The LED industry chain consists of six levels: Die (L0), Package (L1), Carrier (L2), Module (L3), Lump (L4) and System (L5). Herein, Die (L0) and Package ( L1) are two focuses.
After the recession in 2011 and 2012, LED saw a turning point in 2013 when Die (L0) and Package (L1) LED market size hit about USD15.188 billion, a rise of 8.3% from 2012. In 2014, the LED market will continue to recover with the market size of USD16,562 million (up 9.0% from 2013). However, the market is expected to slow down in 2015 because oversupply and a new round of price wars may arise.
The global LED industry can be divided into four clusters. First, Europe and America underline general lighting with an emphasis on high reliability and high brightness. Second, Japan embodies the most comprehensive technology, performing outstandingly in both of general lighting and backlight display. Besides, it also targets general lighting, automobiles, mobile phones and TV. Third, South Korea and Taiwan targets laptop display backlight, LED-TV backlight and mobile phone backlight with large shipment, low unit price and low margin. Last, Mainland China centers AlInGaP, outdoor display, advertising screen and signal lights which require low technology and reliability; and in these fields, customers are scattered and the unit price is low.
From 2011 onwards, a large number of Mainland Chinese enterprises have entered the LED industry, causing panic. In reality, none of Mainland Chinese enterprises (including the giant Sanan Optoelectronics) is capable of producing white LED chips or grasping the related patents. Therefore, Mainland China has to import or purchase all needed white LED chips from foreign companies.
Mainland Chinese LED enterprises rely on local governmental subsidies which were huge in 2010-2013. For example, Elec-Tech International was subsidized with RMB270 million in 2010, RMB311 million in 2011, RMB224 million in 2012 and RMB315 million in 2013; but, the net income of the company was only RMB4.6 million in 2013. Without these subsidies, the company might be in a serious loss. Sanan Optoelectronics obtains RMB4 billion from Xiamen’s government in 2014, because Xiamen is eager to make the company return to Xiamen from Wuhu.
Numerous Mainland Chinese LED downstream enterprises are featured with small scale, severe homogenization and intense price war. They cannot get governmental subsidies or conduct financing in the stock market. In 2014, many of them may go bankrupt.
Since 2013, the development of the LED industry has been mainly reflected in the packaging field. In the future, the LED cost reduction depends on packaging instead of Epitaxy. Packaging costs over 50% of the LED chip cost. Currently, COB packaging and Flip chip packaging are not only the most promising, but also represent the future direction.
COB performs strikingly in the field of street lighting and high-power general lighting. But, it is inferior to FLIP-CHIP in the fields where volume is emphasized, such as TV BLU. In addition, FLIP-CHIP’s cost advantage is more obvious. From the perspective of cost and application, COB will become the future mainstream of lighting design.
FLIP-CHIP made its debut in 2008, and became mature in early 2012. Its biggest advantage lies in: it can go to SMT production lines directly under high current without Wirebond and hand welding; besides, its size is small. The market size is estimated to jump from USD1.5 billion in 2013 to USD5.5 billion in 2017. In the BLU field, FLIP-CHIP will become the mainstream.
Prior to 2014, LED cost cutting concentrated in the Epitaxy field, so that Epitaxy vendors witnessed a sharp decline in profits, even many of them exited from the industry due to losses. After 2014, packaging factories will suffer the cost-cutting pressure, so some of them with poor technical capabilities may see descending profits.
1. LED Market
1.1 LED Market Size
1.2 LED Lighting Market Size
1.3 LED Lighting Market Trend
1.4 Japan’s LED Lighting Market
1.5 North America’s LED Lighting Market
1.6 LED for Large-size BLU Market
1.7 Mobile Phone BLU Market
1.8 LED Automotive Lighting
1.8.1 LED Automotive Lighting Market
1.8.2 Automotive Interior LED Lighting
1.8.3 Automotive Exterior LED Lighting
1.9 Digital Billboard Market
2. LED Packaging
2.1 Overview of LED Packaging
2.2 COB Packaging
2.3 Flip Chip Packaging
2.3.1 Overview of Flip Chip Packaging
2.4 Medium Power LED
2.5 Trend of LED Packaging Size
3. LED Industry Chain
3.1 LED Industry Chain
3.2 Sapphire Ingot Market
3.3 Sapphire Ingot Industry
3.4 Sapphire Substrate
3.5 Rubicon
3.6 MOCVD Industry
3.7 AIXTRON
3.8 VEECO
3.9 Geographical Distribution of LED Industry
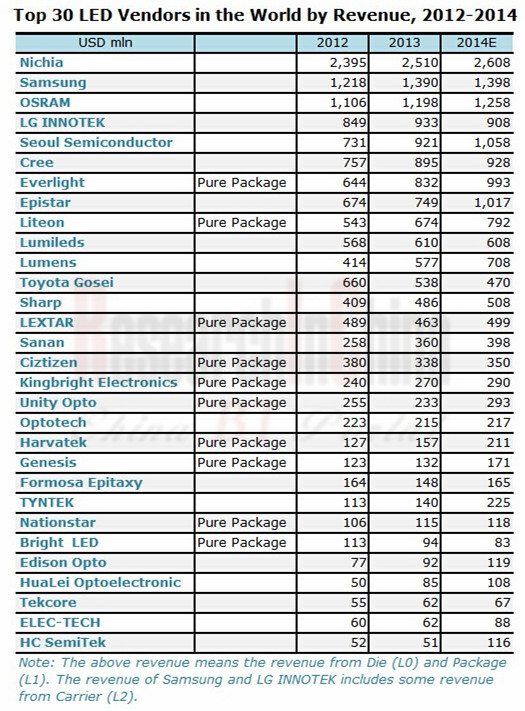
3.10 Global Top 30 LED Vendors by Revenue, 2012-2014
3.11 Taiwan LED Industry
3.12 Summary of Mainland China LED Industry in 2013
3.13 Forecast for China LED Industry in 2014
3.14 White Light LED Patents
4. Taiwanese LED Companies
4.1 Everlight Electronics Co., Ltd.
4.2 Epistar Corporation
4.3 Genesis Photonics Inc.
4.4 Arima Optoelectronics Corp
4.5 Formosa Epitaxy Inc
4.6 Lite-On Technology Corporation
4.7 Bright LED Electronics Corp.
4.8 Opto Tech Corporation
4.9 Harvatek Corporation
4.10 Tekcore
4.11 Unity Opto Technology LTD.
4.12 Huga Optotech Inc.
4.13 Lextar Electronics Corporation
4.14 TYNTEK Corporation
4.15 Edison Opto Corp.
5. LED Companies in Mainland China
5.1 Epiligh Technology Co., Ltd.
5.2 Hunan HuaLei Optoelectronic Corporation
5.3 Hangzhou Silan Azure Co., Ltd.
5.4 Sanan Optoelectronics Co., Ltd.
5.5 Nantong Tongfang Semiconductor Co., Ltd.
5.6 Shandong Inspur Huaguang Optoelectonics Co., Ltd.
5.7 Foshan Nationstar Optoelectronics Co. Ltd.
5.8 Shanghai Rainbow Optoelectronics Material Co. Ltd.
5.9 Dalian Lumei Optoelectronics Corporation
5.10 Xiamen Changelight Co., Ltd.
5.11 Elec-tech International Co., Ltd.
5.12 Neo-Neon Holdings Ltd.
5.13 HC SemiTek Corporation
6. Foreign LED Companies
6.1 Cree Inc.
6.2 Toyoda Gosei Co., Ltd.
6.3 Nichia Corporation
6.4 OSRAM Opto Semiconductor
6.5 Philips Lumileds Lighting Company
6.6 Seoul Semiconductor Co., Ltd.
6.7 LG Innotek Ltd.
6.8 Samsung LED
6.9 Lumens Digital Optics Inc.
Global LED Market Size, 2008-2016E
Distribution of LED Market Size by Application, 2013-2018E
Distribution of Global Lighting Market by Technology, 2009-2017E
LED Chips Volume of Lighting by Application, 2011-2016E
Polices of Various Countries on Lighting Energy Saving
Price Trend of 40W and 60W LED Light Bulbs, May, 2012-Jan. 2014
ASP of LED Bulb in Japan, 2012-2014
Bulbs Sales Growth Rate in Japan, 2012-2014
Market Share of Major Manufacturers in Japan’s LED Lighting Market, 2013
Proportion of Large-size Applications of BLU, 2009-2015E
Global Mobile Phone Shipments, 2007-2014
Geographical Distribution of Global 3G/4G Mobile Phone Shipments, 2011-2014
Global Smartphone Sales to End Users by Vendor in 2013
Global Smartphone Sales to End Users by Operating System in 2013
Global Mobile Phone Sales to End Users by Vendor in 2013
Global LED Automotive Lighting Market Size, 2010-2016E
Costs and Illuminance Trend of Five Automotive Light Sources, 2007-2014
LED Structure
LED Costs
COB Packaging
Sapphire Ingot Demand Volume, 2012-2016E
Sapphire Ingot Demand Value, 2012-2016E
Capacity Trend of Major Global Sapphire Ingot Companies, 2012-2016E
Sapphire Ingot Price by Size, 2012-2016E
Sapphire Substrate Demand by Country/Region, 2012-2016E
Sapphire Substrate Demand by Size, 2012-2016E
Revenue and Operating Margin of Rubicon Technology, 2005-2014
Production Flow of Rubicon Technology
Revenue of Rubicon Technology by Region, 2009-2013
Revenue of Rubicon Technology by Product, 2009-2013
Market Size of LED Front-end Equipment, 2009-2017E
Market Share of Major MOCVD Manufacturers,1999-2013
Global Distribution of Aixtron
Revenue and EBIT Margin of Aixtron, 2003-2014
Quarterly Revenue\New Order\Backlog of Aixtron
Revenue of Aixtron by Application and Region, 2010
Revenue of Aixtron by Application and Region, Q1 2014
Revenue of Aixtron by Application ,1999-2013
Revenue and Operating Margin of VEECO, 2004-2014
Revenue of VEECO by Business, 2011-2013
VEECO’s Main Customers
Distribution of Global LED Output Value by Region, 2013&2014
Taiwanese LED Enterprise Relationship Graph
Operating Margin of Taiwanese LED Companies, 2012-2014
Organizational Structure of Everlight Electronics
Revenue and Operating Margin of Everlight Electronics, 2003-2014
Revenue of Everlight Electronics by Product, 2008-2011
Revenue of Everlight Electronics by Product, 2012-2015E
Revenue of Everlight Electronics by Application, 2005-2015E
Capacity and Utilization Rate of Everlight Electronics, 2013-2014
Monthly Revenue and Growth Rate of Everlight Electronics, Apr. 2012-Apr. 2014
Capacity of Everlight Electronics, 2004-2011
Organizational Structure of Epistar
Revenue and Operating Margin of Epistar, 2004-2014
Monthly Revenue and Growth Rate of Epistar, Apr. 2012-Apr. 2014
Sales of Epistar by Application, 2012-2015E
Sales of Epistar by Product, 2012-2015E
Revenue of Epistar by Product, 2010-2012
Sales of Epistar by Customer, 2012
Revenue and Gross Margin of Genesis Photonics, 2003-2014
Revenue and Gross Margin of Arima Optoelectronics, 2002-2012
Monthly Revenue and Growth Rate of Arima Optoelectronics, May 2010-May 2012
Revenue and Operating Margin of Formosa Epitaxy, 2002-2014
Monthly Revenue and Growth Rate of Formosa Epitaxy, Apr. 2012-Apr. 2014
Revenue of Formosa Epitaxy by Product, 2009-2013
Capacity of Formosa Epitaxy, 2012-2013
Monthly Revenue and Growth Rate of Bright LED Electronics, Apr. 2012-Apr. 2014
Revenue and Gross Margin of Opto Tech, 2004-2014
Monthly Revenue of Opto Tech, Apr. 2012-Apr. 2014
Revenue of Opto Tech by Product, 2008-2013
Revenue of Opto Tech Except System Products by Region, 2013-Q1/2014
Revenue from System Products of Opto Tech, 2013-Q1/2014
Revenue and Operating Margin of Harvatek, 2000-2014
Monthly Revenue of Harvatek, Apr. 2012-Apr. 2014
Revenue and Gross Margin Statistics and Forecast of Tekcore, 2005-2014
Monthly Revenue and Growth Rate of Tekcore, Apr. 2012-Apr. 2014
Revenue and Operating Margin of Unity Opto, 2004-2014
Monthly Revenue and Growth Rate of Unity Opto, Apr. 2012-Apr. 2014
Revenue and Operating Profit of Huga Optotech, 2004-2012
Monthly Revenue and Growth Rate of Huga Optotech, May 2010-May 2012
Revenue and Operating Margin of Lextar Electronics, 2009-2014
Monthly Revenue and Growth Rate of Lextar Electronics, Apr. 2012-Apr. 2014
Organizational Structure of Tyntek
Revenue and Operating Margin of Tyntek, 2004-2014
Monthly Revenue and Growth Rate of Tyntek, Apr. 2012-Apr. 2014
Revenue and Operating Margin of Edison Opto, 2006-2014
Monthly Revenue and Growth Rate of Edison Opto, Apr. 2012-Apr. 2014
Revenue and Net Income of Epiligh Technology, 2008-2012
Revenue and Operating Margin of Silan Microelectronics, 2006-2014
Revenue and Net Income of Silan Azure, 2007-2011
Revenue and Gross Margin of Sanan Optoelectronics, 2005-2010
Revenue of Sanan Optoelectronics by Business, 2009-2012
Revenue and Net Income of Sanan Optoelectronics’ Subsidiaries, 2013
Revenue and Operating Margin of Nationstar Optoelectronics, 2007-2014
Revenue of Nationstar Optoelectronics by Product, 2007-2013
Top 5 Customers of Nationstar Optoelectronics, 2013
Top 5 Suppliers of Nationstar Optoelectronics, 2013
Revenue and Operating Margin of AXT, 2004-2013
Revenue of AXT by Product, 2006-2013
Revenue of AXT by Region, 2006-2013
Revenue and Operating Profit of Xiamen Changelight, 2007-2014
Revenue from Epitaxy of Xiamen Changelight, 2010-2013
Financial Data of Xiamen Changelight’s Key Subsidiaries, 2013
Financial Data of Elec-tech International’s Key Subsidiaries, 2013
Revenue and Gross Margin of Neo-Neon Holdings, FY2006-FY2014
Revenue of Neo-Neon Holdings by Product, FY2009-FY2013
Revenue of Neo-Neon Holdings by Region, FY2012-FY2013
Revenue and Operating Profit of HC SemiTek, 2009-2014
Revenue and Operating Margin of Cree, FY2004-FY2014
Revenue of Cree by Product, FY2011-FY2014
Product Gross Margin of Cree, FY2011-FY2014
Global Distribution of Cree
Revenue of Cree by Region, FY2009-FY2013
Revenue and Operating Margin of Toyoda Gosei, FY2008-FY2015
Revenue from and Operating Margin of LED Business of Toyoda Gosei, FY2008-FY2015
Revenue and Operating Margin of Nichia, 2003-2014
Revenue and Operating Margin of Nichia’s LED Division, 2004-2013
Quarterly Revenue and EBITA Margin of OSRAM, Q1 2012- Q1 2014
Revenue of OSRAM by Division, 2012-2014
EBITA of OSRAM by Division, 2012-2014
Revenue of OSRAM by Region, 2012-2014
Revenue and EBITDA of Philips Lumileds Lighting, Q4 2011-Q4 2013
Revenue of Philips Lumileds Lighting by Business, 2013
Revenue of Philips Lumileds Lighting by Application, 2013
Revenue of Philips Lumileds Lighting by Region, 2013
Product Distribution of Seoul Semiconductor
Revenue and Operating Margin of Seoul Semiconductor, 2003-2014
Quarterly Gross Margin of Seoul Semiconductor, Q1 2011- Q1 2014
Quarterly Operating Margin of Seoul Semiconductor, Q1 2011- Q1 2014
Revenue of Seoul Semiconductor by Application, Q1 2011- Q1 2014
Revenue and Operating Margin of LG Innotek, 2006-2014
Revenue and Operating Margin of LG Innotek, Q1 2011- Q1 2014
Revenue of LG Innotek by Business, 2011-2014
Operating Profit of LG Innotek by Business, 2011-2013
Quarterly Revenue from LED Business of LG Innotek, Q4 2011- Q1 2014
Revenue of Samsung LED, 2005-2012
Revenue of Samsung LED by Application, 2010
Revenue and EBITDA Margin of Lumens Digital Optics, 2007-2014
Sales of Lumens Digital Optics by Application, 2012-2014