Global and China Superabsorbent Polymers (SAP) Industry Report, 2014-2018
-
July 2015
- Hard Copy
- USD
$2,200
-
- Pages:92
- Single User License
(PDF Unprintable)
- USD
$2,000
-
- Code:
CYH036
- Enterprise-wide License
(PDF Printable & Editable)
- USD
$3,200
-
- Hard Copy + Single User License
- USD
$2,400
-
Superabsorbent polymers (SAPs) (also called super absorbent) are a new high polymer material that has high absorption capacity and swelling capacity. A SAP may absorb hundreds of or even one thousand times its weight. It is mainly used in personal disposable hygiene products, such as baby diapers, adult incontinence products, and feminine hygiene products.
In 2014, the global SAP capacity came to 3.119 million tons, up 11.8% from a year earlier, which was mainly distributed in China, Japan, the United States, Germany, and other countries and regions. Over the same year, China overtook Japan as the world’s largest country in SAP capacity, accounting for 27.2% of the global total.
Propelled by the growth in global demand for hygiene products, the global SAP consumption totaled 2,130 kt in 2014, up 7.14% year on year. Among them, China consumed 315 kt, up 18.0% from the previous year, a rise that was far higher than the global average. In future, driven by the factors including the implementation of the "Selective Two-child” Policy and the increase of ageing population, China’s SAP consumption will further expand, with an estimated CAGR of some 20% during 2015-2018.
At present, the global SAP manufacturers represent a high concentration, with more than 80% of SAP capacity in the hands of top 6 enterprises—EVONIK Industries, Nippon Shokubai, BASF, Sumitomo Seika Chemicals, SDP Global, and Yixing Danson Technology. Moreover, all major enterprises are still stepping up layout, continuously expanding projects and increasing market share.
EVONIK Industries, the world's biggest SAP producer, achieved an annual capacity of 570 kt of SAP through the end of 2014. In 2014, the company’s third largest SAP plant—Saudi Arabia SAP Plant was put into operation, which would increase a further 80 kt/a SAP.
As the world's second largest SAP manufacturer, Nippon Shokubai began in October 2014 to expand its SAP capacity in Himeji plant to 370 kt/a; in May 2015, the company invested an extra EUR350 million in the expansion of acrylic acid and SAP capacity in Belgium, a move that helped increase an additional 100 kt/a SAP.
Sumitomo Seika Chemicals, one of the major SAP manufactures worldwide, has factories in Japan, France and Singapore. In August 2014, the company co-funded a 59 kt/a SAP plant in Yeosu. South Korea. The joint venture is to be put into operation in May 2016. In May 2015, Japans Himeji plant went into operation. By the end of 2016, the company’s total SAP capacity will be very likely to reach 385 kt/a.
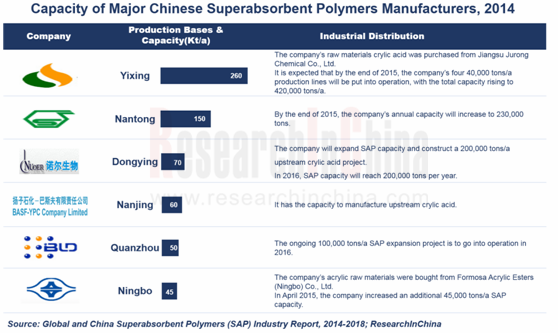
Yixing Denson Technology, the largest SAP producer in China, boasted a capacity of 260 kt/a SAP by the end of 2014. In 2015, the company has four 40 kt/a production lines under construction, which are to be put into operation at the year end. At that time, the company will have 11 SAP production lines, with a total capacity of 420 kt/a.
Global and China Superabsorbent Polymers (SAP) Industry Report, 2014-2018 mainly focuses on the following:
 Supply and demand, regional structure, and competitive landscape of the global SAP market;
Supply and demand, regional structure, and competitive landscape of China’s SAP market;
Supply and demand and development trend of acrylic acid in China;
Market size, SAP demand, and development trend of China’s major SAP downstream sectors including baby diapers, adult incontinence products , and feminine hygiene products;
Operation and development in China of 5 global SAP companies;
Operation and development strategy of 11 key Chinese SAP companies;
Prediction of development trend in global and China SAP market, 2015-2018.
1 Overview
1.1 Definition
1.2 Classification
1.3 Production Technology
1.4 Industry Chain
2 Development of Global Superabsorbent Polymers (SAP) Industry
2.1 Market Supply
2.2 Market Demand
2.3 Regional Structure
2.4 Competitive Landscape
3 Development of China’s SAP Industry
3.1 Market Supply
3.1.1 Capacity
3.1.2 Output
3.2 Market Demand
3.2.1 Consumption
3.2.2 Consumption Structure
3.3 Regional Structure
4 China’s Acrylic Acid Market
4.1 Market Supply
4.1.1 Capacity
4.1.2 Output
4.2 Market Demand
4.3 Import and Export
4.4 Price
5 Downstream Sectors of China’s SAP Industry
5.1 Disposable Baby Diapers
5.1.1 Market Size
5.1.2 Competitive Landscape
5.1.3 SAP Demand
5.1.4 Development Trend
5.2 Adult Incontinence Products
5.2.1 Market Size
5.2.2 SAP Demand
5.2.3 Development Trend
5.3 Feminine Hygiene Products
5.3.1 Market Size
5.3.2 SAP Demand
6 Major Global SAP Manufacturers
6.1 EVONIK
6.1.1 Profile
6.1.2 Operation
6.1.3 Revenue Structure
6.1.4 SAP Business
6.1.5 Development in China
6.2 Nippon Shokubai
6.2.1 Profile
6.2.2 Operation
6.2.3 Revenue Structure
6.2.4 SAP Business
6.2.5 Nisshoku Chemical Industry (Zhangjiagang) Co., Ltd.,
6.2.6 Development Strategy
6.3 BASF
6.3.1 Profile
6.3.2 Operation
6.3.3 Revenue Structure
6.3.4 R&D
6.3.5 SAP Business
6.3.6 Development in China
6.4 Sumitomo Seika Chemicals
6.4.1 Profile
6.4.2 Operation
6.4.3 Revenue Structure
6.4.4 SAP Business
6.4.5 Development in China
6.5 SDP Global
6.5.1 Profile
6.5.2 San-Dia Polymers (Nantong) Co.,Ltd.
7 Major Chinese SAP Manufacturers
7.1 Formosa Plastics Corporation
7.1.1 Profile
7.1.2 Operation
7.1.3 Revenue Structure
7.1.4 Gross Profit
7.1.5 R&D
7.1.6 SAP Business
7.1.7 Formosa Super Absorbent Polymer (Ningbo) Co., Ltd.
7.2 Zhejiang Satellite Petro-Chemical Co. Ltd.(002648)
7.2.1 Profile
7.2.2 Operation
7.2.3 Revenue Structure
7.2.4 Gross Margin
7.2.5 R&D and Ongoing Projects
7.2.6 SAP Business
7.2.7 Development Prospects
7.3 Yixing Danson Technology
7.3.1 Profile
7.3.2 Operation
7.3.3 Clients and Suppliers
7.3.4 Capacity
7.4 BASF-YPC Company Limited
7.4.1 Profile
7.4.2 Operation
7.4.3 SAP Business
7.5 Shandong Nuoer Bio-Tech Co.,Ltd.
7.5.1 Profile
7.5.2 Capacity
7.6 Quanzhou Banglida Technology Industry Co., Ltd.
7.7 Zhejiang Weilong Polymer Material Co.,Ltd.
7.8 Shanghai Huayi Acrylic Acid Co., Ltd.
7.8.1 Profile
7.8.2 Operation
7.8.3 Project Planning
7.9 Shandong Zhongke Boyuan New Material Technology Co., Ltd.
7.10 Tangshan Boya Resin Co., Ltd.
7.11 Jinan Haoyue Absorbent Materials Co., Ltd.
8 Conclusion and Prediction
8.1 Enterprise
8.2 Market Prediction
8.2.1 Global
8.2.2 China
Classification of Superabsorbent Polymers
Production Process of SAP (by Polymerization Method)
SAP’s Counter-phase Suspension Polymerization and Water Solution Polymerization
SAP Industry Chain
Global SAP Capacity and YoY Growth, 2008-2014
Global SAP Consumption and YoY Growth, 2009-2014
Global SAP Consumption Structure by Application, 2014
Global SAP Capacity by Region/Country, 2013-2015
Global SAP Capacity Structure by Region/Country, 2015
Capacity of Major Global SAP Enterprises, 2013-2015
Market Share of Major Global SAP Manufacturers by Capacity, 2014
Major Global SAP Projects under Construction, 2015
Capacity and YoY Growth of SAP in China, 2009-2014
Output and YoY Growth of SAP in China, 2009-2014
SAP Capacity Utilization in China, 2009-2014
SAP Consumption and YoY Growth of SAP in China, 2010-2014
SAP Consumption Structure in China by Product, 2014
SAP Capacity in China by Region, 2013-2015
Capacity and YoY Growth of Acrylic Acid in China, 2006-2015
Output of Acrylic Acid in China, 2008-2014
Apparent Consumption of Acrylic Acid in China, 2008-2014
Export Volume of Acrylic Acid in China, 2008-2014
Import Price of Acrylic Acid in China, 2008-2014
Export Price of Acrylic Acid in China, 2008-2014
Monthly Average Market Price of Acrylic Acid in China, 2010-2015
Revenue and YoY Growth of Baby Diapers in China, 2009-2015
Consumption of Baby Diapers in China by Product, 2009-2015
Output of Baby Diapers in China by Product, 2009-2015
Brands and Capacity of Major Chinese Baby Diapers Manufacturers, 2014
Output, Consumption, and Expenditure of Baby Diapers in China, 2013-2018E
SAP Demand and Market Size of Baby Diapers in China, 2012-2018E
Population and YoY Growth of Over-65s in China, 2008-2014
Market Size and YoY Growth of Adult Incontinence Products in China, 2009-2015
Output of Adult Incontinence Products in China by Product, 2009-2015
Consumption of Adult Incontinence Products in China by Product, 2009-2015
Output and Consumption of Adult Incontinence Products in China by Product, 2012-2018E
SAP Demand and Market Size of Adult Incontinence Products in China, 2012-2018E
Market Size and YoY Growth of Feminine Hygiene Products in China, 2009-2015
Output of Feminine Hygiene Products in China by Product, 2009-2015
Consumption of Feminine Hygiene Products in China by Product, 2009-2015
Output, Consumption, and Market Size of Feminine Hygiene Products in China by Product, 2012-2018E
SAP Demand and Market Size of Feminine Hygiene Products in China, 2012-2018E
EVONIK’s Business Segments
EVONIK’s Revenue and Net Income, 2010-2015
EVONIK’s Revenue by Business, 2010-2015
EVONIK’s Revenue Structure by Region, 2014
EVONIK’s SAP Capacity, 2013-2015
Nippon Shokubai’s Product Distribution by Segment
Nippon Shokubai’s Net Sales and Net Income, FY2009-FY2014
Nippon Shokubai’s Revenue by Segment, FY2009-FY2014
Nippon Shokubai’s Revenue Structure by Country/Region, FY2009-FY2014
Nippon Shokubai’s SAP and Acrylic Acid Capacity, 2012-2017E
SAP and Acrylic Acid Capacity and New Projects of Nippon Shokubai by Country, as of the End of April 2015
BASF’s Structure by Business
BASF’s Revenue and Net Income, 2008-2015
BASF’s Revenue by Business, 2012-2015
BASF’s Revenue Structure by Region, 2012-2015
BASF’s R&D Costs and % of Total Revenue, 2008-2014
BASF’s R&D Costs by Segment, 2014
BASF’s SAP and Acrylic Acid Capacity by Region, 2013-2014
BASF’s SAP Capacity, 2009-2015
Completion Time and Capacity of BASF’s SAP-related Acrylic Acid and Esters Project under Construction, 2015
BASF’s Major Enterprises in China and Their Geographical Distribution, 2015
BASF’s Revenue in China, 2007-2014
BASF’s Major Completed/Ongoing Projects in China, 2015
Revenue and Net Income of Sumitomo Seika Chemicals, FY2010-FY2014
Revenue Structure of Sumitomo Seika Chemicals by Business, FY2013-FY2014
SAP Revenue and Operating Income of Sumitomo Seika Chemicals, FY2011-FY2014
SAP Capacity of Sumitomo Seika Chemicals by Country, 2014-2016E
SAP Capacity of SDP Global by Country/Region as of the End of 2014
Capacity of Formosa Plastics Corporation by Product, 2009-2015
Revenue and Net Income of Formosa Plastics Corporation, 2009-2015
Revenue of Formosa Plastics Corporation by Business, 2013-2015
Revenue Structure of Formosa Plastics Corporation by Region, 2012-2014
Gross Profit and Gross Margin of Formosa Plastics Corporation, 2009-2015
R&D Costs and % of Total Revenue of Formosa Plastics Corporation, 2010-2015
SAP Revenue and YoY Growth of Formosa Plastics Corporation, 2010-2014
SAP Revenue of Formosa Plastics Corporation by Region, 2010-2014
SAP Capacity, Output, Sales Volume, Capacity Utilization, and Sales-output Ratio of Formosa Plastics Corporation, 2010-2014
SAP Capacity of Formosa Plastics Corporation by Region, 2010-2015
Revenue and Operating Income of Formosa Super Absorbent Polymer (Ningbo), 2012-2014
Capacity of Zhejiang Satellite Petro-Chemical by Product, 2008-2014
Revenue and Net Income of Zhejiang Satellite Petro-Chemical, 2009-2015
Operating Revenue of Zhejiang Satellite Petro-Chemical by Product, 2009-2014
Operating Revenue of Zhejiang Satellite Petro-Chemical by Region, 2008-2014
Gross Margin of Zhejiang Satellite Petro-Chemical by Product, 2008-2014
R&D Costs and % of Total Revenue of Zhejiang Satellite Petro-Chemical, 2008-2014
Major Proposed Projects of Zhejiang Satellite Petro-Chemical, 2015
SAP Capacity of Zhejiang Satellite Petro-Chemical, 2013-2015
Revenue and Net Income of Zhejiang Satellite Petro-Chemical, 2013-2018E
Revenue and Net Income of Yixing Danson Technology, 2012-2015
SAP Capacity of Yixing Danson Technology, 2010-2015
BASF-YPC’s Capacity by Product, 2015
BASF-YPC’s Revenue and Net Income, 2010-2014
SAP Capacity of Shandong Nuoer Bio-Tech, 2013-2016E
Revenue and Net Income of Shanghai Huayi Acrylic Acid, 2009-2014
SAP Capacity of Shandong Zhongke Boyuan New Material Technology, 2013-2015
SAP Capacity of Tangshan Boya Resin, 2013-2015
Revenue of Major Global and Chinese SAP Manufacturers, 2014-2015
Market Share of Major Chinese SAP Manufacturers, 2014
Global SAP Capacity and Demand, 2014-2018E
SAP Capacity, Output, and Demand in China, 2013-2018E
Global and China Optical Fiber Preform Industry Report, 2021-2026
Optical fiber preforms play a key role in the optical fiber communication industry chain. The global construction of 4G and FTTH requires less optical fiber and cable, which has dragged down the deman...
Global and China Photoresist Industry Report, 2021-2026
Since its invention in 1959, photoresist has been the most crucial process material for the semiconductor industry. Photoresist was improved as a key material used in the manufacturing process of prin...
Global and China Needle Coke Industry Report, 2021-2026
Needle coke is an important carbon material, featuring a low thermal expansion coefficient, a low electrical resistivity, and strong thermal shock resistance and oxidation resistance. It is suitable f...
Global and China 3D Glass Industry Report, 2021-2026
3D curved glass is light and thin, transparent and clean, anti-fingerprint, anti-glare, hard and scratch-resistant, and performs well in weather resistance. It is applicable to terminals such as high-...
Global and China Graphene Industry Report, 2020-2026
Graphene, a kind of 2D carbon nanomaterial, features excellent properties such as mechanical property and super electrical conductivity and thermal conductivity. Its downstream application ranges from...
Global and China Optical Fiber Preform Industry Report, 2020-2026
Optical fiber preform as a hi-tech product and a crucial link in the optical fiber industry chain contributes to 70% or so of profit margin. Global 4G and FTTH construction at dusk leads to the shrink...
Global and China 3D Glass Industry Report, 2020-2026
Global 3D glass market has been enlarging over the recent years amid demetallization of smartphone back covers and popularity of smart wearables, to approximately $2.86 billion in 2019 and to an estim...
Global and China Photoresist Industry Report, 2020-2026
In 2019, global photoresist market was valued at $8.3 billion, growing at a compound annual rate of 5.1% or so since 2010, and it will outnumber $12.7 billion in 2026 with advances in electronic techn...
Global and China Synthetic Diamond Industry Report, 2020-2026
While its mechanical property is given full play in fields like grinding and cutting, diamond with acoustic, optical, magnetic, thermal and other special properties, as superconducting material, intel...
Global and China Needle Coke Industry Report, 2020-2026
With the merits like small resistivity, excellent resistance to impact and good anti-oxidation property, needle coke has been widely used in ultra-high power graphite electrodes, nuclear reactor decel...
Global and China Optical Fiber Preform Industry Report, 2019-2025
Optical fiber preform, playing an important role in the optical fiber and cable industry chain, seizes about 70% profits of optical fiber. Global demand for optical fiber preform stood at 16.2kt in 20...
China Silicon Carbide Industry Report, 2019-2025
Silicon carbide (SiC) is the most mature and the most widely used among third-generation wide band gap semiconductor materials. Over the past two years, global SiC market capacity, however, hovered ar...
Global and China Photoresist Industry Report, 2019-2025
Photoresist, a sort of material indispensable to PCB, flat panel display, optoelectronic devices, among others, keeps expanding in market size amid the robust demand from downstream sectors. In 2018, ...
Global and China Graphene Industry Report, 2019-2025
Graphene is featured with excellent performance and enjoys a rosy prospect. The global graphene market was worth more than $100 million in 2018, with an anticipated CAGR of virtually 45% between 2019 ...
Global and China 3D Glass Industry Chain Report, 2019-2025
The evolution of AMOLED conduces to the steady development of 3D curved glass market. In 2018, the global 3D glass market expanded 37.7% on an annualized basis and reached $1.9 billion, a figure proje...
China Wood Flooring Industry Report, 2019-2025
With the better standard of living and the people’s desire for an elegant life, wood flooring sees a rising share in the flooring industry of China, up from 33.9% in 2009 to 38.9% in 2018, just behind...
Global and China Photovoltaic Glass Industry Report, 2019-2025
In China, PV installed capacity has ramped up since the issuance of photovoltaic (PV) subsidy policies, reaching 53GW in 2017, or over 50% of global total. However, the domestic PV demand was hit by t...
Global and China ITO Targets Industry Chain Report, 2019-2025
Featured by good electrical conductivity and transparency, ITO targets are widely applied to fields of LCD, flat-panel display, plasma display, touch screen, electronic paper, OLED, solar cell, antist...