Global and China 3D Printing Industry Report, 2015-2018
-
Aug.2015
- Hard Copy
- USD
$2,500
-
- Pages:95
- Single User License
(PDF Unprintable)
- USD
$2,300
-
- Code:
HK060
- Enterprise-wide License
(PDF Printable & Editable)
- USD
$3,500
-
- Hard Copy + Single User License
- USD
$2,700
-
3D printing (also called additive manufacturing) is a technology with which, based on digital model file, to fabricate objects by using binding materials like plastic or metal powder and through layer-by-layer printing. It is widely used in many fields such as manufacturing, medical treatment, education, archaeology, architecture, and military.
Since 2010, the global 3D printing market has been in a period of rapid development, with an AAGR of 30% or so. In 2014, the market size totaled USD4.1 billion. 3D printing mainly involves software, equipment, materials and service, of which 3D printing equipment accounted for about 46.5% in the industry in 2014.
3D printing equipment can be roughly divided into two categories, personal and industrial. The personal 3D printers, whose prices are relatively low, get chiefly used in personal DIY, education, among others. In 2014, the global sales volume amounted to approximately 100,000 units. By contrast, industrial 3D printers have wide applications and are principally marketed in the United States, Japan and Germany. Among them, the United States occupied a market share of around 40% in 2014.
?
Through acquisition, 3D Systems and Stratasys have become the world’s two 3D printing giants, whose businesses cover the whole 3D printing industry chain. In terms of sales value, the two companies swept a 34% market share in 2014. In 2014, Stratasys acquired Solid Concept, Harvest Technologies, GrabCAD, and Interfacial Solutions, while 3D Systems purchased Cimatron, Simbionix, LayerWise, Laser Reproductions, Robtec, etc.
At present, China's 3D printing market is still at its initial stage, with the industry chain to be improved. For example, some core components and 3D printing materials for China-made 3D printing equipment have to be imported from overseas. But 3D printing technologies in national defense and aviation industries have taken the lead in the world. In 2014, China’s 3D printing market size approximated 4.65 billion. It is projected that in the following years the market size will still grow at an average rate of around 40%, and that it will very likely exceed RMB20 billion by 2018.
In 2014, China's 3D printing market featured a rather low concentration degree, and the number of enterprises involved was close to 100, but mostly small-sized. The 3D printing equipment manufacturers consist mainly of Beijing Tiertime Technology Co., Ltd., Hunan Farsoon High-tech Co., Ltd., and Shining 3D.
In recent years, as the State introduced policies incentive to the development of 3D printing industry, more and more listed companies have entered the industry, a situation that helped integrate and develop China’s 3D printing industry. In 2014, there were more than 10 enterprises operating 3D printing business in China, mainly including Golden Laser, Sunshine Laser & Electronics, Guangdong Silver Age Sci & Tech, Yinbang Clad Material, and Jiangsu Asia-Pacific Light Alloy Technology, etc.
Global and China 3D Printing Industry Report, 2015-2018 compiled by ResearchInChina is primarily concerned with the following:
 Market size, competitive landscape and development prediction of global 3D printing industry;
Market size, competitive landscape and development prediction of China’s 3D printing industry;
Operation and 3D printing business of 26 global and Chinese 3D Printer manufacturers.
1 Overview of 3D Printing
1.1 Definition
1.2 Process
1.3 Technology
1.4 Application
1.5 Industry Chain
2 Global 3D Printing Market
2.1 Development History
2.2 Relevant Policies
2.3 Market Size
2.4 3D Printer
2.5 Competitive Landscape
2.6 Development Trend
3 China’s 3D Printing Market
3.1 Development History
3.2 Policies
3.3 Market Size
3.4 Competitive Landscape
4 Key Global Companies
4.1 Stratasys
4.1.1 Profile
4.1.2 Operation
4.1.3 Revenue Structure
4.1.4 Profit Structure
4.1.5 3D Printing Business
4.2 3D Systems
4.2.1 Profile
4.2.2 Operation
4.2.3 Revenue Structure
4.2.4 Profit Structure
4.2.5 3D Printing Business
4.3 Others
4.3.1 Cimatron
4.3.2 Autodesk
4.3.3 Materialise
4.3.4 Arcam
4.3.5 Envisiontec
5 Key Chinese Enterprises
5.1 Shining 3D
5.1.1 Profile
5.1.2 Operation
5.1.3 Revenue Structure
5.1.4 Gross Margin
5.1.5 Clients and Suppliers
5.1.6 3D Printing Business
5.1.7 Development and Forecast
5.2 Beijing Beike Guangda Information Technology Co., Ltd.
5.2.1 Profile
5.2.2 Operation
5.2.3 Revenue Structure
5.2.4 3D Printing Business
5.2.5 Development and Forecast
5.3 Zhengzhou LECAI Science and Technology Co., Ltd.
5.3.1 Profile
5.3.2 Operation
5.3.3 Revenue Structure
5.3.4 3D Printing Business
5.3.5 Development and Forecast
5.4 Suzhou TOPRUN Electrical Equipment Co. Ltd.
5.4.1 Profile
5.4.2 Operation
5.4.3 Revenue Structure
5.4.4 3D Printing Business
5.4.5 Development and Forecast
5.5 Shenzhen Sunshine Laser & Electronics Technology Co., Ltd.
5.5.1 Profile
5.5.2 Operation
5.5.3 Revenue Structure
5.5.4 Gross Margin
5.5.5 3D Printing Business
5.5.6 Development and Forecast
5.6 Golden Laser
5.6.1 Profile
5.6.2 Operation
5.6.3 Revenue Structure
5.6.4 Gross Margin
5.6.5 3D Printing Business
5.6.6 Development and Forecast
5.7 Yinbang Clad Material Co., Ltd.
5.7.1 Profile
5.7.2 Operation
5.7.3 3D Printing Business
5.8 Guangdong Silver Age Sci & Tech Co., Ltd.
5.8.1 Profile
5.8.2 Operation
5.8.3 3D Printing Business
5.9 Jiangsu Asia-Pacific Light Alloy Technology Co., Ltd.
5.9.1 Profile
5.9.2 Operation
5.9.3 3D Printing Business
5.10 SJEC Corporation
5.10.1 Profile
5.10.2 Operation
5.10.3 3D Printing Business
5.11 Fujian Haiyuan Automatic Equipments Co., Ltd.
5.11.1 Profile
5.11.2 Operation
5.11.3 3D Printing Business
5.12 SIASUN Robot & Automation Co., Ltd.
5.12.1 Profile
5.12.2 Operation
5.12.3 3D Printing Business
5.13 Nanfang Ventilator Co., Ltd
5.13.1 Profile
5.13.2 Operation
5.13.3 3D Printing Business
5.14 Zhejiang Yasha Decoration Co., Ltd.
5.14.1 Profile
5.14.2 Operation
5.14.3 3D Printing Business
5.15 Other Companies
5.15.1 Beijing Tiertime Technology Co., Ltd.
5.15.2 Hunan Farsoon High-tech Co., Ltd.
5.15.3 Shenzhen Aurora Technology Co., Ltd
5.15.4 Wuhan Binhu Mechanical & Electrical Co. Ltd.
5.15.5 Beijing Longyuan AFS
6 Conclusion and Anticipation
6.1 Conclusion
6.2 Development Prediction
6.2.1 Global
6.2.2 China
Procedure of 3D Printing Operation
Main 3D Printing Technologies, Materials, and Representative Companies
Comparison of 3D Printing Technology and Manufacturing Technology
Advantage and Disadvantage of 3D Printing Technology
3D Printing Applications
3D Printing Industry Chain
Development History of 3D Printing
Global 3D Printing Application Cases
Polices on 3D Printing in Major Countries
Market Size and Growth Rate of Global 3D Printing, 2005-2014
Proportion of Different Links of Global 3D Printing Industry by Market Size, 2014
Global Sales Volume of Personal 3D Printers, 2009-2014
Distribution of 3D Printers Worldwide by Application, 2014
Global Distribution of Industrial 3D Printers by Sales Value, 2014
Global Distribution of Industrial 3D Printers by Output Value, 2014
Main Business Models of Global 3D Printing
Major Global 3D Printing Enterprises by Category
Development Trend of Global 3D Printing Industry
Major Chinese 3D Printing Enterprises and Their R&D Teams
Development History of 3D Printing Industry in China
Market Size and Growth Rate of 3D Printing in China, 2012-2014
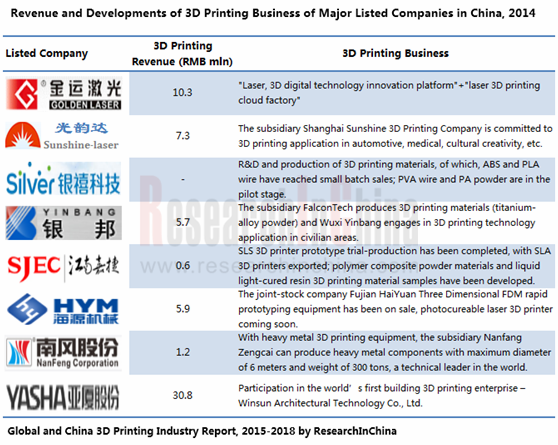
Listed 3D Printing Companies in China and Related Business, 2014
3D Printing Enterprises Listed in China’s New OTC Market and Related Business, 2014
3D Printing Equipment Manufacturers in China, 2014
Stratasys’ Net Revenue and Net Income, 2010-2014
Stratasys’ Revenue by Product, 2012-2014
Revenue Structure of Stratasys by Product, 2012-2014
Revenue of Stratasys by Region, 2012-2014
Revenue Structure of Stratasys by Region, 2012-2014
Stratasys’ Gross Profit by Product, 2012-2014
Gross Profit Proportion of Stratasys by Product, 2012-2014
Stratasys’ Gross Margin by Product, 2012-2014
Development History of Stratasys’ 3D Printing Business
Stratasys’ 3D Printer Series
Stratasys’ Global Arms
3D Systems’ Net Revenue and Net Income, 2010-2014
Revenue of 3D Systems by Product, 2012-2014
Revenue Structure of 3D Systems by Product, 2012-2014
Revenue of 3D Systems by Region, 2012-2014
Revenue Structure of 3D Systems by Region, 2012-2014
3D Systems’ Gross Profit by Product, 2012-2014
Gross Profit Proportion of 3D Systems by Product, 2012-2014
Development History of Stratasys’ 3D Printing Business
3D Systems’ Product Series
3D Systems’ Global Arms
Revenue and Net Income of Shining 3D, 2012-2014
Revenue of Shining 3D by Product, 2012-2014
Revenue Structure of Shining 3D by Product, 2012-2014
Revenue of Shining 3D by Region, 2012-2013
Revenue Structure of Shining 3D by Region, 2012-2013
Shining 3D’s Gross Margin for Main Products, 2012-2013
Name List and Revenue Contribution of Shining 3D’s Top 5 Clients,2013
Shining 3D’s Main Raw Materials and Suppliers
Name List and Procurement of Shining 3D’s Top 5 Suppliers, 2013
Shining 3D’s 3D Printing-related Business
Development History of Shining 3D’s 3D Printing Business
Revenue of Shining 3D by Application, 2012-2013
Revenue Structure of Shining 3D by Application, 2012-2013
Shining 3D’s 3D Printing Partners
Revenue and Net Income of Shining 3D, 2014-2018E
Revenue and Net Income of Beike Guangda, 2012-2014
Revenue of Beike Guangda by Product, 2012-2014
Revenue Structure of Beike Guangda by Product, 2012-2014
Beike Guangda’s 3D Printing Business Development Trends
Revenue and Net Income of Beike Guangda, 2014-2018E
Revenue and Net Income of LECAI, 2012-2014
Revenue of LECAI by Product, 2012-2014
Revenue Structure of LECAI by Product, 2012-2014
Revenue and Net Income of LECAI, 2014-2018E
Revenue and Net Income of Suzhou TOPRUN Electrical Equipment, 2012-2014
Revenue of Suzhou TOPRUN Electrical Equipment by Product, 2012-2014
Revenue Structure of Suzhou TOPRUN Electrical Equipment by Product, 2012-2014
Revenue and Net Income of Suzhou TOPRUN Electrical Equipment, 2014-2018E
Revenue and Net Income of Sunshine Laser & Electronics, 2010-2014
Revenue Structure of Sunshine Laser & Electronics by Product, 2014
Revenue of Sunshine Laser & Electronics by Region, 2013-2014
Revenue Structure of Sunshine Laser & Electronics by Region, 2013-2014
Sunshine Laser & Electronics’ Gross Margin for Main Products, 2014
Revenue and Net Income of Sunshine Laser & Electronics, 2014-2018E
Revenue and Net Income of Golden Laser, 2010-2014
Revenue of Golden Laser by Product, 2012-2014
Revenue Structure of Golden Laser by Product, 2012-2014
Revenue of Golden Laser by Region, 2012-2014
Revenue Structure of Golden Laser by Region, 2012-2014
Golden Laser’s Gross Margin for Main Products, 2012-2014
Development of Golden Laser’s 3D Printing Business, 2014-2015
Operation of Wuhan Loodii Creative Culture Communication, 2014
Revenue and Net Income of Golden Laser’s 3D Printing Subsidiaries, 2014
Revenue and Net Income of Golden Laser, 2014-2018E
Revenue and Net Income of Yinbang Clad Material, 2010-2014
Revenue and Net Income of FalconTech, 2013-2014
Revenue and Net Income of Wuxi Yinbang Precision Manufacturing, 2013-2014
Revenue and Net Income of Silver Age Sci & Tech, 2010-2014
Revenue and Net Income of Jiangsu Asia-Pacific Light Alloy Technology, 2010-2014
Revenue and Net Income of SJEC Corporation, 2010-2014
Revenue and Net Income of Fujian Haiyuan Automatic Equipments, 2010-2014
Revenue and Net Income of Haiyuan Three Dimensional, 2013-2014
Revenue and Net Income of SIASUN Robot & Automation, 2010-2014
Revenue and Net Income of Nanfang Ventilator, 2010-2014
Revenue and Net Income of Yasha Decoration, 2010-2014
Development of Yingchuang’s 3D Printing Business,
Revenue and Net Income of Yingchuang, 2013-2014
Revenue of Major Global and Chinese 3D Printing Enterprises, 2014
Market Size of 3D Printing Industry Worldwide, 2014-2018E
Sales Volume of Personal 3D Printers Worldwide, 2014-2018E
Market Size of 3D Printing Industry in China, 2014-2018E
Global and China CNC Machine Tool Industry Report, 2022-2027
As typical mechatronics products, CNC machine tools are a combination of mechanical technology and CNC intelligence. The upstream mainly involves castings, sheet metal parts, precision parts, function...
Global and China Hydraulic Industry Report, 2021-2026
Hydraulic components are key parts for mobile machineries including construction machinery, agricultural and forestry machinery, material handling equipment and commercial vehicle. The global construc...
China Motion Controller Industry Report, 2021-2026
The motion control system is the core component of intelligent manufacturing equipment, usually composed of controllers, motors, drivers, and human-computer interaction interfaces. Through the control...
Global and China Industrial Robot Servo Motor Industry Report, 2021-2026
As the actuator of control system, servo motor is one of the three crucial parts to industrial robot and its development is bound up with industrial robots. Given the slow progress of 3C electronics a...
Global and China Industrial Laser Industry Report, 2020-2026
As one of the most advanced manufacturing and processing technologies in the world, laser technology has been widely used in industrial production, communications, information processing, medical beau...
Global and China Mining-use Autonomous Driving Industry Report, 2020-2021
Demand and policies speed up landing of Autonomous Driving in Mining
Traditional mines have problems in recruitment, efficiency, costs, and potential safety hazards, while which can be solved by aut...
Autonomous Agricultural Machinery Research Report, 2020
Autonomous Agricultural Machinery Research: 17,000 sets of autonomous agricultural machinery systems were sold in 2020, a year-on-year increase of 188%
Autonomous agricultural machinery relies heavil...
Global and China CNC Machine Tool Industry Report, 2020-2026
As a typical type of mechatronic products, CNC machine tools combine mechanical technology with CNC intelligence. The upstream mainly involves castings, sheet weldments, precision parts, functional pa...
Global and China Hydraulic Industry Report, 2020-2026
Hydraulic parts, essential to modern equipment manufacturing, are mostly used in mobile machinery, industrial machinery and large-sized equipment. Especially, construction machinery consumes the overw...
Global and China Industrial Robot Speed Reducer Industry Report, 2020-2026
Controller, servo motor and speed reducer, three core components of industrial robot, technologically determine key properties of an industrial robot, such as work accuracy, load, service life, stabil...
Global and China Industrial Robot Servo Motor Industry Report, 2020-2026
As the actuator of control system, servo motor is one of the three crucial parts to industrial robot and its development is bound up with industrial robots. Given the agonizingly slow progress of 3C e...
Global and China Laser Processing Equipment Industry Report, 2020-2026
Laser processing which offers centralized and stable laser beams is applicable to high hardness, high melting point materials that are hard to be processed with traditional technologies. By purpose, l...
Global and China Forklift Industry Report, 2020-2026
In 2019, a total of 1,493,271 forklifts were sold worldwide, up 0.25% year on year, including 647,229 ones or 43.3% sold in Asia.
As the largest producer and seller of forklifts around the globe, Chi...
Global and China Injection Molding Machine Industry Report, 2020-2026
Injection molding machine plays a crucial role in plastics processing machinery, constituting 40% to 50% of the total output value of plastics processing machinery in China. In 2019, injection molding...
China Motion Controller Industry Report, 2019-2026
The motion control market is growing alongside machine tools, robotics, packaging machinery, semiconductors, electronics, among others, being vulnerable to fluctuations in downstream market. In 2018, ...
China Smart Meter Industry Report, 2020-2026
In 2019, instrument and meter companies (each with annual revenue over RMB20 million) in China collectively registered RMB724.26 billion in revenue and RMB70.04 billion in net income, up by 5.5% and 5...
Global and China Agricultural Machinery Industry Report, 2020-2026
Affected by insufficient demand for traditional products, adjustment of purchase subsidy policies, and lower prices of grain crops, China’s agricultural machinery sales remain a downward trend.
In 20...
Global and China Elevator Industry Report, 2019-2025
About 800,000 elevators were sold across the world in 2018, up 1% from a year ago thanks to the robust demand from China, India and the United States, and the ownership of elevators rose to virtually ...