Global and China Bearing Industry Report, 2015-2018
-
Sep.2015
- Hard Copy
- USD
$2,750
-
- Pages:136
- Single User License
(PDF Unprintable)
- USD
$2,550
-
- Code:
ZHP028
- Enterprise-wide License
(PDF Printable & Editable)
- USD
$3,900
-
- Hard Copy + Single User License
- USD
$2,950
-
Bearing, a critical component for contemporary mechanical equipment, finds wide applications in automobile, electromechanics, construction machinery, household appliances, metallurgy and mining machinery, etc.
In 2014, global bearing market size reached USD68 billion, with Asia accounting for 45%, Europe 28% and the Americas 25%. In particular, the Asian bearing market is mainly concentrated in Japan, India and China.
As one of major bearing producers in the world, China produced 20.2 billion sets of bearings in 2014, rising by 3.1% from a year earlier, of which rolling bearing held the lion’s share (92.6%). China’s bearing output is expected to arrive at 21.5 billion sets in 2015.
Currently, automobile is the largest application market for bearing in China. The country’s demand for automotive bearing was 1.2 billion sets in 2014, and is expected to grow to 1.3 billion sets in 2015. Besides the demand from automobile, accelerated railway construction in China also stimulates the demand for railway bearing, which approximated 5.61 million sets in 2014 and is predicted to reach 5.87 million sets in 2015.
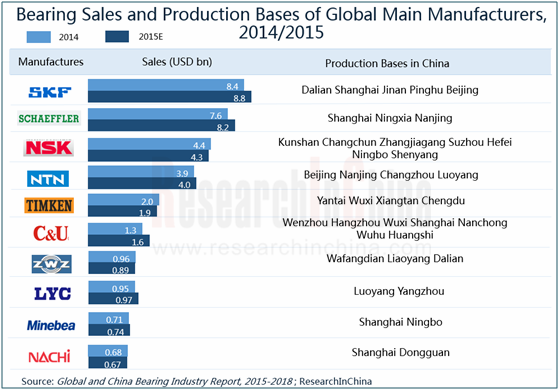
In 2014, global top10 manufacturers included two European companies (Swedish SKF, German Schaeffler), one American firm (TIMKEN), four Japanese players (NSK, NTN, Minebea, Nachi), and three Chinese ones (C&U Group, Wafangdian Bearing Group, Luoyang LYC Bearing). Major foreign bearing producers including SKF, NSK, and NTN now have entered China.
SKF: The company is the world's largest bearing manufacturer; it seized a 12.4% global market share in 2014; it has five bearing production bases in China (separately located in Shanghai, Beijing, Dalian, Jinan, and Pinghu). The company signed S2M magnetic bearings supply contract with Shenyang Blower Works Group (SBW) in Dec 2014, and won SEK150 million worth of bearing supply order from Chongqing Gearbox Co., Ltd. in Jan 2015, thus boosting its share in the Chinese wind power gearbox market.
Schaeffler: The company made revenue of EUR1.54 billion, or 12.7% of total revenue, from the Greater China region in 2014. The truck hub bearing production lines in Nanjing production base are under construction as planned in 2015, and is expected to go into production at the end of the year, delivering a capacity of 500,000 sets/a.
C&U Group: The company, with capacity of 810 million sets/a, surpassed Wafangdian Bearing Group for the first time as China’s the largest bearing manufacturer in terms of market share in 2014. “60 million sets/a high-efficiency and precision industrial bearing project” with an investment of RMB500 million in Wuhu production base officially went into operation in December 2014.
Wafangdian Bearing Group: The company is a major wind power bearing manufacturer, and has been intensifying its efforts in R&D of high-end wind power bearing in recent years. FL-249/750CA/W33 wind power spindle bearing developed by the company got GL-A certificate (the first in China) in Jun 2015, thus wining the access to the EU market.
Luoyang Bearing Science & Technology: The company invested RMB160 million to construct “high-speed precision heavy-duty bearing industrialization demonstration line project” in May 2014. Products are mainly high-speed railway bearings, urban rail vehicle bearings, and locomotive and transmission bearings. The project was completed and went into production in Jun 2015, adding capacity of 60,000 sets/a tapered roller bearings.
Global and China Bearing Industry Report, 2015-2018 by ResearchInChina highlights the followings:
 Global bearing market size, structure, competitive landscape, etc;
Development environments for bearing industry in China;
Bearing production, sales, market structure, competitive landscape, import & export, etc. in China;
Demand from main downstream sectors of bearing, competitive landscape, etc.;
Operation, development strategy, R&D capacity, etc. of 8 global and 10 Chinese bearing manufacturers.
1 Introduction to Bearing
1.1 Definition
1.2 Classification
1.3 Industry Characteristics
1.3.1 Periodicity
1.3.2 Regionality
1.4 Existing Problems
1.5 Industry Chain
2 Development of Global Bearing Industry
2.1 Market Size
2.2 Market Structure
2.3 Competitive Landscape
3 Bearing Industry in China
3.1 Policy Environment
3.1.1 Supportive Policies for Key Products
3.1.2 Trade Policy
3.1.3 Foreign Access Policies
3.2 Status Quo
3.3 Market Size
3.4 Import & Export
3.4.1 Import
3.4.2 Export
3.5 Competitive Landscape
3.5.1 Industry Concentration
3.5.2 Enterprise Pattern
3.5.3 Regional Structure
4 Bearing Market Segments
4.1 Automotive Bearing
4.1.1 Overview
4.1.2 Market Demand
4.1.3 Competition among Enterprises
4.1.4 Developments
4.2 Railway Bearing
4.2.1 Overview
4.2.2 Market Demand
4.2.3 Competition among Enterprises
4.2.4 Developments
4.3 Wind Power Bearing
4.3.1 Overview
4.3.2 Market Demand
4.3.3 Competition among Enterprises
4.3.4 Developments
4.4 Construction Machinery Bearing
4.4.1 Overview
4.4.2 Market Demand
4.4.3 Developments
4.5 Metallurgical and Mining Machinery Bearing
4.5.1 Overview
4.5.2 Market Demand
4.5.3 Competition among Enterprises
4.6 Other Bearing Markets
4.6.1 Petrochemical Bearing
4.6.2 Machine Tool Bearing
4.6.3 Home Appliance Bearing
5 Major Foreign Bearing Manufacturers
5.1 SKF
5.1.1 Profile
5.1.2 Operation
5.1.3 Revenue Structure
5.1.4 Bearing Business
5.1.5 Development in China
5.2 NSK
5.2.1 Profile
5.2.2 Operation
5.2.3 Revenue Structure
5.2.4 Bearing Business
5.2.5 Marketing Network
5.2.6 Development in China
5.3 NTN
5.3.1 Profile
5.3.2 Operation
5.3.3 Revenue Structure
5.3.4 Bearing Business
5.3.5 Development in China
5.4 Minebea
5.4.1 Profile
5.4.2 Operation
5.4.3 Revenue Structure
5.4.4 Bearing Business
5.4.5 Development in China
5.5 TIMKEN
5.5.1 Profile
5.5.2 Operation
5.5.3 Revenue Structure
5.5.4 Bearing Business
5.5.5 Development in China
5.6 Schaeffler
5.6.1 Profile
5.6.2 Operation
5.6.3 Revenue Structure
5.6.4 Bearing Business
5.6.5 Development in China
5.7 Nachi
5.7.1 Profile
5.7.2 Operation
5.7.3 Revenue Structure
5.7.4 Bearing Business
5.7.5 Development in China
5.8 Jtekt
5.8.1 Profile
5.8.2 Operation
5.8.3 Revenue Structure
5.8.4 Bearing Business
5.8.5 Development in China
6 Major Chinese Bearing Manufacturers
6.1 Wafangdian Bearing Group Corp
6.1.1 Profile
6.1.2 Operation
6.1.3 Revenue Structure
6.1.4 Product R&D
6.1.5 Marketing Network
6.1.6 Major Subsidiary- Wafangdian Bearing Co., Ltd.
6.1.7 Development Strategy
6.2 Luoyang LYC Bearing Co., Ltd
6.2.1 Profile
6.2.2 Operation
6.2.3 Marketing Network
6.2.4 Developments
6.3 Harbin Bearing Manufacturing Co., Ltd
6.3.1 Profile
6.3.2 Operation
6.3.3 Development Strategy
6.4 Tianma Bearing Group Co., Ltd
6.4.1 Profile
6.4.2 Operation
6.4.3 Revenue Structure
6.4.4 Gross Margin
6.4.5 Bearing Business
6.4.6 Competitive Edge
6.5 Xiangyang Automobile Bearing Co., Ltd
6.5.1 Profile
6.5.2 Major Customers and Suppliers
6.5.3 Operation
6.5.4 Revenue Structure
6.5.5 Gross Margin
6.5.6 Bearing Business
6.5.7 Marketing Network
6.6 Fujian Longxi Bearing (Group) Corp., Ltd
6.6.1 Profile
6.6.2 Operation
6.6.3 Revenue Structure
6.6.4 Gross Margin
6.6.5 Bearing Business
6.6.6 Competitive Edge
6.6.7 Developments
6.7 Luoyang Bearing Science & Technology Co., Ltd.
6.7.1 Profile
6.7.2 Operation
6.7.3 Revenue Structure
6.7.4 Gross Margin
6.7.5 Bearing Business
6.7.6 Competitive Edge
6.7.7 Developments
6.8 Baota Industry Co., Ltd.
6.8.1 Profile
6.8.2 Major Customers and Suppliers
6.8.3 Operation
6.8.4 Revenue Structure
6.8.5 Gross Margin
6.8.6 Bearing Business
6.8.7 R&D
6.8.8 Developments
6.9 C&U Group
6.9.1 Profile
6.9.2 Operation
6.9.3 Bearing Business
6.9.4 Developments
6.10 Wanxiang Qianchao Co., Ltd.
6.10.1 Profile
6.10.2 Major Customers and Suppliers
6.10.3 Operation
6.10.4 Revenue Structure
6.10.5 Gross Margin
6.10.6 Bearing Business
6.10.7 Development Strategy
7 Summary and Forecast
7.1 Market
7.2 Enterprise
Classification of Bearings
Schematic Diagram of Bearing
Global Bearing Sales, 2008-2018E
Global Bearing Sales Structure by Region, 2014
Global Top10 Bearing Manufacturers, (FY) 2014
Key Bearings during the Twelfth Five-Year Plan Period (2011-2015) in China
China’s Preferential Tax Rates on Some Imported Bearings
Number of Bearing Manufacturers in China, 2005-2015
Type of Bearing Manufacturers in China, 2014
Operating Revenue and Total Profit of Bearing Industry in China, 2011-2018E
Prosperity Index of Bearing Industry in China, 2012-2015
China’s Bearing Output, 2007-2018E
China’s Rolling Bearing Output and Growth Rate, 2007-2018
China’s Apparent Consumption of Bearing, 2007-2018E
China’s Bearing Import Volume and Value, 2011-2015
China’s Bearing Import Volume Structure by Country/Region, 2014
China’s Bearing Import Value Structure by Country/Region, 2014
China’s Bearing Export Volume and Value, 2008-2015
China’s Bearing Export Volume Structure by Country/Region, 2014
China’s Bearing Export Value Structure by Country/Region, 2014
Comparison of Bearing Industry Concentration in China, Germany, United States, and Japan, 2014
Top5 Domestic Companies by Bearing Revenue in China, 2014
China’s Bearing Output Structure by Province/Municipality, 2014-2015
Bearing Structure of Sedan (by Type)
China’s Auto Output and Sales Volume, 2008-2018E
China’s Demand for Automotive Bearing, 2013-2018E
Major Automotive Bearing Manufacturers Worldwide
Railway Mileage and Investment of China, 2011-2015
China’s Demand for Railway Bearing, 2013-2018E
China's Installed Wind Capacity, 2008-2018E
China’s Demand for Wind Power Bearing, 2009-2018E
Major Wind Power Bearing Manufacturers in China
Construction Machinery Sales Volume and Demand for Corresponding Bearing, 2006-2015
China’s Demand for Metallurgical and Mining Equipment Bearing, 2014
Number of Employees of SKF, 2009-2014
Net Sales and Net Income of SKF, 2009-2015
Revenue Structure of SKF by Business, 2012-2015
Revenue Structure of SKF by Region, 2013-2014
Applications and Share of SKF’s Bearings, 2013-2014
SKF’s Revenue from Bearing Business, 2003&2008&2014
Bearing Business Development of SKF in China, 2001-2014
Number of Employees of NSK, FY2009-FY2014
Net Sales and Net Income of NSK, FY2008-FY2014E
Revenue Structure of NSK by Business, FY2011-FY2014
Revenue Structure of NSK by Region, FY2008-FY2014
NSK’s Revenue from Bearing Business, FY2010-FY2014
Bearing Sales Structure of NSK by Business, FY2010-FY2014
Industrial Machinery Bearing Sales Structure of NSK, FY2014
Global Marketing Network of NSK, 2014
Bearing Production Bases of NSK in China
Revenue of NSK in China and Growth Rate, FY2006-FY2015
Revenue Structure of NSK in China by Business, FY2014
Number of Employees of NTN, FY2009-FY2015
Net Sales and Net Income of NTN, FY2009-FY2015
Revenue Structure of NTN by Business, FY2012-FY2015
Revenue Structure of NTN by Region, FY2009-FY2015
NTN’s Bearings and Their Applications
NTN’s Revenue from Bearing Business, FY2008-FY2015
Development History of NTN in China
NTN’s Main Production Bases and Sales Outlets in China, 2015
Number of Employees of Minebea, FY2009-FY2015
Net Sales and Net Income of Minebea, FY2009-FY2015
Revenue Structure of Minebea by Business, FY2013-FY2015
Revenue Structure of Minebea by Region, FY2012-FY2015
Main Bearings and Global Market Share of Minebea, 2014
Minebea’s Revenue from Bearing Business, FY2011-FY2016
Minebea’s Production Bases in China, 2015
Minebea’s Revenue in China and Growth Rate, FY2011-FY2015
Number of Employees of TIMKEN, 2009-2014
Net Sales and Net Income of TIMKEN, 2009-2015
Revenue Structure of TIMKEN by Business, 2012-2015
Revenue Structure of TIMKEN by Region, 2009-2014
Main Bearings of TIMKEN
TIMKEN’s Revenue from Bearing Business, 2003&2008&2014
TIMKEN’s Layout in China
TIMKEN’s Factories in China and Core Products
Development of TIMKEN in China, 2009-2015
Number of Employees of Schaeffler, 2009-2015
Net Sales and Net Income of Schaeffler, 2009-2015
Revenue Structure of Schaeffler by Business, 2011-2015
Revenue Structure of Schaeffler by Region, 2009-2015
Main Bearings of Schaeffler
Schaeffler’s Revenue from Bearing Business, 2003&2008&2014
Development History of Schaeffler in China
Number of Employees of Nachi, FY2009-FY2014
Overseas Production Bases of NACHI
Net Sales and Net Income of NACHI, FY2006-FY2015
Revenue Structure of NACHI by Product, FY2013-FY2015
Revenue Structure of NACHI by Region, FY2009-FY2015
NACHI’s Revenue from Bearing Business and Growth Rate, FY2006-FY2015
Development History of NACHI in China
Number of Employees of Jtekt, FY2009-FY2014
Net Sales and Net Income of Jtekt, FY2009-FY2014
Revenue Structure of Jtekt by Product, FY2013-FY2014
Revenue Structure of Jtekt by Region, FY2009-FY2014
Jtekt’s Revenue from Bearing Business, FY2010-FY2014
Jtekt’s Bearing Production Bases in China
Operating Revenue and Total Profit of Wafangdian Bearing Group, 2004-2015
Bearing Revenue Structure of Wafangdian Bearing Group by Product, 2013-2015
Global Marketing Network of Wafangdian Bearing Group
Revenue and Net Income of Wafangdian Bearing, 2009-2015
Revenue from and Gross Margin of Bearing Business of Wafangdian Bearing, 2010-2015
Bearing Output and Sales Volume of Wafangdian Bearing, 2012-2014
Operating Revenue and Total Profit of Luoyang LYC Bearing, 2005-2015
Competitive Product Group of Luoyang LYC Bearing
Operating Revenue and Total Profit of Harbin Bearing Manufacturing, 2004-2015
Equity Structure of Tianma Bearing Group, 2015
Number of Employees of Tianma Bearing Group, 2009-2014
Revenue and Net Income of Tianma Bearing Group, 2007-2015
Revenue Structure of Tianma Bearing Group by Product, 2012-2015
Revenue Structure of Tianma Bearing Group by Region, 2012-2014
Gross Margin of Tianma Bearing Group by Product, 2010-2015
Bearing Revenue and Growth Rate of Tianma Bearing Group, 2007-2015
Revenue of Tianma Bearing Group’s Major Bearing Subsidiaries, 2014
Equity Structure of Xiangyang Automobile Bearing, 2015
Number of Employees of Xiangyang Automobile Bearing, 2008-2014
Xiangyang Automobile Bearing’s Revenue from Major Customers and % of Total Amount, 2013-2014
Xiangyang Automobile Bearing’s Procurement from Major Suppliers and % of Total Amount, 2013-2014
Revenue and Net Income of Xiangyang Automobile Bearing, 2007-2015
Output and Sales Volume of Xiangyang Automobile Bearing’s Major Products, 2011-2014
Revenue Structure of Xiangyang Automobile Bearing by Product, 2012-2015
Revenue Structure of Xiangyang Automobile Bearing by Region, 2012-2015
Gross Margin of Xiangyang Automobile Bearing by Product, 2008-2015
Xiangyang Automobile Bearing’s Revenue from Bearing Business and Growth Rate, 2008-2015
Global Marketing Network of Xiangyang Automobile Bearing
Equity Structure of Fujian Longxi Bearing (Group), 2015
Number of Employees of Fujian Longxi Bearing (Group), 2009-2014
Revenue and Net Income of Fujian Longxi Bearing (Group), 2006-2015
Revenue Structure of Fujian Longxi Bearing (Group) by Product, 2012-2015
Revenue Structure of Fujian Longxi Bearing (Group) by Region, 2009-2015
Gross Margin of Fujian Longxi Bearing (Group) by Product, 2009-2015
Fujian Longxi Bearing (Group)’s Revenue from Bearing Business and Growth Rate, 2009-2015
Revenue of Fujian Longxi Bearing (Group)’s Major Bearing Subsidiaries, 2014
Investment in Projects under Construction of Fujian Longxi Bearing (Group), 2015
Equity Structure of Luoyang Bearing Science & Technology, 2015
Number of Employees of Luoyang Bearing Science & Technology, 2009-2014
Revenue and Net Income of Luoyang Bearing Science & Technology, 2007-2015
Revenue Structure of Luoyang Bearing Science & Technology by Product, 2012-2015
Revenue Structure of Luoyang Bearing Science & Technology by Region, 2009-2015
Gross Margin of Luoyang Bearing Science & Technology by Product, 2009-2015
Luoyang Bearing Science & Technology’s Revenue from Bearing Business and Growth Rate, 2007-2015
Bearing Output and Sales Volume of Luoyang Bearing Science & Technology, 2012-2014
Revenue of Luoyang Bearing Science & Technology’s Major Bearing Subsidiaries, 2014
Investment in Projects under Construction of Luoyang Bearing Science & Technology, 2015
Equity Structure of Baota Industry, 2015
Number of Employees of Baota Industry, 2009-2014
Baota Industry’s Revenue from Major Customers and % of Total Amount, 2013-2014
Baota Industry’s Procurement from Major Suppliers and % of Total Amount, 2013-2014
Revenue and Net Income of Baota Industry, 2007-2014
Revenue Structure of Baota Industry by Product, 2012-2015
Revenue Structure of Baota Industry by Region, 2009-2015
Gross Margin of Baota Industry by Product, 2009-2015
Baota Industry’s Revenue from Bearing Business, 2009-2015
Main R&D Projects of Baota Industry, 2014
Revenue and Growth Rate of C&U Group, 2009-2015
Bearing Production Bases of C&U Group
C&U Group’s Revenue from Bearing Business and Growth Rate, 2009-2015
Equity Structure of Wanxiang Qianchao, 2015
Number of Employees of Wanxiang Qianchao, 2008-2014
Wanxiang Qianchao’s Revenue from Major Customers and % of Total Amount, 2013-2014
Wanxiang Qianchao’s Procurement from Major Suppliers and % of Total Amount, 2013-2014
Revenue and Net Income of Wanxiang Qianchao, 2007-2015
Revenue Structure of Wanxiang Qianchao by Product, 2013-2015
Revenue Structure of Wanxiang Qianchao by Region, 2012-2015
Gross Margin of Wanxiang Qianchao by Product, 2008-2015
Bearing Output and Sales Volume of Wanxiang Qianchao, 2011-2014
Revenue of Wanxiang Qianchao’s Major Bearing Subsidiaries, 2014
Growth Rate of Global and China Bearing Industry, 2009-2018E
China’s Bearing Import & Export, 2011-2015
Competitive Landscape of Global Bearing Industry, 2014
Competitive Landscape of Bearing Industry in China, 2014
Global and China CNC Machine Tool Industry Report, 2022-2027
As typical mechatronics products, CNC machine tools are a combination of mechanical technology and CNC intelligence. The upstream mainly involves castings, sheet metal parts, precision parts, function...
Global and China Hydraulic Industry Report, 2021-2026
Hydraulic components are key parts for mobile machineries including construction machinery, agricultural and forestry machinery, material handling equipment and commercial vehicle. The global construc...
China Motion Controller Industry Report, 2021-2026
The motion control system is the core component of intelligent manufacturing equipment, usually composed of controllers, motors, drivers, and human-computer interaction interfaces. Through the control...
Global and China Industrial Robot Servo Motor Industry Report, 2021-2026
As the actuator of control system, servo motor is one of the three crucial parts to industrial robot and its development is bound up with industrial robots. Given the slow progress of 3C electronics a...
Global and China Industrial Laser Industry Report, 2020-2026
As one of the most advanced manufacturing and processing technologies in the world, laser technology has been widely used in industrial production, communications, information processing, medical beau...
Global and China Mining-use Autonomous Driving Industry Report, 2020-2021
Demand and policies speed up landing of Autonomous Driving in Mining
Traditional mines have problems in recruitment, efficiency, costs, and potential safety hazards, while which can be solved by aut...
Autonomous Agricultural Machinery Research Report, 2020
Autonomous Agricultural Machinery Research: 17,000 sets of autonomous agricultural machinery systems were sold in 2020, a year-on-year increase of 188%
Autonomous agricultural machinery relies heavil...
Global and China CNC Machine Tool Industry Report, 2020-2026
As a typical type of mechatronic products, CNC machine tools combine mechanical technology with CNC intelligence. The upstream mainly involves castings, sheet weldments, precision parts, functional pa...
Global and China Hydraulic Industry Report, 2020-2026
Hydraulic parts, essential to modern equipment manufacturing, are mostly used in mobile machinery, industrial machinery and large-sized equipment. Especially, construction machinery consumes the overw...
Global and China Industrial Robot Speed Reducer Industry Report, 2020-2026
Controller, servo motor and speed reducer, three core components of industrial robot, technologically determine key properties of an industrial robot, such as work accuracy, load, service life, stabil...
Global and China Industrial Robot Servo Motor Industry Report, 2020-2026
As the actuator of control system, servo motor is one of the three crucial parts to industrial robot and its development is bound up with industrial robots. Given the agonizingly slow progress of 3C e...
Global and China Laser Processing Equipment Industry Report, 2020-2026
Laser processing which offers centralized and stable laser beams is applicable to high hardness, high melting point materials that are hard to be processed with traditional technologies. By purpose, l...
Global and China Forklift Industry Report, 2020-2026
In 2019, a total of 1,493,271 forklifts were sold worldwide, up 0.25% year on year, including 647,229 ones or 43.3% sold in Asia.
As the largest producer and seller of forklifts around the globe, Chi...
Global and China Injection Molding Machine Industry Report, 2020-2026
Injection molding machine plays a crucial role in plastics processing machinery, constituting 40% to 50% of the total output value of plastics processing machinery in China. In 2019, injection molding...
China Motion Controller Industry Report, 2019-2026
The motion control market is growing alongside machine tools, robotics, packaging machinery, semiconductors, electronics, among others, being vulnerable to fluctuations in downstream market. In 2018, ...
China Smart Meter Industry Report, 2020-2026
In 2019, instrument and meter companies (each with annual revenue over RMB20 million) in China collectively registered RMB724.26 billion in revenue and RMB70.04 billion in net income, up by 5.5% and 5...
Global and China Agricultural Machinery Industry Report, 2020-2026
Affected by insufficient demand for traditional products, adjustment of purchase subsidy policies, and lower prices of grain crops, China’s agricultural machinery sales remain a downward trend.
In 20...
Global and China Elevator Industry Report, 2019-2025
About 800,000 elevators were sold across the world in 2018, up 1% from a year ago thanks to the robust demand from China, India and the United States, and the ownership of elevators rose to virtually ...