Global and China Rigid PCB Industry Report, 2015
-
Mar.2015
- Hard Copy
- USD
$2,700
-
- Pages:170
- Single User License
(PDF Unprintable)
- USD
$2,500
-
- Code:
ZYW198
- Enterprise-wide License
(PDF Printable & Editable)
- USD
$3,950
-
- Hard Copy + Single User License
- USD
$2,900
-
Global and China Rigid PCB Industry Report, 2014-2015 highlights the followings:
1. PCB industry
2. PCB downstream market
3. Horizontal comparison of PCB companies
4. 35 typical PCB companies
2014 was a good year for majority of PCB companies, as output value of PCB industry touched USD59.6 billion, rising 3.7% against 2013, the fastest growth rate since 2011. Looking forward to 2015, a collapse in prices of commodities, especially in that of copper, will significantly reduce raw materials costs of PCB companies, thus further driving their profit margins.
In 2014, in key regions of PCB manufacturing, euro, NTD, and yen all depreciated sharply, while the won appreciated, dealing a heavy blow to South Korean PCB industry and cutting profit margins of the country’s PCB companies, which all suffered declines in revenue and profit margins, no exception for Samsung’s SEMCO, whose revenue from PCB business glided 2.4%, revenue from IC Carrier business dropped by 19%, and operating margin fell to below 1% from about 9%.
Taiwanese companies and European ones, benefiting from currency devaluation, saw a surge in profit margins, while Japanese peers didn’t gain from yen depreciation, as more than half of their production bases are located in foreign countries, but still performed better than South Korean counterparts.
HDI was still a main engine of growth in rigid PCB field in 2014, and is expected to maintain the momentum in 2015. As mobile phone screens become larger, PCB for mobile phone has to react accordingly. To ensure light weight and thinness of mobile phone, the demand for more advanced Anylayer HDI increases tremendously. As Anylayer HDI technology is time- and -capacity consuming, combined with Panasonic’s withdrawal from Anylayer HDI field, various PCB companies will expand Anylayer HDI capacity in 2015. In 2014, the company registered largest growth in revenue from HDI PCB business was Taiwanese Compeq, which boasts customers like Apple and Xiaomi with impressive performance, jumping by 28.3% to USD690 million, one step away from industry leader Unimicron.
Another spotlight in 2014 was PCB for server. With further penetration of internet economy, the coming of big data era, and influx of large amounts of capital into network economy, the demand for server ushers in explosive growth. PCB for server requires high Tg and low Loss, with layer growing more higher, up to 28, driving continuous increase in unit price of PCB for server since 2009. The companies that specialize in PCB for server, such as Taiwanese WUS Printed Circuit and ACCL, accomplished good results, with WUS Printed Circuit’s revenue ascending by 20% and ACCL’s 27%.
Regarding rigid PCB, LED lighting stimulated demand for metal PCB with good heat elimination performance. Taiwanese T.P.T, GIA TZOONG, and mainland Chinese Shenzhen Kinwong Electronic, which are skilled in metal PCB, all enjoyed a decent level of growth. In addition, PCB for automobile also did a good performance.
The most sensational event in PCB industry in 2014 was the merger of TTM and Viasystems. The combined company is absolutely No. 1 manufacturer with total revenue approximating USD2.5 billion. TTM enjoys a strong position in cellular phone and networking/telecom, and Viasystems in automotive and industrial fields, showing a perfect complementation.
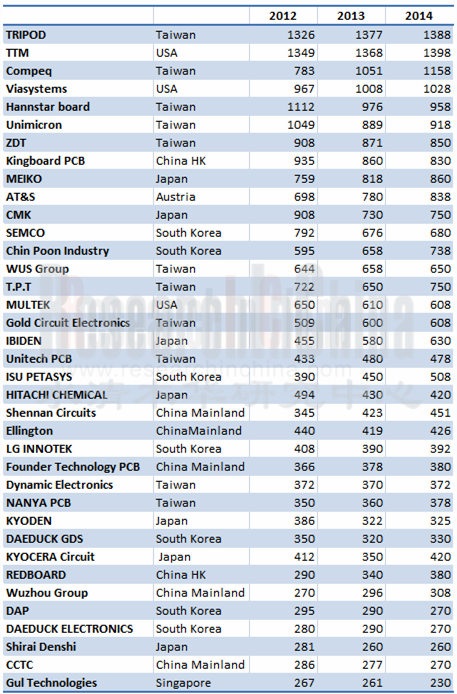
Global Top 40 Rigid PCB Companies by Revenue, 2012-2014
(USD mln)
1. Overview of PCB Industry
1.1 Output Value of Global PCB Industry
1.2 Recent Developments and Future Trends of PCB Industry
1.3 PCB Industry in Taiwan
1.4 PCB Industry in Mainland China
1.4.1 Industrial Scale
1.4.2 Policy
1.5 Ranking of Chinese Mainland PCB Vendors
1.6 PCB Industry in Europe
1.7 PCB Industry in North America
1.8 PCB Industry in Japan
2. PCB Downstream Market
2.1 Global Mobile Phone Market
2.2 Global Smartphone Market
2.3 Chinese Mobile Phone Market
2.4 Tablet PC Market
2.5 Laptop Computer Market
3. Analysis of PCB Industry
3.1 PCB Technology Trends
3.1.1 Ranking of PCB Companies for Mobile Phone
3.1.2 Supporting Relationship of Mobile Phone PCB
3.2 Memory Module PCB
3.3 Rigid PCB
3.4 PCB for Automotive Electronics
3.5 PCB for Laptop Computer
3.6 Ranking of Global PCB Companies
4. Major PCB Companies
4.1 Unimicron
4.2 Compeq
4.3 HannStar Board
4.4 Gold Circuit Electronics
4.5 Tripod Technology
4.6 Meiko
4.7 CMK
4.7.1 WUXI CMK
4.7.2 CMK GBM
4.7.3 CMKC DONGGUAN
4.8 IBIDEN
4.9 Daeduck Electronics
4.10 TTM
4.11 Unitech PCB
4.12 AT&S
4.13 Kingboard
4.13.1 Elec&Eltek
4.13.2 Tech-Wise Circuit
4.13.3 Express Electronics
4.14 SIMMTECH
4.15 T.P.T
4.16 Ellington Electronics
4.17 Chinpoon Industrial
4.18 LG INNOTEK
4.19 SEMCO
4.20 Founder PCB
4.21 Gul Technologies
4.22 Dynamic Electronics
4.23 Viasystems
4.24 Nanya PCB
4.25 Shennan Circuit
4.26 WUS Printed Circuit
4.27 Guangdong Goworld
4.28 ZDT
4.29 Multek
4.30 Kinsus
4.31 Shinko
4.32 ISU PETASYS
4.33 KYOCERA CIRCUIT SOLUTIONS
4.34 Shenzhen Kinwong Electronic
4.35 Allied Circuit
Output Value of PCB Industry, 2001-2015E
Global PCB Output Value, 1980-2001
PCB Industry Chain
Revenue Breakdown of PCB Industry by Technology, 2009-2015E
Global PCB Output Value by Layer, 2013
Revenue of Global PCB Industry by Region, 2013-2015E
Revenue of Global PCB Industry by Region, 2012-2014
Revenue of PCB Industry in Taiwan by Product, 2010-2013
Investment Structure of PCB Companies in Mainland China, 2010-2011
Output Value of PCB Industry in Mainland China by Technology, 2011-2013
Ranking of Chinese Mainland PCB Vendors by Revenue, 2013
European PCB Production by End Market, 2013
Revenue of European PCB Vendors by Country, 2013
Revenue of European PCB Vendors by Country, 2000-2013
Quarterly Revenue of Major European PCB Vendors, 2009-2013
Output Value Growth of European PCB Vendors, 2005-2017E
TOP 50 PCB Vendors in Europe, 2013
Revenue of Major North American PCB Vendors, 2008 Q1-2014 Q1
Growth Rate of North American PCB Output Value, 2005-2017E
Geographical Distribution of Japanese PCB Output Value, 2001-2014
Japanese PCB Output Value by Layer, 2014
Global Mobile Phone Shipments, 2007-2015E
Geographical Distribution of Global 3G/4G Mobile Phone Shipments, 2011-2014
Worldwide Mobile Phone Sales to End Users by Vendor in 2013 (Thousands of Units)
Shipments of Global Top10 Mobile Phone Vendors, 2014 Q3
Worldwide Smartphone Sales to End Users by Vendor in 2013 (Thousands of Units)
Worldwide Smartphone Sales to End Users by Operating System in 2013 (Thousands of Units)
Global Top13 Smartphone Vendors by Shipment, 2013-2015E
Shipments of Major Smartphone Vendors, 2014 Q3
Monthly Mobile Phone Shipments in China, Jan 2013-Dec 2014
Market Share of Major Vendors in Chinese Smartphone Market, 2014
Market Share of Major Vendors in Chinese 4G Mobile Phone Market, 2014
Global Tablet PC Shipments, 2011-2016E
Shipments of Top5 Tablet PC Vendors, 2014 Q4
Shipments, Market Share, and Growth of Top5 Tablet PC Vendors, 2014
Laptop Computer Shipments, 2008-2015E
Shipments of Global Major Laptop Computer ODM Companies, 2010-2014
Ranking of Major HDI Vendors by Revenue, 2012-2014
Supply Structure of PCB for NOKIA Mobile Phone, 2010-2013
Supply Structure of PCB for SAMSUNG Mobile Phone, 2010-2013
Supply Structure of PCB for LG Mobile Phone, 2012
Supply Structure of PCB for ZTE Mobile Phone, 2010-2013
Supply Structure of PCB for RIM Mobile Phone, 2010-2011
Supply Structure of PCB for APPLE, 2010-2013
Ranking of Major HDI Vendors by Revenue, 2012-2014
Ranking of Global DRAM Vendors by Revenue, 2014 Q1
Market Share of Global DRAM Vendors, 2014 Q1
Market Share of NAND Vendors, 2014 Q1
Market Share of Memory Module PCB Vendors, 2010-2013
Market Share of Major Rigid PCB Vendors, 2006/2010/2011/2012
Market Share of PCB Vendors for Automotive Electronics, 2010-2014
Market Share of Major PCB Vendors for Laptop Computer by Shipment, 2011-2014
Supply Chain of Server PCB
Technology Roadmap of Server PCB
Market Share of Global Major Server PCB Vendors, 2014
Global Top40 Rigid PCB Vendors, 2012-2014
Gross Margin of Major PCB Vendors, 2012-2014
Operating Margin of Top25 PCB Vendors, 2012-2014
Organizational Structure of Unimicron
Revenue and Gross Margin of Unimicron, 2003-2014
Revenue and Operating Margin of Unimicron, 2009-2014
Quarterly Revenue and Gross Margin of Unimicron, 2012 Q1-2014 Q4
Sales Breakdown of Unimicron by Technology, 2010-2014
Sales Breakdown of Unimicron by Application, 2010-2014
Capacity of Unimicron, 2010-2014
CAPEX of Unimicron, 2004-2013
Financial Data of Unimicron’s Subsidiaries in Mainland China, 2013
Revenue and Gross Margin of Compeq, 2006-2014
Revenue and Operating Margin of Compeq, 2009-2014
Monthly Revenue and Growth Rate of Compeq, Jan 2013-Jan 2015
Financial Data of Major Subsidiaries under Compeq, 2009-2013
Diagram of Associated Companies of HannStar Board
Revenue and Gross Margin of HannStar Board, 2006-2014
Revenue and Operating Margin of HannStar Board, 2009-2014
Monthly Revenue and Growth Rate of HannStar Board, Jan 2013-Jan 2015
Revenue Breakdown of HannStar Board by Application, 2009-2012
Revenue Breakdown of HannStar Board by Layer, 2009-2012
Financial Data of Major Subsidiaries under HannStar Board, 2011
Financial Data of Major Subsidiaries under HannStar Board, 2013
Revenue and Gross Margin of Gold Circuit Electronics, 2005-2015E
Revenue and Operating Margin of Gold Circuit Electronics, 2009-2014
Monthly Revenue and Growth Rate of Gold Circuit Electronics, Jan 2013-Jan 2015
Revenue Breakdown of Gold Circuit Electronics by Product, 2010-2012
Revenue and Gross Margin of Tripod Technology, 2006-2014
Revenue and Operating Margin of Tripod Technology, 2009-2015E
Revenue Breakdown of Tripod Technology by Application, 2013
Revenue Breakdown of Tripod Technology by Layer, 2013
Monthly Revenue and Growth Rate of Tripod Technology, Jan 2013-Jan 2015
Capacity of Tripod Technology, 2006-2011
Financial Data of Tripod Technology’s Subsidiaries in Mainland China, 2013
Revenue and Operating Margin of Meiko, FY2006-FY2015E
Operating Income of Meiko, FY 2014
Revenue and Operating Margin of Meiko’s Subsidiaries in Mainland China, FY2009-FY2014
Revenue and Operating Margin of Meiko’s Subsidiaries in Mainland China, FY2015E
Revenue Breakdown of Meiko by Application, FY2013-FY2015E
Revenue Breakdown of Meiko by Layer, FY2010-FY2015E
Revenue and Operating Margin of CMK, FY2005-FY2015E
Revenue Breakdown of CMK by Application, FY2007-FY2015E
Revenue Breakdown of CMK by Layer, FY2007-FY2015E
Revenue Breakdown of CMK by Region, FY2007-FY2014
Revenue and Output of WUXI CMK, 2003-2010
Revenue and Operating Margin of IBIDEN, FY2006-FY2015E
Revenue Breakdown of IBIDEN by Business, FY2006-FY2015E
Quarterly Revenue Breakdown of IBIDEN by Business, 2012 Q2-2014 Q2
Quarterly Operating Income of IBIDEN by Business, 2012 Q2-2014 Q2
Revenue Breakdown of IBIDEN’s Electronics Division by Product, FY2010-FY2015E
CAPEX and Depreciation of IBIDEN, FY2010-FY2015E
Revenue and Operating Margin of Daeduck Electronics, 2005-2014
Revenue Breakdown of Daeduck Electronics by Business, 2009-2014
Revenue and Operating Margin of Daeduck GDS, 2005-2014
Revenue Breakdown of Daeduck GDS by Business, 2010-2014
Revenue and Operating Margin of TTM, 2005-2014
Revenue Breakdown of TTM +Viasystems by Application
Quarterly Revenue Breakdown of TTM by Region, 2013 Q1-2014 Q4
Quarterly Revenue and Gross Margin of TTM, 2013 Q1-2014 Q4
Distribution of TTM’s Customers, 2014
Revenue Breakdown of TTM by Region, 2011-2013
Revenue Breakdown of TTM by Technology, 2013
Revenue Breakdown of TTM by Application, 2008-2014
Global Distribution of TTM’s Factories
Revenue and Gross Margin of Unitech PCB, 2006-2014
Revenue and Operating Margin of Unitech PCB, 2009-2015E
Monthly Revenue and Growth Rate of Unitech PCB, Jan 2013-Jan 2015
Technology Roadmap for Rigid PCB
Technology Roadmap for Flexible PCB
Financial Data of Shanghai Unitech Electronics, 2010&2013
EBITDA of AT&S, FY2005-FY2015E
Ramp-up of AT&S’ Substrate Plant in Chongqing
Revenue Breakdown of AT&S by Business and Region, FY2014
Revenue Breakdown of AT&S by Business and Region, FY2015
Quarterly Revenue of AT&S Mobile Devices & Substrates, Q2/13-Q4/14
Main Customers of AT&S Mobile Devices & Substrates
Quarterly Revenue of AT&S Industrial & Automotive, Q2/13-Q4/14
Number of Employees of AT&S, 2010-2015E
CAPEX of AT&S, 2010-2015E
Organizational Structure of Kingboard
Revenue and Margin of Profit Attributable to Equity Shareholders of Kingboard, 2002-2014
Revenue and Pretax Profit Margin of Kingboard, 2009-2014
Revenue Breakdown of Kingboard by Revenue, 2008-2014
Organizational Structure of Elec&Eltek
Revenue and Operating Margin of Elec&Eltek, 2005-2014
Balance Sheets of Elec&Eltek, 2009-2013
Revenue Breakdown of Elec&Eltek by Region, 2006-2013
Revenue Breakdown of Elec&Eltek by Layer, 2006-2013
Capacities of Elec&Eltek’s Plants
Technological Capability of Elec&Eltek
Revenue of Express Electronics from Dongguan Plant, 2009-2013
Revenue of Express Electronics from Suzhou Plant, 2009-2013
Organizational Structure of SIMMTECH
Revenue and Operating Margin of SIMMTECH, 2004-2014
Revenue, Gross Margin and Net Profit Margin of SIMMTECH, 2009-2014
Revenue Breakdown of SIMMTECH by Product, 2013-2015E
Quarterly Gross Margin and Operating Margin of SIMMTECH, 2013 Q1-2014 Q4
Quarterly Shipments of SIMMTECH, 2013 Q1-2014 Q4
Shipments of SIMMTECH, 2012-2015E
Quarterly Capacity Utilization of SIMMTECH, 2013 Q1-2014 Q4
Capacity Utilization of SIMMTECH, 2012-2015E
Revenue Breakdown of SIMMTECH by Application, 2008-2014
Revenue Breakdown of SIMMTECH from Substrate by Application, 2012-2014
SIMMTECH’s Factories
Revenue and Gross Margin of T.P.T, 2005-2014
Revenue and Operating Margin of T.P.T, 2005-2015E
Monthly Revenue and Growth Rate of T.P.T, Jan 2013-Jan 2015
Customer Structure of T.P.T, 2014
Revenue Breakdown of T.P.T by Application, 2014
Financial Data of T.P.T’s Subsidiaries in Mainland China, 2013
Equity Structure of Ellington Electronics
Revenue and Gross Margin of Ellington Electronics, 2007-2014
Revenue Breakdown of Ellington Electronics by Layer, 2009-2014
Revenue Breakdown of Ellington Electronics by Application, 2009-2012H1
Revenue Breakdown of Ellington Electronics by Region, 2009-2012
Revenue and Gross Margin of Chinpoon Industrial, 2005-2013
Revenue and Operating Margin of Chinpoon Industrial, 2005-2015E
Monthly Revenue and Growth Rate of Chinpoon Industrial, Jan 2013-Jan 2015
Revenue and Operating Margin of LG INNOTEK, 2006-2015E
Revenue and Operating Margin of LG INNOTEK, 2012 Q1-2014 Q4
Revenue Breakdown of LG INNOTEK by Business, 2011-2015E
Operating Income Breakdown of LG INNOTEK by Business, 2011-2015E
Revenue and Operating Margin of SEMCO, 2009-2014
Revenue Breakdown of SEMCO by Business Division, 2010-2014
Revenue and Operating Margin of SEMCO ACI Division, 2013 Q1-2014 Q4
SEMCO’s Revenue from HDI and PKG, 2014 Q1-2014 Q4
Revenue and Operating Margin of Founder PCB, 2007-2014
Financial Data of Subsidiaries under Founder PCB, 2013
Downstream Application of Founder PCB, 2010
Capacity of Founder PCB’s Factory in Chongqing
Capacity of Founder PCB’s No.1 Factory in Zhuhai
Capacity of Founder PCB’s No.3 Factory in Zhuhai
Capacity of Founder PCB’s No.5 Factory in Zhuhai
Capacity Breakdown of Founder PCB’s No.1 Factory in Hangzhou by Technology
Capacity of Founder PCB’s No.4 Factory in Zhuhai
HDI Technology Capability of Founder PCB
Revenue and Operating Income of Gul Technologies, 2005-2013
Associated Companies of Gul Technologies
Revenue and Gross Margin of Dynamic Electronics, 2006-2014
Revenue and Operating Margin of Dynamic Electronics, 2009-2014
Monthly Revenue and Growth Rate of Dynamic Electronics, Jan 2013-Jan 2015
Capacity of Dynamic Electronics, 2009-2012
Revenue and Operating Margin of Viasystems, 2006-2014
Revenue Breakdown of Viasystems by Business, 2008-2014
Global Distribution of Viasystems
Revenue Breakdown of Viasystems by Application, 2008-2014
Major Customers of Viasystems
Revenue Breakdown of DDI by Region and End Market
Distribution of DDI’s Factories
Major Customers of DDI
Organizational Structure of Nanya PCB
Revenue and Gross Margin of Nanya PCB, 2006-2014
Revenue and Operating Margin of Nanya PCB, 2009-2015E
Monthly Revenue and Growth Rate of Nanya PCB, Jan 2013-Jan 2015
Capacity and Global Distribution of Nanya PCB
Technology Capability of Nanya PCB
Revenue and Operating Income of WUS Printed Circuit, 2007-2014
Revenue Breakdown of WUS Printed Circuit by Layer, 2010-2014
Revenue Breakdown of WUS Printed Circuit by Application, 2007-2014
Gross Margin of WUS Printed Circuit by Application, 2012-2014
Major Customers of WUS Printed Circuit, 2013
Revenue and Operating Margin of Guangdong Goworld, 2005-2014
Organizational Structure of Guangdong Goworld
Revenue Breakdown of Guangdong Goworld by Business, 2007-2014
Output of Guangdong Goworld, 2007-2013
Organizational Structure of ZDT Holding
Revenue and Operating Margin of ZDT, 2008-2015E
Revenue and Gross Margin of ZDT, 2008-2014
Monthly Revenue of ZDT, Jan 2013-Jan 2015
ZDT Global Footprint
Number of Employees of ZDT, 2006-2014
Technology Roadmap of Multek’s ELIC, 2011-2013
Technology Roadmap of Rigid-Flex PCB of Multek, 2011-2013
Technology Roadmap of Multek’s Microvias, 2011-2013
Revenue and Gross Margin of Kinsus, 2004-2014
Revenue and Operating Margin of Kinsus, 2009-2015E
Monthly Revenue and Growth Rate of Kinsus, Jan 2013-Jan 2015
Revenue Breakdown of Kinsus by Product, 2011-2014
Revenue Breakdown of Kinsus by Application, 2011
Revenue Breakdown of Kinsus by Application, 2014 Q1
Revenue Breakdown of Kinsus by Application, 2014 Q4
Customer Distribution of Kinsus, 2013&2014
Revenue and Net Income of Shinko, FY2007-FY2015E
Revenue Breakdown of Shinko by Business, FY2010-FY2015E
Revenue and Operating Margin of ISU PETASYS, 2008-2014
Revenue Breakdown of ISU PETASYS, by Technology, 2012-2014
Revenue and Operating Margin of Shenzhen Kinwong Electronic, 2011-2015E
Capacity and Output of Shenzhen Kinwong Electronic, 2011-2014
Revenue Breakdown of Shenzhen Kinwong Electronic by Layer, 2011-2014
Revenue Breakdown of Shenzhen Kinwong Electronic by End Market, 2011-2014
ASP of Shenzhen Kinwong Electronic’s Products, 2011-2014
Customer Distribution of Shenzhen Kinwong Electronic, 2011-2014
Raw Materials Costs Structure of Shenzhen Kinwong Electronic, 2011-2014
Raw Materials Prices of Shenzhen Kinwong Electronic, 2011-2014
Major Suppliers of Shenzhen Kinwong Electronic, 2011-2014
Main Equipment of Shenzhen Kinwong Electronic, at the End of Jun 2014
Revenue and Gross Margin of Allied Circuit, 2009-2014
ASP of Allied Circuit’s Products, 2009-2014
Monthly Revenue of Allied Circuit, Jan 2013-Jan 2015
Downstream Distribution of Allied Circuit’s Shipments, 2012-2014
Global and China CMOS Camera Module (CCM) Industry Report, 2020-2026
The global CCM market has been ballooning thanks to expeditious penetration of multi-camera phones and advances in automotive ADAS, being worth $22.723 billion with a year-on-year spike of 16.6% in 20...
Global and China Multi-Layer Ceramic Capacitor (MLCC) Industry Report, 2020-2025
Electronic components like MLCC enjoy a rosy prospect alongside the burgeoning electronic manufacturing, the thriving internet and the prevalence of smart hardware.
MLCC was much sought after and it...
Global and China Voice Coil Motor (VCM) Industry Report, 2019-2025
VCM (voice circle motor or voice coil actuator), a part for smartphone camera, shares around 6% of smartphone camera industry chain value.
Globally, popularity of smartphones such as those with mult...
Global and China Aluminum Electrolytic Capacitor Industry Report, 2019-2025
Chinese aluminum electrolytic capacitor market has been expanding amid a transfer of its downstream industries to China like home appliance illumination, cellphones and computers as well as automatic ...
Global and China Flexible Printed Circuit (FPC) Industry Report, 2019-2025
Flexible printed circuit (FPC) products make their way into consumer electronics like smartphone and tablet PC, in the form of modules for display, touch control, fingerprint recognition, etc. The vol...
Global and China GaAs Industry Report, 2019-2025
Gallium arsenide (GaAs), one of the most mature compound semiconductors, is an integral part of smartphone power amplifier (PA). In 2018, GaAs-based radio frequency (RF) seized over half of the GaAs w...
Global and China Advanced Packaging Industry Report, 2019-2025
The global semiconductor packaging and testing market is enlarging with the prevalence of consumer electronics, automotive semiconductors and the Internet of Things (IoT), with its size edging up 2.5%...
Global and China MLCC Electronic Ceramics Industry Report, 2019-2025
MLCC is mainly used in audio and video equipment, mobile phones, computers and automobiles. The prospective boom of MLCC formula powder hinges on demand: 1) The accelerated renewal of consumer electro...
Global and China OLED Industry Report, 2019-2025
OLED, a new-generation display technology, features simple display structure, green consumables and flexibility and can be rolled up, which makes it easier to transport and install without considering...
Global and China Camera Module Industry Report, 2019-2025
Affected by factors like the maturity of mobile phone markets worldwide and the prolonged replacement of mobile phone by users, the mobile phone market has undergone a slowdown in growth rate. From Q4...
Global and China Multi-Layer Ceramic Capacitor (MLCC) Industry Report, 2018-2023
MLCC finds most application in consumer electronics, automobile and industrial fields and gets beefed up remarkably with the approaching 5G era of cellphones and tablet PCs, the advances in automotive...
Global and China Aluminum Electrolytic Capacitor Industry Report, 2018-2023
Aluminum electrolytic capacitor, a core electronic component, is widely used in consumer electronics, computers and peripherals, industry, electric power, lighting and automobiles.
Global aluminum e...
Global and China CMOS Camera System Industry Report, 2017-2021
Global CCM (CMOS Camera Module) market was worth USD16.611 billion in 2015, a year-on-year rise of 3.8% from 2014, the slowest rate since 2010. Global market fell modestly in 2016 due to a drop in shi...
Global and China Organic Light-Emitting Diode (OLED) Industry Report, 2017-2021
Global OLED market size approximated USD15.7 billion in 2016, a 20.8% rise from a year earlier. Stimulated by reports that Apple will adopt OLED screen for multiple iPhone models in 2017-2018, OLED sc...
Global and China CMOS Camera System Industry Report, 2016-2020
Global and China CMOS Camera System Industry Report, 2016-2020 covers the following:1. Analysis of CMOS Image Sensor (CIS) Industry and Market, with 7 vendors involved.2. Analysis of CMOS Camera Lens ...
Global and China Multi-layer Ceramic Capacitor (MLCC) Industry Report, 2017-2020
The rapid development of consumer electronics and industrial intelligentization has greatly promoted the booming of passive components including multi-layer ceramic capacitor (MLCC). In 2015, China’s ...
Global PCB Industry Report, 2015-2020
Global PCB Industry Report, 2015-2020 highlights the followings:1. Global PCB Market and Status Quo of the Industry2. Global Downstream Markets of PCB3. Mobile Phone PCB Trends4. Tablet PC/Laptop Comp...
Global and China Organic Light-Emitting Diode (OLED) Industry Report, 2016-2020
The OLED market has been developing rapidly worldwide over the recent years, and its market size reached USD13 billion in 2015. With technology and capacity construction, OLED (from small-sized panels...