Global and China FPCB (Flexible Printed Circuit Board) Industry Report, 2014-2015
-
Mar.2015
- Hard Copy
- USD
$2,600
-
- Pages:138
- Single User License
(PDF Unprintable)
- USD
$2,400
-
- Code:
ZYW199
- Enterprise-wide License
(PDF Printable & Editable)
- USD
$3,900
-
- Hard Copy + Single User License
- USD
$2,800
-
Global and China FPCB Industry Report, 2014-2015 involves the following:
1. Analysis on the FPCB Industry
2. Analysis on the FPCB Downstream Market
3. Comparison between FPCB Companies
4. Research on 22 Typical FPCB Companies and 9 FPCB Upstream Companies
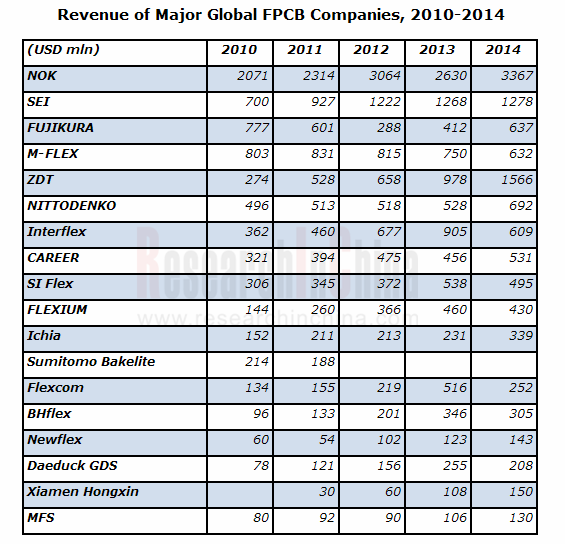
2014 was a bumper year for most FPCB companies, and the output value of the entire PCB industry reached USD12.5 billion, rising by 10.5% from the previous year. In 2015, the prices of bulk commodities (particularly the copper price) plummet, which will greatly reduce the raw material costs of PCB companies and help raise their profitability. Larger screen size of mobile phone requires larger FPCB. The FPCB market is expected to grow 8.6% in 2015 as the smartphone market can not continue its rapid growth and the tablet PC is in recession.
In 2014, the euro, the NTD and the yen significantly devalued, while the South Korean won appreciated, which not only hit a serious blow to the competitiveness of South Korean FPCB enterprises, but minified the profit of South Korean PCB enterprises. The revenue and profit margin of all South Korean PCB companies declined, for example, Flexcom’s revenue slumped by more than 50%, the giant Interflex’s revenue dropped 33% and its operating margin turned to be the negative 14.2%, which showed the power of the currency war.
Benefiting from the currency depreciation, Taiwanese and European companies witnessed soaring profit margins. More than half of Japanese companies did not benefit from the depreciation of the yen because they set up production bases overseas, but still better than South Korean companies.
In the downstream market, the biggest change in 2014 lied in: HDD saw the first growth after three consecutive years of decline. The global HDD shipment amounted to 564 million units, an increase of 2.4% from 2013. Previously, insiders were optimistic about the prospect of SSD instead of HDD; but actually, the SSD price remained high, the tablet PC market decayed, while the laptop computer market recovered to growth after three consecutive years of downturn. At the same time, the development of SSD did not restrict HDD; the new network economy and the big data era stimulated the demand for servers and HDD. HDD will still be the mainstream in the next three to five years, and the HDD shipment is expected to reach 621 million units in 2019. Japanese companies focusing on HDD-use FPCB performed exceedingly well in 2014, for example, the leader NOK (Mektron) achieved the revenue growth rate of 28% and the operating margin of 8.7% (rising from the negative 10.6%), Nitto’s revenue surged by 31%.
The competitiveness of South Korean and American companies weakened significantly. The strong USD made MFLEX’s revenue fall dramatically. The depreciation of NTD facilitated Taiwanese companies to grow by leaps and bounds; meanwhile, Apple greatly reduced orders from South Korean companies, while placed more orders with Japanese and Taiwanese companies in accordance with the principle of the nearest supply. The revenue of ZDT under Foxconn soared 60% in 2014.
1 Overview of FPCB
1.1 Profile
1.2 Single-sided FPCB
1.3 Double-sided FPCB, “Single-sided FPCB + Single-sided FPCB” and Multilayer FPCB
1.4 FPCB Manufacturing Process
2 FPCB Market
2.1 FPCB Market Size
2.2 HDD Market
2.3 HDD Industry
2.4 Global Mobile Phone Market
2.5 Global Smartphone Market and Industry
2.6 Overview of Chinese Mobile Phone Market
2.7 Laptop Computer Market
2.8 Tablet PC Market
2.9 Touch Screen Industry Chain
2.10 Touch Screen Industrial Scale
2.11 Touch Screen Development Trend
2.12 Recent Developments of TFT-LCD Industry
2.13 Ranking of TFT-LCD Industry
3 FPCB Industry
3.1 FPCB Industry Chain
3.2 Business Models of FPCB Companies
3.3 Geographical Distribution of FPCB Industry
3.4 FPCB Supply
3.5 Mobile Phone FPCB Supply
3.6 Ranking of FPCB Companies
4 FPCB Companies
4.1 Fujikura
4.1.1 Fujikura Electronics Shanghai
4.1.2 Fujikura Electronics Wuxi
4.2 Nippon Mektron
4.2.1 Mektec Manufacturing Corporation (Zhuhai)
4.2.2 Mektec Manufacturing Corporation (Suzhou)
4.3 Nitto Denko
4.4 Sony Chemical
4.5 M-Flex
4.6 Flexium
4.7 Career
4.8 Sunflex
4.9 AKM
4.10 Xiamen Hongxin Electron-Tech Co, Ltd.
4.11 Parlex
4.12 SI Flex
4.13 Sumitomo Electric Industries
4.14 Daeduck GDS
4.15 Interflex
4.16 Shenzhen JCD Circuit Technology Co., Ltd.
4.17 BHflex
4.18 Newflex
4.19 Flexcom
4.20 MFS
4.21 Ichia
4.22 ZDT
5. FCCL Companies
5.1 Grace Electron
5.2 Taiflex
5.3 ThinFlex
5.4 Nippon Steel Chemical
5.5 Arisawa
5.6 Microcosm
5.7 AEM
5.8 Taimide
5.9 INNOX
Structure of Single-sided FPCB
Structure of Double-sided FPCB
Block Diagram of “Single-sided FPCB + Single-sided FPCB”
Block Diagram of Double-sided FPCB
Block Diagram of COF
Schematic Diagram of Rigid and Flex PCB
FPCB Manufacturing Process
Work Concept of Exposure Machine
Imaging
Etching
Film Stripping
Hot Pressing
FPCB Market Size, 2007-2015
FPCB Market by Application, 2013-2017E
Quarterly HDD Shipment, Q4 2012-Q4 2014
HDD Shipment, 2009-2015
Market Share of Global Major HDD Companies, 2014
Global HDD Shipment by Application, 2010-2019E
Global Mobile Phone Shipment, 2007-2015
Global 3G / 4G Mobile Phone Shipment by Region, 2011-2014
Worldwide Mobile Phone Sales to End Users by Vendor in 2013
Shipment of Global Top 10 Mobile Phone Companies, Q3 2014
Worldwide Smartphone Sales to End Users by Vendor in 2013
Worldwide Smartphone Sales to End Users by Operating System in 2013
Shipment of Global Top 13 Smartphone Companies, 2013-2015
Shipment of Major Smartphone Companies, Q3 2014
Monthly Shipment of Chinese Mobile Phone Market, Jan 2013-Dec 2014
Market Share of Major Companies in Chinese Smartphone Market, 2014
Market Share of Major Companies in Chinese 4G Mobile Phone Market, 2014
Laptop Computer Shipment, 2008-2015
Shipment of Global Major Laptop Computer ODM Companies, 2010-2014
Global Tablet PC Shipment, 2011-2016E
Shipment of Top Five Tablet PC Vendors, Q4 2014
Shipment, Market Share and Growth of Top Five Tablet PC Vendors, 2014
Touch Screen Industry Chain
Touch Industry Supply Chain and Eco-system
Global Touch Screen Market Size, 2010-2016E
Global Touch Screen Market Size (Shipment), 2010-2016E
Development Trends of Global Smartphone Touch Technology, 2013-2017E
Medium-sized Touch Screen by Technology, 2011-2015
Laptop Touch Screen Shipment by Technology, 2012-2016E
Monthly Total TFT LCD Revenues and Growth, Dec 2013-Dec 2014
Monthly LCD-TV Panel Units Shipments and Growth, Dec 2013-Dec 2014
Monthly Monitor Panel Units Shipments and Growth, Dec 2013-Dec 2014
Monthly Notebook PC Panel Units Shipments and Growth, Dec 2013-Dec 2014
Market Share of Global Major Large-sized TFT-LCD Panel Companies by Shipment, Q2 2014
Operating Margin of Global Major Large-sized TFT-LCD Panel Companies, 2002-2013
Ranking of Global Major TFT-LCD Panel Companies by Revenue, 2012-2014
Operating Margin of Global Major TFT-LCD Panel Companies, 2012-2014
Taiwan's FPCB Industry Chain
Revenue of Global FPCB Industry by Region, 2009-2013
Revenue of Global FPCB Industry by Region, 2010-2011
Major FPCB Suppliers of Samsung by Value, 2011-2013
Major FPCB Suppliers of LG by Value, 2013
Major FPCB Suppliers of Apple by Value, 2011-2014
Ranking of Japanese FPC Companies by Revenue, 2009-2014
Ranking of South Korean FPC Companies by Revenue, 2012-2014
Ranking of South Korean FPC Companies by Operating Margin, 2009-2014
Ranking of Taiwanese FPC Companies by Revenue, 2009-2014
Ranking of Taiwanese FPC Companies by Operating Margin, 2009-2014
Ranking of Major Global FPCB Companies by Revenue, 2010-2014
Bases of Fujikura in Thailand
Revenue and Operating Profit of Fujikura, FY2006-FY2015
Revenue of Fujikura by Division, FY2008-FY2013
Revenue of Fujikura by Product, FY2013-FY2015
Revenue of Fujikura's FPC Segment, FY2008-FY2015
Operating Profit of Fujikura by Business, FY2013-FY2015
Organizational Structure of Mektron
Revenue and Operating Profit of NOK, FY2006-FY2015
Revenue of NOK by Product, FY2006-FY2015
Operating Profit of NOK by Product, FY2013-FY2015
Revenue of NOK by Region, FY2010-FY2014
Revenue of Mektron's FPC Division by Region, FY2010-FY2014
Global Presence of Mektron
Revenue and Operating Profit of Mektec Manufacturing Corporation (Zhuhai), 2004-2014
Revenue and Operating Margin of Nitto Denko, FY2006-FY2015
Revenue of Nitto Denko by Business, FY2013-FY2015
Operating Profit of Nitto Denko by Business, FY2013-FY2015
Revenue and Operating Profit of M-Flex, FY2004-FY2015
Revenue of M-Flex by Region, FY2010-FY2014
Revenue of M-Flex by Country, FY2012-FY2014
Operating Profit of M-Flex by Region, FY2006-FY2013
Percent of Sony Ericsson and Motorola in M-Flex’s Revenue, FY2006-FY2008
Customer Structure of M-Flex, FY2006-FY2013
Revenue of M-Flex by Application, Q1 2011-Q4 2014
Revenue and Gross Margin of Flexium, 2005-2015
Revenue and Operating Margin of Flexium, 2005-2015
Monthly Revenue and Annual Growth Rate of Flexium, Jan 2013-Jan 2015
Revenue of Flexium by Application, 2009-2012
Revenue of Flexium by Application, 2013-2014
FPC Layers of Flexium, 2009-2013
Balance Sheet of Flexium, Q4 2014
Cash Flow of Flexium, Q4 2014
FPCB Engineering Capacity of Flexium
Associated Companies of Career
Organizational Structure of Career
Divisions of Career
Revenue and Operating Margin of Career, 2003-2015
Revenue and Annual Growth Rate of Career, Jan 2013-Jan 2015
Balance Sheet of Career, Q3 2014
Revenue of Career by Client, 2014
Capacity of Career by Product
Major Business of Career by Plant
Financial Data of Three Mainland Chinese Subsidiaries of Career, 2013
Revenue and Operating Margin of Sunflex, 2009-2015
Monthly Revenue and Growth Rate of Sunflex, Jan 2013-Jan 2015
Divisions of Sunflex
Revenue and Gross Margin of AKM, 2006-2014
Revenue and Operating Profit of AKM, 2006-2014
Revenue of AKM by Business, 2009-2013
Major Clients of AKM
FPC Technical Capacity of AKM
Financial Indicators of Xiamen Hongxin Electron-Tech, 2011-2014
Capacity and Output of Xiamen Hongxin Electron-Tech, 2011-2014
Sales Volume and ASP of Xiamen Hongxin Electron-Tech, 2011-2014
Client Distribution of Xiamen Hongxin Electron-Tech, 2013-2014
Revenue and Operating Profit of SI Flex, 2007-2014
Organizational Structure of SI Flex
Revenue and Operating Margin of Sumitomo Electric Industries, FY2008-FY2015
Revenue of Sumitomo Electric Industries by Business, FY2011-FY2015
Operating Profit of Sumitomo Electric Industries by Business, FY2011-FY2015
Revenue of FPC Division of Sumitomo Electric Industries, FY2008-FY2015
Revenue and Operating Margin of Daeduck GDS, 2005-2014
Revenue of Daeduck GDS by Business, 2010-2014
Revenue and Operating Margin of Interflex, 2005-2015
Quarterly Revenue and Operating Margin of Interflex, Q1 2012-Q4 2015
Revenue of Interflex by Product, Q1 2009-Q4 2014
Revenue of Interflex by Customer, 2010-2015
Capacity of Interflex, 2009-2012
Organizational Structure of Shenzhen JCD Circuit Technology
Revenue and Operating Profit of BHflex, 2005-2015
Organizational Structure of BHflex
Revenue of BHflex by Application, 2013-2015
Revenue of BHflex by Client, 2009-2012
Revenue of BHflex by Client, 2013
Revenue and Operating Profit of Newflex, 2005-2015
Revenue and Operating Margin of Flexcom, 2006-2015
Revenue of Flexcom by Client, 2011
Revenue and Profit Attributable to Shareholders of MFS, 2006-2014
Revenue of MFS by Region, 2008-2011
Organizational Structure of Ichia
Revenue and Operating Margin of Ichia, 2006-2015
Monthly Revenue of Ichia, Jan 2013-Jan 2015
Revenue of Ichia by Business, Q1 2013-Q3 2014
Quarterly Gross Margin of Ichia, Q1 2013-Q3 2014
Revenue of Ichia by Application, 2014
Holding Structure of ZDT
Revenue and Operating Margin of ZDT, 2008-2015
Revenue and Gross Margin of ZDT, 2008-2014
Monthly Revenue of ZDT, Jan 2013-Jan 2015
Global Footprint of ZDT
Number of Employees of ZDT, 2006-2014
Financial Statements of ZDT's Subsidiaries in Mainland China, 2013
Revenue and Operating Margin of Taiflex, 2002-2014
Monthly Revenue and Annual Growth Rate of Taiflex, Jan 2013-Jan 2015
Revenue of Taiflex by Business, 2008-2014
FCCL Product Revenue Structure of Taiflex, 2009-2012
Balance Sheet of Taiflex, 2011-2014
Cash Flow of Taiflex, 2011-2014
Revenue and Operating Margin of ThinFlex, 2009-2015
Revenue and Annual Growth Rate of ThinFlex, Jan 2013-Jan 2015
Revenue and Operating Profit of Nippon Steel Chemical, FY2008-FY2015
Revenue Structure of Nippon Steel Chemical by Product, FY2006-FY2015
Revenue and Operating Margin of Arisawa, FY2006-FY2015
Revenue of Arisawa by Product, FY2006-FY2015
Revenue and Operating Margin of Microcosm, 2003-2014
Revenue and Annual Growth Rate of Microcosm, Jan 2013-Jan 2015
Revenue and Operating Margin of AEM, 2007-2014
Monthly Revenue and Growth Rate of AEM, Jan 2013-Jan 2015
Organizational Structure of AEM
Revenue of AEM by Product, 2011
Revenue and Operating Margin of Taimide, 2005-2015
Monthly Revenue and Growth Rate of Taimide, Jan 2013-Jan 2015
Market Share of Global Major PI Companies, 2011
Revenue and Operating Margin of INNOX, 2005-2015
Revenue of INNOX by Product, 2011-2013
Revenue of INNOX by Client, 2014
Global and China CMOS Camera Module (CCM) Industry Report, 2020-2026
The global CCM market has been ballooning thanks to expeditious penetration of multi-camera phones and advances in automotive ADAS, being worth $22.723 billion with a year-on-year spike of 16.6% in 20...
Global and China Multi-Layer Ceramic Capacitor (MLCC) Industry Report, 2020-2025
Electronic components like MLCC enjoy a rosy prospect alongside the burgeoning electronic manufacturing, the thriving internet and the prevalence of smart hardware.
MLCC was much sought after and it...
Global and China Voice Coil Motor (VCM) Industry Report, 2019-2025
VCM (voice circle motor or voice coil actuator), a part for smartphone camera, shares around 6% of smartphone camera industry chain value.
Globally, popularity of smartphones such as those with mult...
Global and China Aluminum Electrolytic Capacitor Industry Report, 2019-2025
Chinese aluminum electrolytic capacitor market has been expanding amid a transfer of its downstream industries to China like home appliance illumination, cellphones and computers as well as automatic ...
Global and China Flexible Printed Circuit (FPC) Industry Report, 2019-2025
Flexible printed circuit (FPC) products make their way into consumer electronics like smartphone and tablet PC, in the form of modules for display, touch control, fingerprint recognition, etc. The vol...
Global and China GaAs Industry Report, 2019-2025
Gallium arsenide (GaAs), one of the most mature compound semiconductors, is an integral part of smartphone power amplifier (PA). In 2018, GaAs-based radio frequency (RF) seized over half of the GaAs w...
Global and China Advanced Packaging Industry Report, 2019-2025
The global semiconductor packaging and testing market is enlarging with the prevalence of consumer electronics, automotive semiconductors and the Internet of Things (IoT), with its size edging up 2.5%...
Global and China MLCC Electronic Ceramics Industry Report, 2019-2025
MLCC is mainly used in audio and video equipment, mobile phones, computers and automobiles. The prospective boom of MLCC formula powder hinges on demand: 1) The accelerated renewal of consumer electro...
Global and China OLED Industry Report, 2019-2025
OLED, a new-generation display technology, features simple display structure, green consumables and flexibility and can be rolled up, which makes it easier to transport and install without considering...
Global and China Camera Module Industry Report, 2019-2025
Affected by factors like the maturity of mobile phone markets worldwide and the prolonged replacement of mobile phone by users, the mobile phone market has undergone a slowdown in growth rate. From Q4...
Global and China Multi-Layer Ceramic Capacitor (MLCC) Industry Report, 2018-2023
MLCC finds most application in consumer electronics, automobile and industrial fields and gets beefed up remarkably with the approaching 5G era of cellphones and tablet PCs, the advances in automotive...
Global and China Aluminum Electrolytic Capacitor Industry Report, 2018-2023
Aluminum electrolytic capacitor, a core electronic component, is widely used in consumer electronics, computers and peripherals, industry, electric power, lighting and automobiles.
Global aluminum e...
Global and China CMOS Camera System Industry Report, 2017-2021
Global CCM (CMOS Camera Module) market was worth USD16.611 billion in 2015, a year-on-year rise of 3.8% from 2014, the slowest rate since 2010. Global market fell modestly in 2016 due to a drop in shi...
Global and China Organic Light-Emitting Diode (OLED) Industry Report, 2017-2021
Global OLED market size approximated USD15.7 billion in 2016, a 20.8% rise from a year earlier. Stimulated by reports that Apple will adopt OLED screen for multiple iPhone models in 2017-2018, OLED sc...
Global and China CMOS Camera System Industry Report, 2016-2020
Global and China CMOS Camera System Industry Report, 2016-2020 covers the following:1. Analysis of CMOS Image Sensor (CIS) Industry and Market, with 7 vendors involved.2. Analysis of CMOS Camera Lens ...
Global and China Multi-layer Ceramic Capacitor (MLCC) Industry Report, 2017-2020
The rapid development of consumer electronics and industrial intelligentization has greatly promoted the booming of passive components including multi-layer ceramic capacitor (MLCC). In 2015, China’s ...
Global PCB Industry Report, 2015-2020
Global PCB Industry Report, 2015-2020 highlights the followings:1. Global PCB Market and Status Quo of the Industry2. Global Downstream Markets of PCB3. Mobile Phone PCB Trends4. Tablet PC/Laptop Comp...
Global and China Organic Light-Emitting Diode (OLED) Industry Report, 2016-2020
The OLED market has been developing rapidly worldwide over the recent years, and its market size reached USD13 billion in 2015. With technology and capacity construction, OLED (from small-sized panels...