Global and China CCM (CMOS Camera Module) Industry Report, 2015
-
Jan.2016
- Hard Copy
- USD
$2,800
-
- Pages:180
- Single User License
(PDF Unprintable)
- USD
$2,600
-
- Code:
ZYW220
- Enterprise-wide License
(PDF Printable & Editable)
- USD
$4,200
-
- Hard Copy + Single User License
- USD
$3,000
-
Global and China CCM (CMOS Camera Module) Industry Report, 2015 highlights the followings:
1. Introduction to CMOS camera module (CCM)
2. CMOS Image Sensor (CIS) market and industry
3. Optical lens industry and market
4. Technological trends of CCM
5. 7 CIS vendors
6. 15 Lens vendors
7. 23 CCM vendors
Global CCM market size was worth USD16.247 billion in 2015, a year-on-year rise of 3.8% from 2014, the slowest rate since 2010. It is expected that growth rate will continue to decelerate in 2016, only 1.3%, but bounce back slightly to 1.6% in 2017 with a market size of USD16.732 billion.
There were several reasons for slowdown. First, the world was plagued by high deflation rates and currencies like Japanese yen, Korean won and NTD depreciated greatly. Second, the mobile phone market slowed and has become almost saturated. Smartphone market can still maintain the expansion in 2015 and may be afraid to be flat or start declining in 2016. Third, the competition, especially that in Chinese mainland market, was intense. Despite continued upgrading of CCM pixel (mostly 13M pixels for rear CCM), the ASP didn’t rise but slip down. As more and more vendors enter the CCM field with OIS and high-performance AF, a price plunge is inevitable.
In CIS field, shipments are expected to amount to 4,196 million units in 2015 and 4,390 million units in 2016, up 8.8% and 4.6% against the previous year, respectively, compared with annual growth of 11.5% in 2014, indicating a further slowdown. The market size is predicted to be USD9.16 billion in 2015 and USD9.628 billion in 2016, a year-on-year rise of 4.6% and 5.1%, respectively, compared with annual increase of 10.7% in 2014. Except for On-Semi, Sony and Sharp, all other vendors experienced declines. Sony acquired Toshiba’s CIS business, further consolidating its hegemony and its first place by performance, and will keep growing rapidly in 2016. On-Semi is a bellwether in automotive CIS field, seizing nearly 50% market share. As integration went well very after acquisition of Aptina by On-Semi, combined with explosive growth in automotive camera market, On-Semi embraced rapid development in its CIS business, and is expected to record revenue of USD720 million in 2015, including USD400 million from automotive field, a surge of more than 100%.
Largan Precision still outshined others in Lens field with high-speed growth, while the rest of vendors almost all suffered setback in Lens business, except for the vendors with automotive Lens business which witnessed significant growth in such field but with a low ASP. Sunny Optical still ranked first globally in automotive Lens; Kantatsu, a subsidiary of Sharp, made its way into the supply chain of Apple with considerable performance growth.
Japanese companies dominated OIS market with Alps and Mitsumi tied for the first place and both being major suppliers for Apple. In addition, Mitsumi also aggressively marched into Chinese mainland market, planning to invest JPY25 billion to expand capacity over the next two years with the aim of competing for the global champion with Alps.
Bi-Direction and Close-Loop have become two main technologies in VCM field. Japanese vendors exited from low-end VCM field and focused on OIS or Bi-Direction and Close-Loop. The emergence of mainland Chinese companies in low-end market resulted in fierce competition.
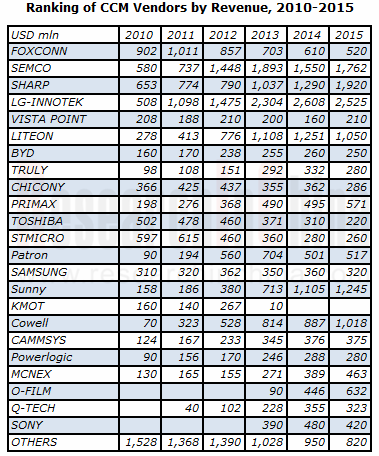
In an increasingly competitive CCM field, the majority of companies were caught in the price war and the market became more concentrated. Many vendors registered higher shipments but smaller revenue, even the number of pixel increased. Sharp, performing the best, became the second largest supplier for Apple that placed more orders with Sharp so as to reduce its reliance on LG-INNOTEK, but LG-INNOTECK was still the largest supplier for Apple and ranked first by revenue globally. Cowell, the third largest supplier for Apple, also did very well, and was one of few companies with improved gross margin. SEMCO won more orders from Samsung. Sunny Optical, the No. 1 mainland Chinese vendor, maintained the momentum of strong growth but with a stagnant gross margin, and started shifting its focus to Lens field in the hope of raising its overall growth margin. LITEON selectively gave up low-end business and saw a decline in orders from its major customer Samsung, leading to a collapse in revenue. MCNEX found strong growth in revenue by relying on automotive business.
1 CCM Industry
1.1 CCM Industry Chain
1.2 CMOS Image Sensor Industry
1.3 CMOS Image Sensor Market
1.4 Market Share of CMOS Image Sensor Vendors
1.5 Chinese CMOS Image Sensor Market
1.6 Optical Lens Industry
1.7 CCM Industry
1.8 Relationship between CCM and Brand Vendors
1.9 Introduction to AFA (VCM)
1.10 AFA (VCM) Industry Pattern
1.11 VCM Industry in China
1.12 Introduction to OIS
1.13 Mobile Phone OIS Market
1.14 Automotive Camera Module Market
1.15 Market Share of Major Automotive Camera Module Vendors
2 CCM Market
2.1 Global Mobile Phone Market
2.2 Global Smartphone Market
2.3 Chinese Mobile Phone Market
2.4 Laptop Computer Market
2.5 Tablet PC Market
2.6 Development Trend of Mobile Phone Camera
2.6.1 Improvement in Speed of Focusing
2.6.2 Shooting in Dim Light
2.6.3 4K
2.6.4 Rotary, Array, Dual Camera
2.6.5 Curved CMOS Sensor
3 CIS Vendors
3.1 Samsung Electronics
3.2 Omnivision
3.3 APTINA (ON-SEMI)
3.4 Sony
3.5 Toshiba
3.6 Galaxycore
3.7 SuperPix Micro Technology
4 Optical Lens Vendors
4.1 Largan
4.2 GSEO
4.3 Asia Optical
4.4 Newmax
4.5 Ability Opto-Electronics Technology
4.6 KANTATSU
4.7 Hitachi Maxell
4.8 DIOSTECH
4.9 SEKONIX
4.10 Korea Optical
4.11 FUJINON
4.12 GLORY
4.13 HOKUGANG
4.14 KMOT
4.15 Digital Optics
5 Camera Module Vendors
5.1 Chicony
5.2 Vista Point Technologies
5.3 Hon Hai
5.4 LG INNOTEK
5.5 Mitsumi Electric
5.6 Truly Opto-Electronics
5.7 BYD Optical
5.8 Lite-On
5.9 Primax
5.10 SEMCO
5.11 Partron
5.12 Sunny Optical
5.13 CAMMSYS
5.14 Powerlogics
5.15 MCNEX
5.16 Cowell
5.17 O-film
5.18 Q-TECH
5.19 Globaloptics
5.20 Shine Tech
5.21 Sharp
5.22 STMicroelectronics
5.23 Others
5.23.1 KingCome
5.23.2 Darling
6 AFA Vendors
6.1 HYSONIC
6.2 JAHWA Electronics
CCM Industry Chain
Cost Structure of 8MP CCM, 2009-2015
Cost Structure of 13MP CCM, 2012-2015
Supply Chain of Image Sensor Vendors
Shipment of Major Global CIS Vendors by Pixel, 2011-2013
CIS Market Size, 2010-2017E
CIS Shipments, 2010-2016E
CIS Shipments by Application,2010-2016E
CIS Market Size by Application, 2015&2017E
Market Share of Global CIS Vendors by Volume, 2013-2014
Market Share of Global CIS Vendors by Revenue, 2013-2015
Market Share of Major Global CIS Vendors, 2012
Market Share of Major Global CIS Vendors by Volume, 2012
Market Share of Major Global CIS Vendors in PC Field by Volume, 2012
Global and China CIS Market Volume for Mobile Phone, 2010-2018E
Global and China CIS Market by Pixel Count, 2010-2018E
China CIS Vendor Market Share by Volume, 2010-2013
China CIS Vendor Market Share by Revenue, 2010-2013
Ranking of Major Global CMOS Camera Optical Lens Vendors by Revenue, 2011-2015
Global CCM Market Size, 2010-2017E
Ranking of Global CCM Vendors by Revenue, 2010-2015
Shipments of China’s Top10 CCM Vendors, Oct 2014
Suppliers of Camera Modules for Nokia, 2013
Suppliers of Camera Modules for Samsung, 2013-2014
Suppliers of Camera Modules for Apple, 2013-2015
Suppliers of Camera Modules for LG, 2012
Suppliers of Camera Modules for ZTE, 2013
Suppliers of Camera Modules for Huawei, 2013-2014
Suppliers of Camera Modules for Lenovo, 2013-2014
Suppliers of Camera Modules for Xiaomi, 2015
Pictorial Diagram of VCM
Profile Diagram of VCM
Supply Relationship between AFA and Camera Module Vendors
Market Share of Major Global AFA Vendors, 2012
Market Share of Major Global AFA Vendors, 2015
Top10 Most Competitive China-made VCM Motors, 2015
Structural Diagram of OIS
Schematic Diagram of OIS
Shipment of Mobile Phone with OIS, 2012-2017E
Market Share of Major OIS Vendors by Revenue, 2015
Global Shipments of Automotive Camera Modules, 2009-2016E
Market Share of Major Automotive Camera Module Vendors, 2012
Global Mobile Phone Shipments, 2007-2016E
Global Mobile Phone Sales to End Users by Vendor, 2012-2013
Shipments of Global Top10 Mobile Phone Vendors, 2013-2015
Global Smartphone Sales to End Users by Vendor, 2012-2015
Global Smartphone Sales to End Users by Operating System, 2012-2015
Market Share of Major Vendors in Chinese Smartphone Market, 2014
Market Share of Major Vendors in Chinese Smartphone Market, 2014-2015
Laptop Computer Shipments, 2008-2015
Shipments of Major Global Laptop Computer ODMs, 2010-2014
Global Tablet PC Shipments, 2011-2016E
Shipments of Top5 Tablet PC Vendors, 2014Q4
Shipments, Market Share, and Growth of Top5 Tablet PC Vendors, 2014
8MP-above CIS Products of Samsung
Revenue and Gross Margin of OMNIVISION, FY2009-FY2016
Revenue and Operating Margin of OMNIVISION, FY2009-FY2016
Shipments of OMNIVISION, FY2009-FY2015
Revenue of OMNIVISION by Region, FY2009-FY2015
Assets of OMNIVISION by Region, FY2009-FY2015
Revenue of OMNIVISION by Application, FY2011-FY2014
Revenue of OMNIVISION by Resolution, FY2013-FY2014
Market Share of OVT by Application, 2014
Supply Chain of OMNINVISION
Quarterly Sales and Gross Margin of ON Semiconductor, 2014Q3-2015Q3
Quarterly Reveue of ON Semiconductor by Business Unit, 2014Q3-2015Q3
Quartely Revenue of ON Semiconductor’s Image Sensor Group, 2014Q3-2015Q3
Organizational Structure of Sony's Semiconductor Division
Sony’s Image Sensor Capacity Expansion Plan
Applications of Sony’s Image Sensors
Revenue and Gross Margin of Galaxycore, 2011-2014
Revenue of Galaxycore by Product, 2011-2014
Revenue of Galaxycore by Pixel, 2011-2014
Shipment of Galaxycore, 2011-2014
Assets, Liabilities and Cash Flow of Galaxycore, 2011-2014
Revenue and Gross Margin of Largan, 2006-2015
Revenue and Operating Margin of Largan, 2006-2015
Quarterly Revenue and Net Profit Margin of Largan, 2013Q1-2015Q3
Monthly Revenue of Largan, Oct 2013-Oct 2015
Shipments of Largan by Pixel, 2014-2015
Revenue of Largan by Customer, 2010-2014
Shipments of Largan, 2011-2014
Financial Data of Largan’s Subsidiaries in Mainland China, 2014
Revenue and Gross Margin of GSEO, 2005-2015
Revenue and Operating Margin of GSEO, 2005-2015
Monthly Revenue of GSEO, Oct 2013-Oct 2015
Revenue and Gross Margin of Asia Optical, 2007-2015
Revenue and Operating Margin of Asia Optical, 2007-2015
Monthly Revenue of Asia Optical, Oct 2013-Oct 2015
Revenue of Asia Optical by Product, 2007-2012
Revenue and Gross Margin of Newmax, 2007-2015
Monthly Revenue of Newmax, Oct 2013-Oct 2015
Revenue and Gross Margin of Ability Opto-Electronics Technology, 2006-2015
Monthly Revenue of Ability Opto-Electronics Technology, Oct 2013-Oct 2015
Mobile Phone Camera Modules of KANTATSU
Revenue of DIOSTECH by Business, 2013
Capacity, Output, and Capacity Utilization of DIOSTECH, 2013
Organizational Structure of DIOSTECH
Production Lines of DIOSTECH
Customers of DIOSTECH
Revenue of DIOSTECH by Pixel, 2012
Revenue and Operating Margin of SEKONIX, 2002-2015
Revenue of SEKONIX by Product, 2009-2015
Handset Lens Revenue of SEKONIX by Pixel, 2009-2014
Handset Lens Shipment of SEKONIX by Pixel, 2009-2014
Revenue and Operating Margin of Korea Optical, 2007-2015
Roadmap of Korea Optical
Revenue and Operating Margin of GloryTek, 2006-2015
Monthly Revenue of GloryTek, Oct 2013-Oct 2015
Revenue and Gross Margin of Hokuang, 2006-2015
Monthly Revenue of Hokuang, Oct 2013-Oct 2015
Optical Units for Cell Phone Revenue of KMOT, FY2011-FY2012
Revenue and Operating Margin of DIGITAL OPTICS, 2007-2015
Revenue of DIGITAL OPTICS by Pixel, 2010-2013
Shipments of DIGITAL OPTICS by Pixel, 2009-2013
CAPEX of DIGITAL OPTICS, 2009-2013
Raw Materials Cost Structure of Digital Optics, 2011-2014
Revenue and Gross Margin of Chicony, 2005-2015
Revenue and Operating Margin of Chicony, 2005-2015
Monthly Revenue of Chicony, Oct 2013-Oct 2015
Revenue of Chicony by Product, 2011-2014
Financial Data of Chicony’s Major Subsidiaries in Mainland China, 2012
Financial Data of Hon Hai’s Major Optical Subsidiaries, 2010
Financial Data of Hon Hai’s Major Optical Subsidiaries, 2014
Revenue and Operating Margin of LG INNOTEK, 2006-2015
Revenue and Operating Margin of LG INNOTEK, 2013Q1-2015Q3
Revenue of LG INNOTEK by Business, 2013-2015
Operating Income of LG INNOTEK by Business, 2011-2015
Quarterly Revenue of LG INNOTEK OPTICAL, 2011Q1-2015Q3
CCM of LG INNOTEK by Pixel, 2012Q3-2015Q3
Revenue and Operating Margin of Mitsumi Electric, FY2006-FY2016
Revenue of Mitsumi Electric by Product, FY2006-FY2016
Revenue and Operating Margin of Truly International, 2005-2015
Quarterly Revenue and Gross Margin of Truly International, 2013Q1-2015Q3
Revenue of LCD Business of Truly International by Technology, 2006-2011
Revenue of Truly Semiconductors by Business, 2012-2015
Shipments Breakdown of Truly Semiconductors by Product, 2012-2015
ASP of Truly Semiconductors by Product, 2012-2015
Main Customers of Truly’s Mobile Phone LCD
Auto Display Capacity of Truly
Main Customers of Truly’s Auto Display
Touch Screen Capacity of Truly
CCM Capacity of Truly
Customers of Truly’s CCM
Business Structure of Lite-On
Quarterly Revenue of Lite-On by Busines, 2013Q1-2015Q3
Lite-On’s Guangzhou Science and Technology Park
CCM Capacity Expansion Plan of Lite-On, 2011Q3-2013Q4
CCM Technology Roadmap of Lite-On
OIS Concept of Lite-On
Revenue and Operating Margin of Lite-On, 2005-2015
Key Milestones of Primax
Revenue and Operating Margin of Primax, 2008-2015
Revenue of Primax by Division, 2007-2015
Monthly Revenue of Primax, Oct 2013-Oct 2015
Global Presence of Primax
Range of Products of Primax
Revenue and Operating Income of SEMCO, 2011-2016E
Revenue of SEMCO by Division, 2010-2015
Operating Income of SEMCO by Division, 2010-2015
CCM Revenue of SEMCO, 2012Q1-2015Q3
Camera Module Revenue of SEMCO by Pixel, 2010-2014
SEMCO’s Camera Module Supply Ratio for Samsung, 2013-2015
CCM Revenue and Operating Margin of SEMCO, 2011Q1-2016Q4E
Revenue and Operating Margin of PARTRON, 2007-2015
Revenue of PARTRON by Product, 2013Q1-2015Q3
CCM Revenue of PARTRON by Pixel, 2013-2015
Revenue and Gross Margin of Sunny Optical, 2004-2015
Financial Summary of Sunny Optical, 2009-2015
Main Customers of Sunny Optical
Monthly Shipments of Sunny Optical by Product, Jan 2014-Oct 2015
Shipments of Sunny Optical by Product, 2013-2015
Revenue of Sunny Optical by Division, 2010-2015
Revenue of Sunny Optical by Application, 2010-2014
Camera Module Shipments of Sunny Optical by Piexl, 2012-2014
Gross Margin of Sunny Optical by Division, 2010-2014
Gross Margin of Sunny Optical by Product, 2012-2016E
Shipments of Handset Lens of Sunny Optical, 2012-2016E
Automotive Lens Revenue of Sunny Optical, 2012-2016
Factories of Sunny Optical
Organizational Structure of CAMMSYS
Revenue and Operating Margin of CAMMSYS, 2009-2015
Raw Materials Price of CAMMSYS, 2011-2014
Revenue and Operating Income of POWERLOGIC, 2009-2015
CCM ASP of POWERLOGIC, 2012-2014
CCM Component ASP of POWERLOGIC, 2012-2014
CCM Capacity of POWERLOGIC, 2012-2014
CCM Output of POWERLOGIC, 2012-2014
Revenue and Operating Income of MCNEX, 2009-2016E
Revenue of MCNEX by Customer, 2013
Revenue of MCNEX by Application, 2010-2016E
MCNEX’s Main Products for Mobile Phone
MCNEX’s Capacity by Region
Revenue and Gross Margin of Cowell, 2005-2015
Revenue Breakdown of Cowell by Segment, 2011-2015
Shipments and ASP of Cowell, 2011-2015
Capacity of Cowell, Oct 31, 2014
Cost Structure of Cowell, 2013-2014
Revenue and Operating Margin of O-film, 2007-2015
Revenue of O-film by Product, 2009-2015
Customer Structure of O-film, 2012-2014
Revenue and Gross Margin of Q-TECH, 2011-2015
Financial Data of Q-TECH, 2011-2014
Cash Flow of Q-TECH, 2011-2014
Shipments of Q-TECH, 2011-2014
Revenue of Q-TECH by Pixel, 2011-2015
Shipments of Q-TECH by Pixel, 2011-2015
ASP of Q-TECH’s Products, 2011-2014
Gross Margin of Q-TECH’s Products, 2011-2014
Customers of Q-TECH, 2015
Revenue and Operating Income of GAI, FY2009-FY2015
Main Customers of Shine Tech
Revenue and Operating Margin of Sharp, FY2008-FY2016
Revenue of Sharp by Business, FY2013-FY2016
Operating Margin of Sharp by Business, FY2013-FY2015
OIS Roadmap of Sharp
Revenue of STMicroelectronics by Product, FY2014
Revenue of STMicroelectronics by Product, 2015Q3
Structure of HYSONIC
Revenue and Operating Income of HYSONIC, 2006-2015
Personnel Organization of Hysonic by the end of Mar 2014
Main Products of HYSONIC
Revenue of HYSONIC by End Customer, 2012-2013
Revenue of HYSONIC by Customer, 2012-2013
Revenue and Operating Margin of JAHWA, 2005-2015
Quaterly Revenue of JAHWA by Product, 2013Q1-2015Q4
Overseas Subsidiaries of JAHWA Electronics
Global and China CMOS Camera Module (CCM) Industry Report, 2020-2026
The global CCM market has been ballooning thanks to expeditious penetration of multi-camera phones and advances in automotive ADAS, being worth $22.723 billion with a year-on-year spike of 16.6% in 20...
Global and China Multi-Layer Ceramic Capacitor (MLCC) Industry Report, 2020-2025
Electronic components like MLCC enjoy a rosy prospect alongside the burgeoning electronic manufacturing, the thriving internet and the prevalence of smart hardware.
MLCC was much sought after and it...
Global and China Voice Coil Motor (VCM) Industry Report, 2019-2025
VCM (voice circle motor or voice coil actuator), a part for smartphone camera, shares around 6% of smartphone camera industry chain value.
Globally, popularity of smartphones such as those with mult...
Global and China Aluminum Electrolytic Capacitor Industry Report, 2019-2025
Chinese aluminum electrolytic capacitor market has been expanding amid a transfer of its downstream industries to China like home appliance illumination, cellphones and computers as well as automatic ...
Global and China Flexible Printed Circuit (FPC) Industry Report, 2019-2025
Flexible printed circuit (FPC) products make their way into consumer electronics like smartphone and tablet PC, in the form of modules for display, touch control, fingerprint recognition, etc. The vol...
Global and China GaAs Industry Report, 2019-2025
Gallium arsenide (GaAs), one of the most mature compound semiconductors, is an integral part of smartphone power amplifier (PA). In 2018, GaAs-based radio frequency (RF) seized over half of the GaAs w...
Global and China Advanced Packaging Industry Report, 2019-2025
The global semiconductor packaging and testing market is enlarging with the prevalence of consumer electronics, automotive semiconductors and the Internet of Things (IoT), with its size edging up 2.5%...
Global and China MLCC Electronic Ceramics Industry Report, 2019-2025
MLCC is mainly used in audio and video equipment, mobile phones, computers and automobiles. The prospective boom of MLCC formula powder hinges on demand: 1) The accelerated renewal of consumer electro...
Global and China OLED Industry Report, 2019-2025
OLED, a new-generation display technology, features simple display structure, green consumables and flexibility and can be rolled up, which makes it easier to transport and install without considering...
Global and China Camera Module Industry Report, 2019-2025
Affected by factors like the maturity of mobile phone markets worldwide and the prolonged replacement of mobile phone by users, the mobile phone market has undergone a slowdown in growth rate. From Q4...
Global and China Multi-Layer Ceramic Capacitor (MLCC) Industry Report, 2018-2023
MLCC finds most application in consumer electronics, automobile and industrial fields and gets beefed up remarkably with the approaching 5G era of cellphones and tablet PCs, the advances in automotive...
Global and China Aluminum Electrolytic Capacitor Industry Report, 2018-2023
Aluminum electrolytic capacitor, a core electronic component, is widely used in consumer electronics, computers and peripherals, industry, electric power, lighting and automobiles.
Global aluminum e...
Global and China CMOS Camera System Industry Report, 2017-2021
Global CCM (CMOS Camera Module) market was worth USD16.611 billion in 2015, a year-on-year rise of 3.8% from 2014, the slowest rate since 2010. Global market fell modestly in 2016 due to a drop in shi...
Global and China Organic Light-Emitting Diode (OLED) Industry Report, 2017-2021
Global OLED market size approximated USD15.7 billion in 2016, a 20.8% rise from a year earlier. Stimulated by reports that Apple will adopt OLED screen for multiple iPhone models in 2017-2018, OLED sc...
Global and China CMOS Camera System Industry Report, 2016-2020
Global and China CMOS Camera System Industry Report, 2016-2020 covers the following:1. Analysis of CMOS Image Sensor (CIS) Industry and Market, with 7 vendors involved.2. Analysis of CMOS Camera Lens ...
Global and China Multi-layer Ceramic Capacitor (MLCC) Industry Report, 2017-2020
The rapid development of consumer electronics and industrial intelligentization has greatly promoted the booming of passive components including multi-layer ceramic capacitor (MLCC). In 2015, China’s ...
Global PCB Industry Report, 2015-2020
Global PCB Industry Report, 2015-2020 highlights the followings:1. Global PCB Market and Status Quo of the Industry2. Global Downstream Markets of PCB3. Mobile Phone PCB Trends4. Tablet PC/Laptop Comp...
Global and China Organic Light-Emitting Diode (OLED) Industry Report, 2016-2020
The OLED market has been developing rapidly worldwide over the recent years, and its market size reached USD13 billion in 2015. With technology and capacity construction, OLED (from small-sized panels...