Global and China Refractories Industry Report, 2016-2020
-
Feb.2016
- Hard Copy
- USD
$2,800
-
- Pages:150
- Single User License
(PDF Unprintable)
- USD
$2,600
-
- Code:
BXM088
- Enterprise-wide License
(PDF Printable & Editable)
- USD
$4,000
-
- Hard Copy + Single User License
- USD
$3,000
-
Impacted by factors such as global economic downturn, China’s economic slowdown, weak growth in downstream sectors of refractories industry, as well as the rising prices of raw materials in recent years, the refractories industry of China has seen fiercer competition, which has resulted in a fall in companies’ orders and sales volume. Even worse, some have made losses.
In the first three quarters of 2015, the refractory output in China was 18.0825 million tons, down 7.63% from the same period of last year, with an estimated full-year output of roughly 26 million tons. Over the same period, China’s refractory exports totaled 1.2997 million tons, down 7.61% year-on-year, as opposed to some 1.75 million tons for the full year.
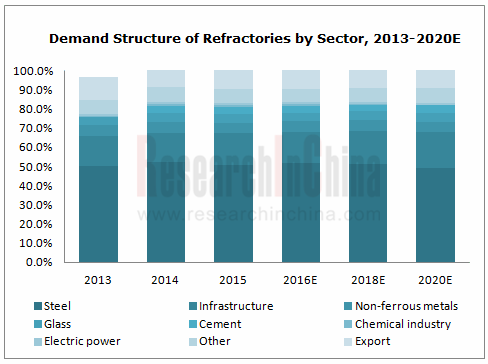
Among key downstream sectors of refractories industry including steel, cement, glass, and building materials, steel represented the largest portion, at around 65% of the global total. In 2015, the crude steel output worldwide amounted to 1.6228 billion tons, a year-on-year fall of 2.8%, of which 803.8 million tons came from China, down 2.3% from the previous year.
Affected by overcapacity in downstream sectors like steel, industrial restructuring and the decreased consumption of refractories for per ton of steel, the demand for refractories in China is anticipated to drop to 21.4 million tons (including export) by 2020, of which refractory for steel will hit about 10.5 million tons.
Source: the Association of China Refractories Industry; ResearchInChina
Presently, there have been several large corporate groups such as Vesuvius, RHI, Morgan Advanced Materials, Magnesita Refratários, and Shinagawa Refractories in the global refractories industry, and all of them have business layout in China.
So far in China, there have been over 2,000 manufacturers of refractory raw materials and products, with the market featuring fierce competition and low concentration, and the combined market share of the top 10 companies reaching about 15%. Through complementing each other and trans-regional allied reorganization of preponderant enterprises over recent years, a number of leading players consisting of Yingkou Qinghua Group, Beijing Lier High-temperature Materials, Luyang Energy-saving Materials, Puyang Refractories Group, and Zhejiang Zili Corporation Limited have sprung up.
Yingkou Qinghua Group:As the largest producer of refractories in China and the place where the Asia’s largest basic refractory production base is located, Yingkou Qinghua Group is primarily focused on basic refractories with annual capacity of 2 million tons. Its revenue reported RMB3 billion or so in 2015.
Beijing Lier High-temperature Materials:As a large general contractor of steel-used refractories in China, Beijing Lier High-temperature Materials have extended its industrial chain aggressively over the recent years. It acquired Liaoning Jinhong Mining Co., Ltd and Liaoning Haicheng Zhongxing Mining Group and organized them into a magnesite base in 2013, and carried internal integration of six companies in Liaoning-based Magnesite Material Base in 2014, and then planned an investment of RMB30 million to set up Beijing Lier E-commerce Co., Ltd in 2015 in a bid to erect an online transaction platform for refractory products.
Luyang Energy-saving Materials:As the largest producer of ceramic fiber in China, Luyang Energy-saving Materials completed the strategic cooperation agreement with Unifrax l LLC and transferred 29% equities to the latter, and obtained 100% equities of Unifrax (Suzhou) as well as the exclusive distributorship of Luyang Unifrax’s products in China in May 2015. Later in September 2015, LuYang Co., Ltd was renamed Luyang Energy-saving Materials Co., Ltd
Global and China Refractories Industry Report, 2016-2020 released by ResearchInChina mainly analyzes the following:
 Supply and demand of refractory materials worldwide, status quo of development in major countries, etc.;
Policies, industrial environment, etc for refractory materials in China;
Supply and demand of refractory materials, competition pattern, etc in China;
Development status and major companies of basic refractory material, unshaped refractory material, ceramic fiber, etc.;
Upstream and downstream markets of refractory materials;
Operation, refractory material business analysis, etc of 13 global and 19 Chinese refractory material companies
1. Overview of Refractories
1.1 Definition & Classification
1.1.1 Definition
1.1.2 Classification
1.2 Industry Chain
2. Development of Refractories Worldwide
2.1Market Supply and Demand
2.1.1 Production
2.1.2 Demand
2.2 Major Countries/Regions
2.2.1 Europe
2.2.2 United States
2.2.3 Japan
2.3.4 India
2.3.5 Australia
2.3.6 Brazil
2.3 Key Companies
3. Status Quo of China Refractories Industry
3.1 Major Policies
3.1.1 Domestic Policies
3.1.2 Export Environment
3.2 Status Quo of the Industry
3.2.1 Operation
3.2.2 Characteristics
3.3 Existing Problems
4. Status Quo of Chinese Refractories Market
4.1Market Supply and Demand
4.1.1 Production
4.1.2 Demand
4.2 Import & Export
4.2.1 Export
4.2.2 Import
4.3 Competition
4.3.1 Regional Pattern
4.3.2 Company Pattern
5. Refractory Product Segments
5.1 Basic Refractory
5.1.1 Development
5.1.2 Chrome-free Basic Refractory
5.1.3 Competitive Landscape
5.2 Unshaped Refractory
5.2.1 Development
5.2.2 Company Competition
5.3 Ceramic Fiber
5.3.1 Development
5.3.2 Key Companies
5.3.3 Development Prospects
6. Upstream/Downstream Refractories in China
6.1 Refractory Raw Material Market
6.1.1 Magnesite
6.1.2 Bauxite
6.1.3 Graphite
6.2 Downstream Refractory Market
6.2.1 Overview
6.2.2 Refractory for Steel Industry
6.2.3 Refractory for Glass Industry
6.2.4 Refractory for Cement Industry
7. Key Companies Worldwide
7.1 Vesuvius
7.1.1 Profile
7.1.2 Operation
7.1.3 Refractory Business
7.1.4 Development in China
7.2 RHI
7.2.1 Profile
7.2.2 Operation
7.2.3 Development Strategy
7.2.4 Development in China
7.3 Magnesita Refratários
7.3.1 Profile
7.3.2 Operation
7.3.3 Refractory Business
7.3.4 Development in China
7.4 Imerys
7.4.1 Profile
7.4.2 Operation
7.4.3 Refractory Business
7.5 Krosaki Harima
7.5.1 Profile
7.5.2 Operation
7.5.3 Development in China
7.6 Shinagawa Refractories
7.6.1 Profile
7.6.2 Operation
7.6.3 Development in China
7.7 Magnezit
7.7.1 Profile
7.7.2 Operation
7.7.3 Development in China
7.8 Harbison Walker International (former ANH Refractories)
7.8.1 Profile
7.8.2 Operation
7.8.3 Development in China
7.9 Morgan Advanced Materials (former Morgan Crucible)
7.9.1 Profile
7.9.2 Operation
7.9.3 Development in China
7.10 Refratechnik
7.10.1 Profile
7.10.2 Operation
7.10.3 Development in China
7.11 Chosun Refractories
7.11.1 Profile
7.11.2 Operation
7.11.3 Development in China
7.12 Minteq
7.12.1 Profile
7.12.2 Operation
7.12.3 Development in China
7.13 Saint-Gobain
7.13.1 Profile
7.13.2 Operation
7.13.3 Development in China
8. Key Enterprises in China
8.1 Puyang Refractories Group Co.,Ltd
8.1.1 Profile
8.1.2 Operation
8.1.3 Revenue Structure
8.1.4 Gross Margin
8.1.5 Development Strategy
8.2 Luyang Energy-saving Materials Co.,Ltd.
8.2.1 Profile
8.2.2 Operation
8.2.3 Revenue Structure
8.2.4 Gross Margin
8.2.5 Development Strategy
8.3 Ruitai Materials Technology Co., Ltd.
8.3.1 Profile
8.3.2 Operation
8.3.3 Revenue Structure
8.3.4 Gross Margin
8.3.5 Operation of Subsidiaries
8.3.6 Development Strategy
8.4 Beijing Lier High-temperature Materials Co., Ltd
8.4.1 Profile
8.4.2 Operation
8.4.3 Revenue Structure
8.4.4 Gross Margin
8.4.5 Development Strategy
8.5 Henan Rongjin High Temperature Materials Co., Ltd.
8.5.1 Profile
8.5.2 Operation
8.5.3 Revenue Structure
8.5.4 Major Customers
8.6 Zhejiang Zili Corporation Limited
8.6.1 Profile
8.6.2 Operation
8.6.3 Revenue Structure
8.6.4 Major Customers
8.6.5 Development Strategy
8.7 Yingkou Qinghua Group Co., Ltd.
8.7.1 Profile
8.7.2 Operation
8.7.3 Key Projects
8.8 Wugang Refractory Co., Ltd
8.8.1 Profile
8.8.2 Operation
8.8.3 Development Strategy
8.9 Yingkou Jinlong Refractories Group Co., Ltd
8.9.1 Profile
8.9.2 Operation
8.10 Shandong Refractories Group Co.,Ltd
8.10.1 Profile
8.10.2 Operation
8.10.3 Main Subsidiaries
8.11 Tongda Refractory Technologies Co., Ltd
8.11.1 Profile
8.11.2 Operation
8.11.3 Key Projects
8.12 Sinosteel Refractory Co., Ltd
8.12.1 Profile
8.12.2 Operation
8.13 Jiangsu Sujia Group Co., Ltd.
8.13.1 Profile
8.13.2 Operation
8.14 Haicheng Houying Trade Group Co., Ltd.
8.14.1 Profile
8.14.2 Operation
8.14.3 Key Projects
8.15 Shanxi Xixiaoping Refractories Co., Ltd.
8.15.1 Profile
8.15.2 Operation
8.16 Others
8.16.1 Zhengzhou Zhengdong Technology Co., Ltd.
8.16.2 Shandong Luqiao New Materials Co., Ltd.
8.16.3 Sinosteel Luoyang Institute of Refractories Research Co., Ltd.
8.16.4 Haicheng Magnesite Refractory General Factory
9. Conclusion & Prediction
9.1 Market
9.2 Enterprises
Classification of Refractories
Refractory Industry Chain
Refractory Consumption Structure (by Sector)
Global Output of Refractories, 2011-2020
Output Structure of Refractories Worldwide by Country/Region, 2014
Driving Forces for the Development of Global Refractories Industry, 2014-2016
Global Demand for Refractories, 2009-2020
Production Structure of Refractories in Europe by Product, 2014
Refractory Output and Sales Value of PRE’s Member Units, 2009-2013
Output of Refractories in Japan, FY2010-FY2014
Consumption of Refractories for Iron & Steel in Japan, FY2011-FY2014
Output and Sales Value of Refractories in India, FY2012-FY2014
Application Fields and % of Refractories in Brazil
Leading Refractory Companies in the World, 2014
Policies on Refractories in China, 2009-2015
Total Export Quotas of Main Refractory Raw Materials in China, 2012-2016
Main Economic Indicators of Chinese Refractories Industry, 2011-2015
Main Economic Indicators of Key Chinese Refractory Companies, 2014-2015
Output and Growth Rate of Refractory Raw Materials in China, 2001-2020E
Export Volume and Value of Main Refractory Raw Materials and Products in China, 2014-2015
Import Volume and Value of Main Refractory Raw Materials and Products in China, 2014-2015
Top 15 Refractory Enterprises in China (by Revenue), 2013
Output and YoY Growth of Refractories in China, 2005-2020
Output of Refractories (by Product) in China, 2010-2020E
Output of Refractories in Key Provinces and Municipalities of China, 2012-2015
Demand for Refractories in China, 2013-2020E
Demand for Refractories (by Sector) in China, 2013-2020E
Export Volume and Value of Refractories in China, 2011-2015
Export Volume of Refractories (by Product) in China, 2009-2015
Volume Structure of Exported Basic Refractories (by Country) from China, 2014
Volume Structure of Exported Alumina-Silica Refractories (by Country) from China, 2014
Volume Structure of Exported Other Refractories (by Country) from China, 2014
Import Volume and Value of Refractories in China, 2011-2015
Import Volume of Refractories (by Product) in China, 2011-2015
Output Structure of Refractories (by Province/Municipality) in China, 2014-2015
Major Refractory Companies in Henan Province
Major Refractory Companies in Liaoning Province
Revenue of Major Refractory Companies in China, 2013-2015
Layout of World’s Major Refractory Companies in China as of end-2015
Main Basic Refractory Raw Materials and Refractory Products
Typical Applications of Basic Refractories
Application of Chromium-free Basic Firebrick in Developed Countries
Technology Roadmaps and Key Manufacturers of Chromium-free Basic Firebrick Substitutes
Key Chromium-free Basic Refractory Projects of Leading Company in China over Recent Years
Comparison between Shaped Refractory and Unshaped Refractory
Proportion of Unshaped Refractory in Major Countries/Regions, 2014
Output and % of Unshaped Refractory in China, 2010-2020
Key Manufacturers of Unshaped Refractory and Capacities in China, 2015
Applications and % of Ceramic Fiber in China
Output of Ceramic Fiber in China, 2007-2020E
Subsidiaries of World’s Leading Ceramic Fiber Manufacturers in China
Leading Ceramic Fiber Enterprises and Their Capacity in China, 2015
Substitution Advantages of Ceramic Fiber
Distribution of Magnesite Reserves Worldwide, 2014
Distribution of Magnesite Resources in China
Output of Magnesite in Major Countries, 2013-2014
Price Trend of Magnesite in the World, 2002-2014
Output of Magnesia (by Product) in China, 2007-2015E
Export Volume of Magnesia (by Product) in China, 2007-2015
Distribution of Bauxite Reserves Worldwide, 2014
Output of Bauxite in Major Countries, 2013-2014
Distribution of Bauxite Resources in China
Export Volume of Refractory Aluminum Clay in China, 2009-2015
Consumption of Bauxite Chamotte and Bauxite in China, 2008-2015
Distribution of Natural Graphite Reserves Worldwide, 2014
Distribution of Graphite (Crystalloid) in China, 2014
Export Volume of Natural Flake Graphite in China, 2009-2015
Main Consumption Fields and Unit Consumption of Refractories
Output of Main Downstream Refractory Industries, 2014-2015
Refractories for Iron and Steel Industry
Output of Crude Steel Worldwide, 2008-2015
Top 10 Producers (Countries) of Crude Steel in the World, 2015
Consumption of Crude Steel in Major Countries
Output and YoY Growth of Crude Steel in China, 2006-2020E
Consumption of Refractories for Per Ton of Steel in China, 2013-2020E
Top 10 Companies by Iron & Steel Output in China, 2014
Key Enterprises of Refractories for Iron & Steel and Major Customers in China
Output of Sheet Glass in China, 2012-2020E
Distribution Chart of Refractories for Glass Melting Furnace
Use (%) of Various Refractories in Glass Furnace
Consumption of Fused Cast Aluminum Oxide for Various Glass Furnaces
Key Companies of Fused Cast Refractory in China and Their Leading Products
Application of Refractories in Cement Kiln
Cement Output in China, 2008-2020E
Revenue and Profits of Vesuvius, 2010-2015
Revenue and Profits of Vesuvius (by Business), 2010-2015
Global Operations of Vesuvius at the end of 2014
Revenue of Vesuvius (by Region), 2013-2014
Refractory Products of Vesuvius
Vesuvius’ Revenue from Refractories, 2011-2015
Vesuvius’ Revenue from Refractories and YoY Growth (by Region), 2013-2015
Refractory Companies of Vesuvius in China
Major Bases and Clients Worldwide of RHI, 2015
Sales Volume of RHI, 2013-2015
Revenue and Profits of RHI, 2009-2015
Revenue of RHI (by Business), 2011-2015
Operating Revenue of RHI (by Region), 2013-2014
RHI’s Strategy for 2020
Refractory Companies of RHI at the end of 2015
RHI’s Sales in China, 2010-2015
Global Layout of Magnesita Refratários
Competitive Edges and Market Share of Magnesita Refratários
Revenue and Net Income of Magnesita Refratários, 2010-2015
Revenue Structure (by Business) of Magnesita Refratários, 2013-2015
Refractory Sales Volume and Revenue of Magnesita Refratários, 2013-2015
Revenue from Refractories (by Application) of Magnesita Refratários, 2013-2015
Revenue from Refractories (by Region) of Magnesita Refratários, 2013-2015
Refractory Companies of Magnesita Refratários in China
Global Operations of Imerys
Revenue and Net Income of Imerys, 2011-2015
Revenue of Imerys (by Region), 2012-2015
Revenue of Imerys (by Business), 2012-2015
Imerys’ Revenue from Four Major Businesses (by Product), 2014
Imerys’ Monolithic Refractories (Calderys) Products and Application
Imerys’ Refractory Mineral Products and Application
Distribution of Imerys’ Refractory Minerals Production Bases
Distribution of Calderys Company’s Production Bases
Milestones in the Development of Calderys, 2005-2015
Development Course of Krosaki
Revenue and Net Income of Krosaki, FY2009-FY2015
Revenue (by Business) of Krosaki, FY2012-FY2015
Applications and Percentage of Krosaki’s Refractories, FY2014
Revenue (by Region) of Krosaki, FY2012-FY2014
Development Course of Shinagawa
Main Products of Shinagawa
Selected Economic Indicators of Shinagawa, FY2012-FY2015
Revenue (by Business) of Shinagawa, FY2012-FY2015
Global Operations of Shinagawa
Overseas Sales of Shinagawa, FY2009-FY2014
Distribution of Shinagawa’s Companies in China
Main Products and Services of Magnezit
Global Operations of Magnezit
Key Clients of Magnezit
Main Products of HWI
Main Plants and Products of HWI
Hit Products of Morgan Advanced Materials
Revenue and Profits of Morgan Advanced Materials, 2009-2015
Revenue of Morgan Advanced Materials (by Country/Region), 2012-2015
Revenue and Profit Margin of Morgan Advanced Materials (by Business), FY2013-FY2015
Revenue of Morgan Advanced Materials (by Applied Sector), FY2014
Key Companies of Morgan Advanced Materials in China
Distribution of Refratechnik’s Plants Worldwide
Refratechnik’s Plants in China
Main Products of Chosun
Distribution of Chosun’s Key Bases Worldwide
Selected Economic Indicators of Chosun, 2010-2013
Production Bases of Chosun in China
Main Refractory Products of Minteq
Revenue (by Business) of Minerals Technologies Inc., 2014
Main Subsidiaries of Minteq
Minteq’s Revenue from Refractory Business, 2012-2015
Revenue and Operating Income of Saint-Gobain, 2013-2015
Key Operations of Saint-Gobain
Application of Saint-Gobain’s Refractories and Competitors
Revenue of Saint-Gobain (by Business), 2013-2015
Revenue of Saint-Gobain (by Region), 2013-2015
Business Turnover of Saint-Gobain in China, 2008-2015
Refractory Companies of Saint-Gobain in China
Revenue and Net Income of Puyang Refractories Group, 2009-2015
Output and Sales Volume of Puyang Refractories Group, 2011-2015
Operating Revenue and YoY Growth (by Product) of Puyang Refractories Group, 2012-2015
Operating Revenue (by Region) of Puyang Refractories Group, 2009-2015
Operating Revenue and Percentage (by Target Customer) of Puyang Refractories Group, 2011-2014
Operating Revenue and Percentage (by Sales Model) of Puyang Refractories Group, 2012-2014
Gross Margin of Refractories of Puyang Refractories Group, 2009-2015
Gross Margin of Main Products of Puyang Refractories Group, 2012-2015
M&A Events of Puyang Refractories Group, 2009-2015
Revenue and Net Income of Luyang Energy-saving Materials, 2009-2015
Operating Revenue (by Product) of Luyang Energy-saving Materials, 2010-2015
Operating Revenue (by Region) of Luyang Energy-saving Materials, 2010-2015
Consolidated Gross Margin of Luyang Energy-saving Materials, 2009-2015
Gross Margin (by Product) of Luyang Energy-saving Materials, 2009-2015
Equity Structure of Luyang Energy-saving Materials, end-2015
Business Development of Ruitai Materials Technology, 2008-2015
Revenue and Net Income of Ruitai Materials Technology, 2009-2015
Output and Sales Volume of Ruitai Materials Technology, 2011-2015
Operating Revenue (by Product) of Ruitai Materials Technology, 2011-2015
Operating Revenue (by Region) of Ruitai Materials Technology, 2009-2015
Gross Margin of Refractory Materials of Ruitai Materials Technology, 2008-2015
Gross Margin (by Product) of Ruitai Materials Technology, 2011-2015
Revenue and Net Income of Ruitai Materials Technology’s Key Subsidiaries, 2014
Business Development of Beijing Lier High-temperature Materials, 2011-2015
Revenue and Net Income of Beijing Lier High-temperature Materials, 2009-2015
Main Production Lines and Capacities of Beijing Lier High-temperature Materials, 2015
Output and Sales Volume of Refractories (by Product) of Beijing Lier High-temperature Materials, 2012-2014
Operating Revenue (by Product) of Beijing Lier High-temperature Materials, 2012-2015
Operating Revenue (by Region) of Beijing Lier High-temperature Materials, 2010-2015
Gross Margin of Refractories of Beijing Lier High-temperature Materials, 2009-2015
Gross Margin (by Product) of Beijing Lier High-temperature Materials, 2012-2015
Integration Map of Liaoning-based Magnesite Material Bases of Beijing Lier High-temperature Materials
Main Products of Henan Rongjin High Temperature Materials
Revenue, Net Income and Gross Margin of Henan Rongjin High Temperature Materials, 2012-2015
Operating Revenue (by Product) of Henan Rongjin High Temperature Materials, 2013-2015
Top 5 Clients of Henan Rongjin High Temperature Materials, 2013-2015
Selected Economic Indicators of Zhejiang Zili Corporation Limited, 2011-2015
Output and Sales Volume of Main Products of Zhejiang Zili Corporation Limited, 2011-2015
Operating Revenue (by Product) of Zhejiang Zili Corporation Limited, 2011-2015
Operating Revenue Structure (by Sales Mode) of Zhejiang Zili Corporation Limited, 2011-2015
Zhejiang Zili Corporation Limited’s Revenue from Top 5 Clients and % of Total Revenue, 2011-2013
Construction Scheme for Equity Investment Projects of Zhejiang Zili Corporation Limited, 2015
Main Products and Application of Yingkou Qinghua Group
Refractory Material Output of Yingkou Qinghua Group, 2012-2015
Refractory Material Output of Wugang Refractory Co., Ltd, 2012-2015
Production Capacity (by Product) of Yingkou Jinlong Refractories Group, 2015
Refractory Subsidiaries and Capacities of Main Products of Yingkou Jinlong Refractories Group, 2015
Refractory Output of Yingkou Jinlong Refractories Group, 2013-2015
Development History of Shandong Refractories Group
Refractory Output of Shandong Refractories Group, 2012-2015
Production Capacity of Key Subsidiaries and Branches under Shandong Refractories Group
Refractory Output of Tongda Refractory Technologies, 2012-2015
Revenue and Net Income of Tongda Refractory Technologies, 2011-2015
Refractory Output of Sinosteel Refractory, 2012-2015
Refractory Output of Jiangsu Sujia Group, 2012-2015
Main Refractory Products of Haicheng Houying Trade Group
Revenue and Taxes of Haicheng Houying Trade Group, 2009-2015
Refractory Output of Haicheng Houying Trade Group, 2012-2015
Selected Economic Indicators of Shanxi Xixiaoping Refractories, 2012-2015
Refractory Output of Zhengzhou Zhengdong Technology, 2012-2015
Refractory Output of Shandong Luqiao New Materials, 2012-2015
Refractory Output of Sinosteel Luoyang Institute of Refractories Research, 2012-2015
Production Capacity (by Product) of Haicheng Magnesite Refractory General Factory
Revenue and YoY Growth of Haicheng Magnesite Refractory General Factory, 2007-2015
Demand and Output of Refractories in China, 2014-2020
Sales Value of World’s Influential Refractory Companies, 2014-2015
Refractory Output of Leading Chinese Enterprises, 2014-2015
Big M&A Events in Chinese Refractories Industry, 2013-2015
Global and China Optical Fiber Preform Industry Report, 2021-2026
Optical fiber preforms play a key role in the optical fiber communication industry chain. The global construction of 4G and FTTH requires less optical fiber and cable, which has dragged down the deman...
Global and China Photoresist Industry Report, 2021-2026
Since its invention in 1959, photoresist has been the most crucial process material for the semiconductor industry. Photoresist was improved as a key material used in the manufacturing process of prin...
Global and China Needle Coke Industry Report, 2021-2026
Needle coke is an important carbon material, featuring a low thermal expansion coefficient, a low electrical resistivity, and strong thermal shock resistance and oxidation resistance. It is suitable f...
Global and China 3D Glass Industry Report, 2021-2026
3D curved glass is light and thin, transparent and clean, anti-fingerprint, anti-glare, hard and scratch-resistant, and performs well in weather resistance. It is applicable to terminals such as high-...
Global and China Graphene Industry Report, 2020-2026
Graphene, a kind of 2D carbon nanomaterial, features excellent properties such as mechanical property and super electrical conductivity and thermal conductivity. Its downstream application ranges from...
Global and China Optical Fiber Preform Industry Report, 2020-2026
Optical fiber preform as a hi-tech product and a crucial link in the optical fiber industry chain contributes to 70% or so of profit margin. Global 4G and FTTH construction at dusk leads to the shrink...
Global and China 3D Glass Industry Report, 2020-2026
Global 3D glass market has been enlarging over the recent years amid demetallization of smartphone back covers and popularity of smart wearables, to approximately $2.86 billion in 2019 and to an estim...
Global and China Photoresist Industry Report, 2020-2026
In 2019, global photoresist market was valued at $8.3 billion, growing at a compound annual rate of 5.1% or so since 2010, and it will outnumber $12.7 billion in 2026 with advances in electronic techn...
Global and China Synthetic Diamond Industry Report, 2020-2026
While its mechanical property is given full play in fields like grinding and cutting, diamond with acoustic, optical, magnetic, thermal and other special properties, as superconducting material, intel...
Global and China Needle Coke Industry Report, 2020-2026
With the merits like small resistivity, excellent resistance to impact and good anti-oxidation property, needle coke has been widely used in ultra-high power graphite electrodes, nuclear reactor decel...
Global and China Optical Fiber Preform Industry Report, 2019-2025
Optical fiber preform, playing an important role in the optical fiber and cable industry chain, seizes about 70% profits of optical fiber. Global demand for optical fiber preform stood at 16.2kt in 20...
China Silicon Carbide Industry Report, 2019-2025
Silicon carbide (SiC) is the most mature and the most widely used among third-generation wide band gap semiconductor materials. Over the past two years, global SiC market capacity, however, hovered ar...
Global and China Photoresist Industry Report, 2019-2025
Photoresist, a sort of material indispensable to PCB, flat panel display, optoelectronic devices, among others, keeps expanding in market size amid the robust demand from downstream sectors. In 2018, ...
Global and China Graphene Industry Report, 2019-2025
Graphene is featured with excellent performance and enjoys a rosy prospect. The global graphene market was worth more than $100 million in 2018, with an anticipated CAGR of virtually 45% between 2019 ...
Global and China 3D Glass Industry Chain Report, 2019-2025
The evolution of AMOLED conduces to the steady development of 3D curved glass market. In 2018, the global 3D glass market expanded 37.7% on an annualized basis and reached $1.9 billion, a figure proje...
China Wood Flooring Industry Report, 2019-2025
With the better standard of living and the people’s desire for an elegant life, wood flooring sees a rising share in the flooring industry of China, up from 33.9% in 2009 to 38.9% in 2018, just behind...
Global and China Photovoltaic Glass Industry Report, 2019-2025
In China, PV installed capacity has ramped up since the issuance of photovoltaic (PV) subsidy policies, reaching 53GW in 2017, or over 50% of global total. However, the domestic PV demand was hit by t...
Global and China ITO Targets Industry Chain Report, 2019-2025
Featured by good electrical conductivity and transparency, ITO targets are widely applied to fields of LCD, flat-panel display, plasma display, touch screen, electronic paper, OLED, solar cell, antist...