Global and China Photovoltaic Glass Industry Report, 2016-2020
-
June 2016
- Hard Copy
- USD
$2,600
-
- Pages:147
- Single User License
(PDF Unprintable)
- USD
$2,400
-
- Code:
ZHP040
- Enterprise-wide License
(PDF Printable & Editable)
- USD
$3,800
-
- Hard Copy + Single User License
- USD
$2,800
-
Photovoltaic glass (PV glass) is directly used for solar PV power generation and solar thermal power generation system components and plays a role in transmission and sunlight control, or conduction. It mainly includes ultra-clear patterned glass, TCO glass and PV anti-reflective glass.
The global PV industry has developed steadily in recent years. In 2010-2015, the global cumulative PV installed capacity registered a CAGR of 41.6%, which brought rapid growth of PV glass consumption. In 2015, the global PV glass consumption attained 580 million square meters, up 44.4% year on year. The CAGR is expected to stay above 20% in 2016-2020.
China as the world’s largest PV glass producer accounts for roughly 75% of total capacity. In 2015, China produced 310 million square meters of PV glass, up 14.1% year on year. The output is expected to reach 350 million square meters in 2016 and exceed 500 million square meters in 2020.
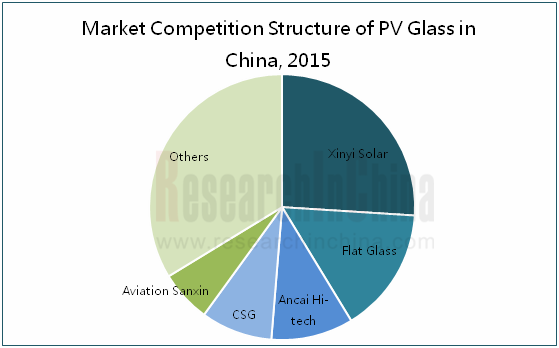
The Chinese PV glass market enjoys a high concentration ratio, with CR5 of 66.3% in 2015. Among them, Xinyi Solar Holding Ltd. occupied the first place with a 26% share. In the future, following the capacity expansion of major PV glass manufacturers, the market concentration will be further improved.
?
Xinyi Solar upgraded a 500 t/d PV raw glass production line to 600 t/d in 2015. In 2016, it is engaged in building a 900 t/d solar glass production line in Malaysia; two 1 kt/d solar glass production lines in Anhui Province, which are planned to go into operation in Q4 2016 and Q1 2017 respectively.
In December 2015, Flat Glass Group invested roughly RMB550 million in the construction of a PV glass manufacturing base in Vietnam, mainly offering services to Southeast Asian, Indian, European, South Korean and Japanese customers. The factory is designed to have an annual capacity of 27 million square meters.
In October 2015, China Glass Holdings Limited and Magnificent Vision Group co-invested RMB1.3 billion in building a solar PV glass production line (1 kt/d) in Yumen City.
In May 2016, the 650 t/d ultra-clear high-transmittance PV glass production line of CNBM (Hefei) New Energy Co., Ltd. was completed and put into production. This marked a full success of the biggest oxygen-fuel combustion ultra-clear high-transmittance PV glass production line construction in China. As the project starts to run formally, 24 million square meters of raw sheets and 18 million square meters of coated sheets will be produced each year.
The report highlights the following:
 Development environment, market size, etc. of global PV glass;
Policy environment, market size, import & export, market price, etc. of Chinese PV glass industry;
Overview, scale, competition pattern, etc. of major PV glass market segments (ultra-clear patterned glass, TCO glass, PV anti-reflective glass);
Overview, market size, market structure, competition pattern, etc. of main upstream sectors (silicon dioxide, sodium carbonate, limestone, aluminum oxide) and downstream application (solar cell module) of PV glass;
Operation, layout in China, revenue structure, PV glass business of 5 global and 18 Chinese PV glass companies.
1. Overview of PV Glass
1.1 Definition and Classification
1.2 Application
1.3 Characteristics
1.4 Manufacturing Technology
1.5 Industry Chain
2. Status Quo of Global PV Glass Industry
2.1 Policy Environment
2.1.1 Policy Environment
2.1.2 Industry Environment
2.2 Market Size
2.2.1 PV
2.2.2 PV glass
3. Status Quo of China PV Glass Industry
3.1 Policy Environment
3.2 Market Status
3.2.1 PV
3.2.2 PV Glass
3.2.3 Market Price
4. Main PV Glass Products
4.1 Ultra-clear Patterned Glass
4.1.1 Profile
4.1.2 Global Market Demand
4.1.3 Status Quo of Chinese Market
4.1.4 Competition Pattern
4.2 TCO Glass
4.2.1 Profile
4.2.2 Global Market Demand
4.2.3 Status Quo of Chinese Market
4.2.4 Competition Pattern
4.3 PV Anti-reflective Glass
4.3.1 Profile
4.3.2 Status Quo of Chinese Market
4.3.3 Competition Pattern
5. Main Upstream Sectors
5.1 Silicon Dioxide
5.1.1 Overview
5.1.2 Market Size
5.2 Sodium Carbonate
5.2.1 Overview
5.2.2 Market Size
5.2.3 Market Structure
5.2.4 Competition Pattern
5.2.5 Problems
5.3 Limestone (Calcium Carbonate)
5.3.1 Overview
5.3.2 Market Size
5.3.3 Market Structure
5.4 Aluminum Oxide
5.4.1 Overview
5.4.2 Market Size
5.4.3 Market Structure
5.4.4 Market Price
5.5 Other
5.5.1 Carbon
5.5.2 Mirabilite
6. Main Downstream Applications
6.1 Solar Cell
6.1.1 Global
6.1.2 China
6.2 Solar Cell Module
6.2.1 Market Size
6.2.2Competition Pattern
7. Major PV Glass Companies Worldwide
7.1 AGC
7.1.1 Profile
7.1.2 Operation
7.1.3 Revenue Structure
7.1.4 PV Glass Business
7.1.5 Development in China
7.2 Saint-Gobain
7.2.1 Profile
7.2.2 Operation
7.2.3 Revenue Structure
7.2.4 PV Glass Business
7.2.5 Development in China
7.3 NSG
7.3.1 Profile
7.3.2 Operation
7.3.3 Revenue Structure
7.3.4 PV Glass Business
7.3.5 Development in China
7.4 PPG Industries
7.4.1 Profile
7.4.2 Operation
7.4.3 Revenue Structure
7.4.4 PV Glass Business
7.4.5 Development in China
7.5 SUNARC
7.5.1 Profile
7.5.2 Operation
7.5.3 Development in China
8. Major Chinese PV Glass Companies
8.1 Xinyi Glass
8.1.1 Profile
8.1.2 Operation
8.1.3 Revenue Structure
8.1.4 PV Glass Business—Xinyi Solar Holding
8.2 CSG Holding
8.2.1 Profile
8.2.2 Operation
8.2.3 Revenue Structure
8.2.4 Gross Margin
8.2.5 PV Glass Business
8.3 Topray Solar
8.3.1 Profile
8.3.2 Operation
8.3.3 Revenue Structure
8.3.4 Gross Margin
8.3.5 Main Production Base
8.3.6 PV Glass Business
8.4 AVIC Sanxin
8.4.1 Profile
8.4.2 Operation
8.4.3 Revenue Structure
8.4.4 Gross Margin
8.4.5 PV Glass Business
8.5 Almaden
8.5.1 Profile
8.5.2 Operation
8.5.3 Revenue Structure
8.5.4 PV Glass Business
8.6 Jiangsu Xiuqiang Glasswork
8.6.1 Profile
8.6.2 Operation
8.6.3 Revenue Structure
8.6.4 PV Glass Business
8.7 China Glass Holdings Limited
8.7.1 Profile
8.7.2 Operation
8.7.3 Revenue Structure
8.7.4 Gross Margin
8.7.5 PV Glass Business
8.8 Shandong Jinjing Science & Technology
8.8.1 Profile
8.8.2 Operation
8.8.3 Revenue Structure
8.8.4 PV Glass Business
8.9 Zhuzhou Kibing Group.
8.9.1 Profile
8.9.2 Operation
8.9.3 Revenue Structure
8.9.4 Glass Business
8.10 Henan Ancai Hi-tech
8.10.1 Profile
8.10.2 Operation
8.10.3 Revenue Structure
8.10.4 PV Glass Business
8.11 IRICO Electronics
8.11.1 Profile
8.11.2 Operation
8.11.3 PV Glass Business
8.12 Guangdong Golden Glass Technologies Limited
8.12.1 Profile
8.12.2 Operation
8.12.3 Revenue Structure
8.12.4 PV Glass Business
8.13 Luoyang Glass
8.13.1 Profile
8.13.2 Operation
8.14 Shanghai Yaohua Pilkington Glass Group
8.14.1 Profile
8.14.2 Operation
8.14.3 Revenue Structure
8.14.4 Gross Margin
8.14.5 PV Glass Business
8.15 Flat Glass Group
8.15.1 Profile
8.15.2 Operation
8.15.3 Revenue Structure
8.15.4 PV Glass Business
8.16 Others
8.16.1 Henan Yuhua PV New Materials
8.16.2 Henan Succeed Photovoltaic Materials
8.16.3 Zhejiang Hehe Photovoltaic Glass Technology
9. Summary and Forecast
9.1 Market
9.2 Company
Classification of PV Glass
Application of PV Glass in Crystalline Silicon Battery Module
Application of PV Glass in Thin-film Battery Module
Application of PV Glass in BIPV
Manufacturing Technology of PV Glass
PV GlassIndustry Chain
PV Industry Policies in Major Countries, 2015-2016
PV Subsidy Policies in Japan, 2015
PV Building Incentive Policy System in Japan
Global PV Installed Capacity, 2005-2020E
Global New PV Installed Capacity (by Region), 2000-2015
Global Cumulative PV Installed Capacity Structure (by Country), 2010-2015
PV System Power Generation as a Percentage of Total Power Consumption in Major Countries, 2015
New PV Grid Connection in Major European Countries, 2000-2015
Global Major PV Glass Consumption and Growth Rate, 2012-2020E
Sales of Major Global PV Glass Companies, 2011-2015
Main PV Industry Policies in China, 2015-2016
Main PV Subsidy Policies in China, 2016
China’s PV Installed Capacity, 2006-2020E
China’s PV Glass Capacity, 2010-2016
China’s PV Glass Output and Growth Rate, 2010-2020E
Revenue and Net Income of Major Chinese PV GlassCompanies, Jan.-Sep. 2015
Capacity of Major Chinese PV Glass Companies, 2015
China’s PV Glass Import Volume and Growth Rate, 2013-2016
China’s PV Glass Export Volume and Growth Rate, 2013-2016
Cost Structure of Solar PV Module
PV Raw Glass Price Trend in China, 2016
Classification and Application of PV Glass
Sketch Map of Ultra-clear Patterned Glass
Ultra-clear Glass Consumption for Solar Cell
Global Consumption of Ultra-clear Patterned Glass, 2007-2015
Ultra-clear Patterned Solar Glass Consumption in China, 2010-2020E
Ultra-clear Patterned Solar Glass Capacity in China, 2013-2016
Changes of Ultra-clear Patterned Glass Production Line in China, 2016
Performance Comparison between Three Kinds of TCO Glass
Global TCO Glass Consumption, 2008-2016
TCO Glass Industrialization in China
Major TCO Conductive Glass Companies in the World
Performance of PV Anti-reflective Glass
Major PV Anti-reflective Glass Companies in China
Major Manufacturers of Anti-reflective Coating for Ultra-clear Rolled Glass in the World
Global Silicon Output and Growth Rate, 2007-2016
Global Silicon Output (by Country), 2014-2015
Global Silicon Dioxide Capacity, 2009-2016
Global Silicon Dioxide Consumption Structure (by Country), 2015
Major Precipitated Silica Producers Worldwide
China’s Silicon Dioxide Market Size and Growth Rate, 2008-2016
China’s Silicon Dioxide Output and Growth Rate, 2008-2016
China’s Silicon Dioxide Output Structure (by Product), 2008-2016
China’s Precipitated Silica Output Structure (by Company Type), 2015
China’s Fumed Silica Output Structure (by Company Type), 2015
China’s Sodium Carbonate Output and Growth Rate, 2010-2016
China’s Sodium Carbonate Output Structure (by Product), 2015
China’s Sodium Carbonate Output Structure (by Production Process), 2015
Distribution of Limestone Resources in China
Global Limestone Consumption, 2011-2016
Global GCC Capacity Structure (by Country), 2015
Global PCC Capacity Structure (by Country), 2015
China’s Calcium Carbonate Output Structure (by Product), 2015
Distribution of Bauxite Resources Worldwide
Distribution of Bauxite Resources in China
Global Aluminum Oxide Output (by Region), 2014-2015
China’s Aluminum Oxide Output and Growth Rate, 2006-2016
Aluminum Oxide Supply-Demand Pattern in China, 2012-2016
China’s Aluminum Oxide Output Structure (by Province/City), 2016
Global Aluminum Oxide Price Trend, 2013-2016
Diamond Reserves in Major Countries
Applications of PV Glass
Classification of Solar PV Cell
Performance Comparison between Thin-film Battery and Crystal Silicon Battery
Global Solar Cell Output and Growth Rate, 2010-2020
Global Solar Cell Output Structure (by Product), 2003-2016
China’s Solar Cell Output and Growth Rate, 2011-2020E
China’s Solar Cell Output Structure (by Region), 2015
China’s Solar Cell Export Value Structure (by Country), 2015
China’s Solar Cell Export Volume Structure (by Country), 2015
Global Solar Cell Module Capacity and Output, 2008-2020E
Global Solar Cell Module Output Structure (by Product), 2015
Shipments of Major Global Solar Cell Module Vendors, 2014-2015
New PV Cell Module Capacity of Major Global Vendors, 2015
New PV Cell Module Capacity of Major Chinese Vendors, 2015
Glass Production Lines of Asahi Glassby Region
Revenue and Operating Income of Asahi Glass, 2008-2016
Revenue Breakdown of Asahi Glassby Business, 2010-2016
Revenue Breakdown of Asahi Glassby Region, 2011-2015
Major Subsidiaries of Asahi Glass in China
Marketing Network of Asahi Glass in China
Revenue and Net Income of Saint-Gobain, 2009-2015
Revenue Breakdown of Saint-Gobain by Business, 2009-2016
Revenue Breakdown of Saint-Gobain by Region, 2009-2016
Revenue and YoY of Saint-Gobain in China, 2002-2015
Layout of Saint-Gobain in China
Major Companies of Saint-Gobain in China Involved in Glass Business
Revenue and Net Income of NSG, FY2009-FY2016
Revenue Breakdown of NSG by Business, FY2009-FY2016
Revenue Breakdown of NSG by Region, FY2013-FY2015
Revenue Breakdown of NSG’s Major Products by Region, FY2016
Subsidiaries of NSG in China
Factory Distribution of PPG by Region, as of February 18, 2016
Revenue and Net Income of PPG, 2008-2016
Revenue Breakdown of PPG by Business, 2009-2016
Revenue Breakdown of PPG by Region, 2011-2015
PPG’s Cooperation in Glass Business in China
AR Glass Transmission Rates of SUNARC (by Field)
Revenue and Net Income of Xinyi Glass, 2007-2015
Revenue Breakdown of Xinyi Glass by Product, 2007-2015
Revenue Breakdown of Xinyi Glass by Region, 2007-2015
Marketing Network of Xinyi Solar in China
PV Glass Capacity of Xinyi Solar, 2013-2015
Revenue Breakdown of Xinyi Solar by Product, 2012-2015
Solar Glass Revenue Structure of Xinyi Solar (by Region), 2012-2015
PV Glass Production Lines of Xinyi Solar, 2016
Global Marketing Network of CSG Holding
Revenue and Net Income of CSG Holding, 2007-2016
Revenue Breakdown of CSG Holding by Product, 2008-2015
Revenue Breakdown of CSG Holding by Region, 2008-2015
Gross Margin of CSG Holding by Product, 2008-2015
PV Glass Subsidiaries of CSG Holding
Revenue and Net Income of Shenzhen Topraysolar, 2008-2016
Revenue Breakdown of Shenzhen Topraysolar by Product, 2009-2015
Three Overseas Marketing Companies of Shenzhen Topraysolar
Revenue Breakdown of Shenzhen Topraysolar by Region, 2009-2015
Gross Margin of Shenzhen Topraysolar by Product, 2009-2015
Three Major Production Bases of Shenzhen Topraysolar
Revenue from PV Glass Business of Shenzhen Topraysolar, 2010-2015
Financials of Major PV Glass Subsidiaries of Shenzhen Topraysolar, 2014-2015
Industrial Structure of Aviation Sanxin
Revenue and Net Income of Aviation Sanxin, 2007-2016
Revenue Breakdown of Aviation Sanxin by Product, 2008-2015
Revenue Breakdown of Aviation Sanxin by Region, 2008-2015
Gross Margin of Aviation Sanxin by Product, 2008-2015
Specialty Glass Production Bases of Aviation Sanxin
Production Bases of Aviation Sanxin
Revenue and Net Income of Aviation Sanxin Solar PV Glass, 2011-2015
Revenue and Net Income of Changzhou Almaden, 2008-2016
Revenue Breakdown of Changzhou Almaden by Product, 2012-2015
Revenue Breakdown of Changzhou Almaden by Region, 2009-2015
Production and Sales Volume of PV Glass of Changzhou Almaden, 2012-2015
Revenue and Gross Margin of PV Glass Business of Changzhou Almaden, 2012-2015
Marketing Network of Jiangsu Xiuqiang Glasswork Worldwide
Revenue and Net Income of Jiangsu Xiuqiang Glasswork, 2008-2016
Revenue Breakdown of Jiangsu Xiuqiang Glasswork by Product, 2009-2015
Revenue Breakdown of Jiangsu Xiuqiang Glasswork by Region, 2010-2015
Solar Glass Products of Jiangsu Xiuqiang Glasswork
Marketing Network of Solar Glass of Jiangsu Xiuqiang Glasswork in China
Production and Sales Volume of PV Glass of Jiangsu Xiuqiang Glasswork, 2012-2015
Revenue of Solar Glass Business of Jiangsu Xiuqiang Glasswork, 2009-2015
TCO Glass Capacity of Jiangsu Xiuqiang Glasswork, 2011-2015
Leading Products of China Glass Holdings Limited
Revenue and Net Income of China Glass Holdings Limited, 2007-2015
Revenue Breakdown of China Glass Holdings Limited by Product, 2010-2015
Revenue Breakdown of China Glass Holdings Limited by Region, 2008-2015
Gross Margin of China Glass Holdings Limited by Product, 2010-2015
Main PV Production Lines of China Glass Holdings Limited
Revenue and Net Income of Shandong Jinjing Science & Technology, 2006-2016
Revenue Breakdown of Shandong Jinjing Science & Technology by Product, 2008-2015
Revenue Breakdown of Shandong Jinjing Science & Technology by Region, 2008-2015
Glass Production Lines of Shandong Jinjing Science & Technology
Global Marketing Network of Zhuzhou Kibing Group
Revenue and Net Income of Zhuzhou Kibing Group, 2008-2016
Revenue Breakdown of Zhuzhou Kibing Group by Product, 2008-2015
Revenue Breakdown of Zhuzhou Kibing Group by Region, 2008-2015
Production Bases of Zhuzhou Kibing Group
PV Glass Production Lines of Zhuzhou Kibing Group
Revenue and Net Income of Henan Ancai Hi-tech, 2008-2016
Revenue Breakdown of Henan Ancai Hi-tech by Product, 2012-2015
Revenue Breakdown of Henan Ancai Hi-tech by Product, 2012-2015
Revenue and Gross Margin of PV Glass Business of Henan Ancai Hi-tech, 2010-2015
Revenue and Gross Profit of IRICO Group Electronics, 2008-2015
PV Glass Production Lines of IRICO Group Electronics
Revenue of PV Glass Business of IRICO Group Electronics, 2010-2015
Revenue and Net Income of Guangdong Golden Glass Technologies Limited, 2008-2016
Revenue Breakdown of Guangdong Golden Glass Technologies Limited by Product, 2010-2015
Revenue Breakdown of Guangdong Golden Glass Technologies Limited by Region, 2014-2015
Revenue of PV Glass (Module) Business of Guangdong Golden Glass Technologies Limited, 2010-2015
Revenue and Net Income of Luoyang Glass, 2008-2016
Marketing Network of Shanghai Yaohua Pilkington Glass Group
Subsidiaries of Shanghai Yaohua Pilkington Glass Group
Revenue and Net Income of Shanghai Yaohua Pilkington Glass Group, 2007-2016
Revenue Breakdown of Shanghai Yaohua Pilkington Glass Group by Product, 2015
Revenue Breakdown of Shanghai Yaohua Pilkington Glass Groupby Region, 2008-2015
Gross Margin of Shanghai Yaohua Pilkington Glass Group, 2006-2015
Operations of Major PV Glass Subsidiaries of Shanghai Yaohua Pilkington Glass Group, 2014-2015
Revenue and Net Income of Flat Glass, 2012-2015
Revenue Breakdown and Structure of Flat Glass Group (by Product), 2014-2015
Revenue Breakdown and Structure of Flat Glass Group (by Region), 2014-2015
Major PV Glass Production Bases of Flat Glass Group
Industrial Chains of Henan Succeed Photovoltaic Materials Corporation
Global and China’s New PV Installed Capacity Growth Rates, 2006-2020E
Global Major PV Glass Consumption, 2007-2016
Revenue Growth Rates of Major Global PV Glass Companies, 2007-2015
Competition Pattern of China PV Glass Market, 2015
Global and China Optical Fiber Preform Industry Report, 2021-2026
Optical fiber preforms play a key role in the optical fiber communication industry chain. The global construction of 4G and FTTH requires less optical fiber and cable, which has dragged down the deman...
Global and China Photoresist Industry Report, 2021-2026
Since its invention in 1959, photoresist has been the most crucial process material for the semiconductor industry. Photoresist was improved as a key material used in the manufacturing process of prin...
Global and China Needle Coke Industry Report, 2021-2026
Needle coke is an important carbon material, featuring a low thermal expansion coefficient, a low electrical resistivity, and strong thermal shock resistance and oxidation resistance. It is suitable f...
Global and China 3D Glass Industry Report, 2021-2026
3D curved glass is light and thin, transparent and clean, anti-fingerprint, anti-glare, hard and scratch-resistant, and performs well in weather resistance. It is applicable to terminals such as high-...
Global and China Graphene Industry Report, 2020-2026
Graphene, a kind of 2D carbon nanomaterial, features excellent properties such as mechanical property and super electrical conductivity and thermal conductivity. Its downstream application ranges from...
Global and China Optical Fiber Preform Industry Report, 2020-2026
Optical fiber preform as a hi-tech product and a crucial link in the optical fiber industry chain contributes to 70% or so of profit margin. Global 4G and FTTH construction at dusk leads to the shrink...
Global and China 3D Glass Industry Report, 2020-2026
Global 3D glass market has been enlarging over the recent years amid demetallization of smartphone back covers and popularity of smart wearables, to approximately $2.86 billion in 2019 and to an estim...
Global and China Photoresist Industry Report, 2020-2026
In 2019, global photoresist market was valued at $8.3 billion, growing at a compound annual rate of 5.1% or so since 2010, and it will outnumber $12.7 billion in 2026 with advances in electronic techn...
Global and China Synthetic Diamond Industry Report, 2020-2026
While its mechanical property is given full play in fields like grinding and cutting, diamond with acoustic, optical, magnetic, thermal and other special properties, as superconducting material, intel...
Global and China Needle Coke Industry Report, 2020-2026
With the merits like small resistivity, excellent resistance to impact and good anti-oxidation property, needle coke has been widely used in ultra-high power graphite electrodes, nuclear reactor decel...
Global and China Optical Fiber Preform Industry Report, 2019-2025
Optical fiber preform, playing an important role in the optical fiber and cable industry chain, seizes about 70% profits of optical fiber. Global demand for optical fiber preform stood at 16.2kt in 20...
China Silicon Carbide Industry Report, 2019-2025
Silicon carbide (SiC) is the most mature and the most widely used among third-generation wide band gap semiconductor materials. Over the past two years, global SiC market capacity, however, hovered ar...
Global and China Photoresist Industry Report, 2019-2025
Photoresist, a sort of material indispensable to PCB, flat panel display, optoelectronic devices, among others, keeps expanding in market size amid the robust demand from downstream sectors. In 2018, ...
Global and China Graphene Industry Report, 2019-2025
Graphene is featured with excellent performance and enjoys a rosy prospect. The global graphene market was worth more than $100 million in 2018, with an anticipated CAGR of virtually 45% between 2019 ...
Global and China 3D Glass Industry Chain Report, 2019-2025
The evolution of AMOLED conduces to the steady development of 3D curved glass market. In 2018, the global 3D glass market expanded 37.7% on an annualized basis and reached $1.9 billion, a figure proje...
China Wood Flooring Industry Report, 2019-2025
With the better standard of living and the people’s desire for an elegant life, wood flooring sees a rising share in the flooring industry of China, up from 33.9% in 2009 to 38.9% in 2018, just behind...
Global and China Photovoltaic Glass Industry Report, 2019-2025
In China, PV installed capacity has ramped up since the issuance of photovoltaic (PV) subsidy policies, reaching 53GW in 2017, or over 50% of global total. However, the domestic PV demand was hit by t...
Global and China ITO Targets Industry Chain Report, 2019-2025
Featured by good electrical conductivity and transparency, ITO targets are widely applied to fields of LCD, flat-panel display, plasma display, touch screen, electronic paper, OLED, solar cell, antist...