Global and China Aluminum Rolling (Aluminum Sheets, Strips and Foils)Industry Report, 2016-2020
-
July 2016
- Hard Copy
- USD
$2,750
-
- Pages:222
- Single User License
(PDF Unprintable)
- USD
$2,550
-
- Code:
CYH048
- Enterprise-wide License
(PDF Printable & Editable)
- USD
$3,950
-
- Hard Copy + Single User License
- USD
$2,950
-
Aluminum rolled products are primarily used in packaging, transportation and construction sectors. Global consumption of aluminum rolled products amounted to 23.8 million tons in 2015, up 5.1% from a year ago and a 1.5 percentage points slowdown from 2014. Packaging industry took the largest proportion of aluminum rolled products consumption (41%), followed by the transportation sector (23%).
It is projected that global consumption of aluminum rolled products will hit 30 million tons in 2020 at a CAGR of around 5% with the transportation likely surpassing packaging to become the largest application market of aluminum rolling.
China, as the world’s most important aluminum processing & consumption base, produced 10.70 million tons of aluminum sheets & strips and 2.665 million tons of aluminum foils in 2015, a year-on-year rise of 8.5% and 0.6%, respectively. The output of aluminum sheets & strips and foils is expected to maintain a pace of about 7% and 5% during 2016-2020, separately.
Packaging and transportation are the largest two sectors for aluminum rolled products in China, making up 17% and 15% in 2015, respectively. Thanks to rapid growth in demand from automobile, MU (Multiple Units), urban rail subway, and airplane markets, the transportation will generate the largest demand for aluminum rolled products over the next four years with its share increasing to 21%.
Downstream Consumption Pattern of Aluminum Rolling in China, 2015&2020
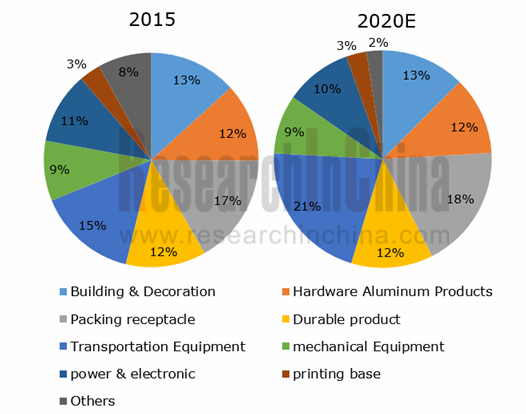
Source: ResearchInChina
The world’s major producers of aluminum rolled products are Novelis, Alcoa, Furuk/SLM/TAA, Hydro, Aleris and Constellium, holding a combined market share of 40% (by sales volume) in 2015, of which Novelis occupied the largest proportion (14%), followed by Alcoa.
Due to technical constraints, Chinese producers of aluminum rolled products focus mainly on blank and mid- to lower range products markets, compared with predominance of foreign players in high-end aluminum sheets/strips market. Domestic enterprises, including Shandong Nanshan Aluminium Co., Ltd., Jiangsu Dingsheng New Energy Materials, Zhejiang Dongliang New Material, Henan MingtaiAl.Industrial, Shandong Weiqiao Aluminum & Electricity, and Tianjin ZhongwangAluminium Industry, have strengthened their presence in high-end aluminum sheets & strips and foils like automotive aluminum sheets and aerospace aluminum sheet in recent years.
Novelis: the world’s largest producer of aluminum rolled products; production bases across 11 countries; the first factory put into production in 2014 in China has annual capacity of 120,000 t/a automotive aluminum sheets.
Aleris: the world’s third largest producer of aluminum rolled products with a market share of roughly 4% in 2015. Phase I of Zhenjiang-based production base in China went into operation in 2013 with capacity of 25,000 t/a aerospace aluminum sheets, and Phase II being built with annual capacity of 100,000-ton high-end automotive aluminum alloy sheet (including 80,000-ton automotive body sheets) is expected to start production in early 2017.
Shandong Nanshan Aluminium: a core producer of aluminum rolled products in China with a market share of around 9.6% (by sales volume). The projects under construction include 200,000 t/a ultra-large high-performance specialty aluminum alloy production line (mainly aerospace and automotive aluminum sheets) and 40,000 t/a high-precision and multi-purpose aluminum foil production line.
Jiangsu Dingsheng New Energy Materials: a key aluminum foil enterprise in China with production capacity of 1.185 million t/a. The company has 7 aluminum sheet/strip/foil projects under construction in 2016, and will add capacity of 1.85 million t/a when all these projects go into operation.
Global and China Aluminum Rolling (Aluminum Sheets, Strips and Foils) Industry Report, 2016-2020 highlights the followings:
 Global and China’s primary aluminum and aluminum processing industries (market supply & demand, prices, import & export, etc.);
Global aluminum rolling (market demand, product structure, regional structure, etc.);
Aluminum sheets/strips and foils in China (policies, production lines, market supply & demand, import & export, competitive landscape, etc.);
Demand from key downstream sectors including construction, packaging, automobile, high-speed rail, subway, electric power, etc.;
8 global aluminum rolling enterprises (operation, development in China, etc.);
20 key Chinese aluminum rolling enterprises (operation, development strategy, etc.);
Aluminum rolling business in the world and China during 2016-2020.
1.Aluminum Rolling Industry
1.1 Definition
1.2 Industry Chain
2.Development of Global and China’s Primary Aluminum Industry
2.1 Global
2.1.1 Supply
2.1.2 Demand
2.1.3 Price
2.1.4 Aluminum Processing Market
2.2 China
2.2.1 Overview
2.2.2 Supply
2.2.3 Import & Export
2.2.4 Demand
2.2.5 Price
2.2.6 Aluminum Processing Market
3.Development of Global Aluminum Rolling Market
3.1 Overview
3.2 Product Mix
3.3 Regional Structure
3.3.1 Japan
3.3.2 Western Europe
3.3.3 The Middle East
3.4 Competitive Landscape
4.Development of Chinese Aluminum Rolling Market
4.1 Policy
4.2 Production Line
4.3 Aluminum Sheets/Strips
4.3.1 Supply
4.3.2 Import & Export
4.3.3 Demand
4.4 Aluminum Foil
4.4.1 Supply
4.4.2 Import & Export
4.4.3 Demand
4.5 Competitive Landscape
5. Downstream Demand for Aluminum Rolled Products
5.1 Application of Aluminum Sheet/Strip
5.1.1 Building
5.1.2 Packaging
5.1.3 Automobile
5.1.4 Rail Transit
5.1.5 Aerospace
5.1.6 Ship
5.1.7 Printing
5.2 Applications of Aluminum Foil
5.2.1 Heat Transport
5.2.2 Packaging
5.2.3 Power Electronics
5.2.4 Aluminum Foil for Li-ion Battery
6.Major Aluminum Rolling Companies in the World
6.1 ALCOA
6.1.1 Profile
6.1.2 Operation
6.1.3 Revenue Structure
6.1.4 Aluminum Rolling Business
6.1.4 Development in China
6.1.5 Dynamics
6.2 Constellium
6.2.1 Profile
6.2.2 Operation
6.2.3 Revenue Structure
6.2.4 Aluminum Rolling Business
6.2.5 Development in China
6.3 Norsk Hydro
6.3.1 Profile
6.3.2 Operation
6.3.3 Revenue Structure
6.3.4 Aluminum Rolling Business
6.3.5 Development in China
6.4 Aleris
6.4.1 Profile
6.4.2 Operation
6.4.3 Automotive Aluminum Sheet Business
6.4.4 Development in China
6.5 Novelis
6.5.1 Profile
6.5.2 Operation
6.5.3 Aluminum Rolling Business
6.5.4 Development in China
6.6 Kobe Steel
6.6.1 Profile
6.6.2 Operation
6.6.3 Revenue Structure
6.6.4 Aluminum Rolling Business
6.6.5 Development in China
6.7 UACJ
6.7.1 Profile
6.7.2 Operation
6.7.3 Aluminum Rolling Business
6.7.4 Development in China
6.8 AMAG
6.8.1 Profile
6.8.2 Operation
6.8.3 Aluminum Rolling Business
7. Major Aluminum Rolling Enterprises in China
7.1 Aluminum Corporation of China
7.1.1 Profile
7.1.2 Operation
7.1.3 Revenue Structure
7.1.4 Aluminum Rolling Business
7.2 Henan Mingtai Al. Industrial Co., Ltd (601677)
7.2.1 Profile
7.2.2 Operation
7.2.3 Revenue Structure
7.2.4 Gross Margin
7.2.5 Output and Sales Volume
7.2.6 Projects under Construction
7.2.7 Prospects
7.3 Zhejiang Dongliang New Material Co., Ltd.(002082)
7.3.1 Profile
7.3.2 Operation
7.3.3 Revenue Structure
7.3.4 Gross Margin
7.3.5 Output and Sales Volume
7.3.6 Prospects
7.4 Shandong Nanshan Aluminum Co., Ltd. (600219)
7.4.1 Profile
7.4.2 Operation
7.4.3 Revenue Structure
7.4.4 Gross Margin
7.4.5 Capacity, Output and Sales Volume
7.4.6 Projects under Construction
7.4.7 Aluminum Rolling Business
7.4.8 Prospects
7.5 Yunnan Aluminium Co. Ltd. (000807)
7.5.1 Profile
7.5.2 Operation
7.5.3 Revenue Structure
7.5.4 Gross Margin
7.5.5 Output and Sales Volume
7.5.6 Aluminum Processing Business
7.5.7 Prospects
7.6 Guangdong HECTechnology Holding Co., Ltd (600673)
7.6.1 Profile
7.6.2 Operation
7.6.3 Revenue Structure
7.6.4 Gross Margin
7.6.5 Aluminum Rolling Business
7.6.6 Prospects
7.7 Jiangsu ALCHA Aluminium Co., Ltd. (002160)
7.7.1 Profile
7.7.2 Operation
7.7.3 Revenue Structure
7.7.4 Output and Sales Volume
7.7.5 Projects under Construction
7.7.6 Prospects
7.8 Loften Environmental Technology Co., Ltd.(002379)
7.8.1 Profile
7.8.2 Operation
7.8.3 Revenue Structure
7.9 Xinjiang Joinworld Co., Ltd. (600888)
7.9.1 Profile
7.9.2 Operation
7.9.3 Revenue Structure
7.9.4 Gross Margin
7.9.5 Aluminum Rolling Business
7.9.6 Prospects
7.10 China Zhongwang Holdings Limited(01333.HK)
7.10.1 Profile
7.10.2 Operation
7.10.3 Revenue Structure
7.10.4 Aluminum Rolling Business
7.11 Shandong Weiqiao Aluminum & Electricity Co., Ltd.
7.11.1 Profile
7.11.2 Operation
7.11.3 Revenue Structure
7.11.4 Gross Profit and Gross Margin
7.11.5 Customers and Suppliers
7.11.6 Projects under Construction
7.11.7 Capacity, Output and Sales Volume
7.11.8 Aluminum Rolling Business
7.12 Southwest Aluminium (Group) Co., Ltd
7.12.1 Profile
7.12.2 Operation
7.12.3 Aluminum Rolling Business
7.12.4 Competitive Edge
7.13 Alnan Aluminum Inc.
7.13.1 Profile
7.13.2 Operation
7.13.3 Aluminum Rolling Business
7.14 Northeast Light Alloy Co., Ltd.
7.14.1 Profile
7.14.2 Operation
7.14.3 Aluminum Rolling Business
7.15 Jiangsu Dingsheng New Energy Materials Co., Ltd.
7.15.1 Profile
7.15.2 Operation
7.15.3 Capacity
7.15.4 Projects under Construction
7.16 Jiangsu CAIFA Aluminum Co., Ltd.
7.16.1 Profile
7.16.2 Operation
7.17 Guangxi HezhouGuidong Electronic Technology Co., Ltd. (GET)
7.17.1 Profile
7.17.2 Operation
7.18 Xiashun Holdings Limited
7.18.1 Profile
7.18.2 Operation
7.19 Weifang Sanyuan Aluminum Industry Co., Ltd.
7.19.1 Profile
7.19.2 Aluminum Alloy Sheet Project
7.20 AsiaAlum Holdings Limited
7.20.1 Profile
7.20.2 Aluminum Rolling Business
8. Conclusion and Forecast
8.1 Conclusion
8.2 Forecast
Product Models for Aluminum Rolling Industry
Aluminum Rolling Production Processes and Products
Industrial Chain of Aluminum Rolled Products
Global Primary Aluminum Supply and Demand, 2009-2016
Global Primary Aluminum Supply and YoY Growth, 2008-2016
Global Primary Aluminum Supply (by Region / Country), 2015-2016
Global Primary Aluminum Demand, 2012-2016
Global Primary Aluminum Supply and Demand, 2016
Average Annual Growth Rate of Global Primary Aluminum Demand (by Region), 2015-2020E
Global Aluminum Demand, 2015-2020E
Global Three-month Primary Aluminum Prices at LME, 2009-2016
Global Aluminum Processing Demand Structure (by Application), 2015
Demand Growth Rate of Global Aluminum Processed Products (by Region / Country), 2014-2019E
China's Electrolytic Aluminum Capacity Distribution (by Province / Municipality), 2016
China's Primary Aluminum Capacity Distribution (by Region), 2010-2016
China's Primary Aluminum Operating Capacity and Operating Rate, 2014-2016
Distribution of China's Primary Aluminum Resumed Capacity, Jan-May 2016
China's Primary Aluminum Output and YoY Growth, 2010-2020E
China's Primary Aluminum Import and Export Volume, 2010-2016
China's Aluminum (by Product)Net Exports, 2010-2019E
China's Primary Aluminum Consumption and YoY Growth, 2010-2020E
Three-month Primary Aluminum Prices at Shanghai Futures Exchange, 2012-2016
Output of China's Aluminum Processed Materials, 2008-2020E
Global Aluminum Rolling Demand, 2007-2020E
Global Aluminum Rolling Consumption Structure (by Application), 2013-2020E
Average Growth Rate of Global Demand for Aluminum Rolled Products (by Application), 2015-2020E
Global Aluminum Rolling Demand (by Application), 2015 & 2020E
Global Aluminum Rolling Consumption Structure (by Region), 2012-2016
Japan's Aluminum Rolling Production and Marketing (by Product), 2014-2016
Aluminum Rolling Consumption in Western Europe, 2012-2020E
Aluminum Rolling Consumption Structure (by Application) in Europe, 2015
Supply and Demand of Aluminum Rolled Products in the Middle East, 2007-2015
Pattern of Aluminum Rolling Manufacturers in the Middle East
Development Trend of Aluminum Rolling End-users in the Middle East
Global Top 6 Aluminum Rolling Manufacturers by Market Share, 2015
Aluminum Rolling Revenue and Shipment of Global Major Aluminum Rolling Manufacturers, 2015-2016
Key Policies on Aluminum Rolling Industry in China, 2006-2016
Completed and Ongoing “1+1” Hot Rough - Finish Rolling Production Lines in China (by Enterprise), by the end of 2015
Completed “1+3” Hot Continuous Rolling Production Lines in China (by Enterprise), by the end of 2016
Completed and Ongoing”1+4” Hot Continuous Rolling Production Lines in China (by Enterprise), by the end of 2015
Ongoing Cold Rolled Aluminum Strip Projects in China, by the end of 2016
Capacity of Aluminum Sheet/Strip Products in China, 2008-2015
Output and YoY Growth of Aluminum Sheet/Strip Products in China, 2008-2016
China’s Aluminum Alloy Sheet/Strip Export Volume and YoY Growth, 2008-2016
China’s Aluminum Sheet/Strip Import Volume and YoY Growth, 2008-2016
Apparent Consumption of Aluminum Rolled Sheet/Strip in China, 2008-2016
Consumption Pattern of Aluminum Alloy Sheet/Strip in China, 2014-2020E
China's Aluminum Foil Capacity, 2008-2015
China's Aluminum Foil Output and YoY Growth, 2008-2015
Capacity of Start-up and Ongoing Aluminum Foil Projects in China, 2016
China’s Aluminum Foil Export Volume and YoY Growth, 2008-2016
China’s Aluminum Foil Import Volume and YoY Growth, 2008-2016
Apparent Consumption of Aluminum Foil in China, 2008-2016
Consumption Pattern of Aluminum Foil in China, 2014&2020E
Aluminum Rolled Product Sales Volume and Market Share of Major Aluminum Rolling Manufacturers, Mid-2015
Aluminum Rolled Product Capacity of Major Manufacturers in China, by the end of 2016
China’s Investment in Real Estate Development, 2015-2016
China’s New Housing Construction Area, 2010-2016
China’s Demand for Aluminum Sheet/Strip Used for Building Industry, 2010-2020E
Global Aluminum Packaging Market Overview, 2016
China’s Demand for Aluminum Sheet/Strip Used for Packaging, 2010-2020E
Global Capacity of Automotive Aluminum Alloy Sheet, 2010-2020E
Main Application Fields of Automotive Aluminum Alloy Sheet
F-150 Aluminum Consumption (by Component), 2015
Global Demand for Automotive Aluminum Alloy Sheet, 2010-2030E
Global Demand for Automotive Aluminum Alloy Sheet (by Region), 2012-2020E
China's Capacity of Automotive Aluminum Alloy Sheet, 2009-2020E
China's Demand for Automotive Aluminum Alloy, 2010-2020E
Capacity of Major Automotive Aluminum Alloy Sheet Manufacturers in China, 2015-2018
China's Demand for Aluminum Rolling Used for EMUs, 2015-2020E
China's Demand for Aluminum Rolled Products Used for Subways, 2016-2020E
Application of Aluminum Alloy on Aircrafts
Material Structure of Civil Aircrafts (by Model), 2016
Application of Aluminum Alloy on B747 Aircrafts
Application of Aluminum Alloy on A380 Aircrafts
Global Civil Aircraft Scale, 2015&2034E
Global Number of Newly-delivered New Aircrafts (by Model), before 2030
Global Demand for Aircraft Aluminum Sheet, 2013-2019E
Number of China’s Civilian Transport Aircrafts, 2011-2034E
China’s Demand for Aircraft Aluminum Alloy Sheet, 2015-2020E
China’s Major Aviation-use Aluminum Projects, 2016
China’s Demand for Aluminum Sheet/Strip Used for Printing Industry, 2010-2020E
Operational Indicators of Chinese Air Conditioner Market, 2006-2015
China’s Demand for Aluminum Foil Used for Air Conditioners, 2008-2017E
China’s Demand for Aluminum Foil Used for Packaging, 2010-2020E
Consumption Structure of Aluminum Foil Used for Packaging in China (by Purpose), 2016
Major Packaging Aluminum Foil Manufacturers and Their Capacity in China, 2016
Global Aluminum Electrolytic Capacitor Market Size, 2009-2016
China’s Demand for Aluminum Foil Used for Electric Power, 2008-2020E
Revenue and Net Income of Alcoa, 2010-2016
Revenue of Alcoa (by Country), 2013-2015
Revenue and After-tax Profit of Alcoa (by Business), 2011-2016Q1
Alcoa’s Rolled Aluminum Plants and Products, 2016
Global Distribution of Alcoa’s Rolled Aluminum Business
Alcoa’s Rolled Aluminum Operations, 2011-2016Q1
Gross Margin of Alcoa’s Rolled Aluminum
Revenue Structure of Alcoa’s Rolled Aluminum (by Application), 2013&2016E
Alcoa’s Revenue from Aluminum Alloy Automotive Sheet, 2013-2020E
Alcoa’s Major Aluminum Alloy Automotive Sheet Clients and Their Products
Alcoa’s Plants and Businesses in China, 2016
Alcoa’s Revenue in China, 2009-2016
Operation of ARCONIC, 2016Q1
Development History of Constellium
Major Production Bases of Constellium
Revenue of Constellium, 2010-2016
Shipments and Revenue of Constellium (by Business), 2014-2015
Revenue (by Region) and % of Total Revenue of Constellium, 2013-2015
Constellium’s Automotive Solutions
Rolled Aluminum Revenue (by Product) and % of Total Revenue of Constellium, 2013-2015
Shipments of Constellium’s Rolled Aluminum (by Product), 2014-2015
Constellium’s Production Bases in China
Revenue and Net Income of Norsk Hydro, 2009-2015
Businesses of Norsk Hydro
Revenue of Norsk Hydro (by Business), 2014-2016Q1
Revenue Structure of Norsk Hydro (by Region), 2015
Output of Main Products of Norsk Hydro, 2011-2015
Rolled Aluminum Revenue and Profit of Norsk Hydro, 2010-2016
Sales Volume of Norsk Hydro’s Rolled Products (by Application), 2011-2016Q1
External Sales of Norsk Hydro’s Rolled Products (by Production Base), 2011-2015
Structure of Norsk Hydro’s Rolled Aluminum Business by Field, 2015
Norsk Hydro’s Major Rolled Aluminum Production Bases and Capacity, 2016
Norsk Hydro’s On-going Rolled Aluminum Products Projects, 2016
Norsk Hydro’s Plants in China, 2016
Aleris’ Production Bases Worldwide
Revenue and Net Income of Aleris, 2010-2015
Revenue of Aleris (by Region), 2013-2016Q1
Revenue Structure of Aleris (by Application), 2015
Major Competitors of Aleris (by Region)
Aleris’ Lewisport ABS Expansion Project
Aleris’ Major Aluminum Alloy Automotive Sheet Customers and Competitors
Global Presence of Novelis
Distribution of Novelis’ Major Production Bases
Revenue and Net Income of Novelis, FY2010-FY2016
Shipments of Novelis’ Rolled Aluminum Products (by Region), FY2013-FY2016
Shipments of Novelis’ Rolled Aluminum Products (by Business), FY2012-FY2016 Novelis’ Aluminum Alloy Automotive Sheet Production Bases and Major Clients, 2016
Novelis’ Global Automotive Aluminum Sheet Capacity, 2016
Revenue and Net Income of Kobe Steel, FY 2009-FY 2015
Revenue of Kobe Steel (by Business), FY2013-FY2015
Main Aluminum & Copper Products and Application of Kobe Steel
Rolled Aluminum Products Sales Volume (by Region) of Kobe Steel, FY2014-FY2015
Kobe Steel’s Aluminum & Copper Production Bases in China, 2016
Development History of UACJ
Businesses and Products of UACJ
Capacity of UACJ Rayong Works, FY2014-FY2020
Major Economic Indicators of UACJ, FY2013-FY2015
Revenue of UACJ (by Business), FY2013-FY2015
UACJ’s Medium-term Goal (2015-2017)
Rolled Aluminum Sales Volume (by Product) of UACJ, FY2014-FY2015
Development of Automotive Heat Transfer Material Business of UACJ
UACJ’s Plants in China, 2016
UACJ’s Global Supply Network for Automotive Heat Exchanger Materials
Global Network of AMAG
Business Structure of AMAG
Major Economic Indicators of AMAG, 2012-2015
Shipments and Revenue of AMAG by Business, 2015
Shipments of AMGA by Business, 2015Q1-2016Q1
Revenue of AMAG by Place of Origin, 2015
Rolled Aluminum Capacity of AMAG, 1995-2020E
Rolled Aluminum Product Business Indicators of AMAG, 2014-2015
Rolled Aluminum Product Business Indicators of AMAG, 2015Q1-2016Q1
AMAG’s Planning for 2020
Revenue and Net Income of Aluminum Corporation, 2013-2016E
Operating Revenue of Aluminum Corporation by Business, 2013-2016Q1
Output of Aluminum Corporation by Product, 2011-2016Q1
Distribution of Rolled Aluminum Subsidiaries under Aluminum Corporation, 2016
Aluminum Sheet/Strip/Foil Product Capacity of Henan Mingtai Al. Industrial, 2016
Revenue and Net Income of Henan Mingtai Al. Industrial, 2008-2016Q1
Operating Revenue of Henan Mingtai Al. Industrial by Product, 2008-2015
Operating Revenue of Henan Mingtai Al. Industrial by Region, 2008-2015
Gross Margin of Henan Mingtai Al. Industrial by Product, 2008-2015
Output, Sales Volume, Inventory and Sales-Output Ratio of Henan Mingtai Al. Industrial by Product, 2011-2015
Projects under Construction of Henan Mingtai Al. Industrial, 2016
High-Precision Transportation-use Aluminum Sheet / Strip Projects, Products and Solutions of Mingtai Al. Industrial
Main Product Segments and Capacity of 20,000 tons/a Transportation-use Aluminum Profile Project of Mingtai Al. Industrial
Revenue and Net Income of Henan Mingtai Al. Industrial, 2015-2020E
Revenue and Net Income of Zhejiang Dongliang New Material, 2008-2016
Operating Revenue of Zhejiang Dongliang New Material by Product, 2009-2015
Operating Revenue of Zhejiang Dongliang New Material by Region, 2009-2015
Gross Margin of Zhejiang Dongliang New Material by Product, 2009-2015
Aluminum Profile / Sheet Output, Sales Volume and Inventory of Dongliang New Material, 2011-2015
Revenue and Net Income of Zhejiang Dongliang New Material, 2015-2020E
Revenue and Net Income of Shandong Nanshan Aluminum, 2008-2016Q1
Operating Revenue Structure of Shandong Nanshan Aluminum by Product, 2014-2016Q1
Operating Revenue of Shandong Nanshan Aluminum by Region, 2009-2015
Gross Margin of Shandong Nanshan Aluminum by Product, 2008-2015
Capacity of Shandong Nanshan Aluminum by Product, 2012-2015
Capacity, Output, and Sales Volume of Nanshan Aluminum by Product, 2014-2016Q1
Main Projects under Construction of Shandong Nanshan Aluminum, 2016
Revenue and Net Income of Shandong Nanshan Aluminum, 2015-2020E
Revenue and Net Income of Yunnan Aluminum, 2008-2016Q1
Operating Revenue of Yunnan Aluminum by Product, 2008-2015
Operating Revenue of Yunnan Aluminum by Region, 2008-2015
Gross Margin of Yunnan Aluminum by Product, 2008-2015
Capacity, Output and Sales Volume of Yunnan Aluminum by Product, 2010-2015
Main Projects under Construction of Yunnan Aluminum, 2016
Revenue and Net Income of Yunnan Aluminum, 2015-2020E
Revenue and Net Income of Guangdong Dongyangguang Aluminum, 2009-2016Q1
Operating Revenue of Guangdong Dongyangguang Aluminum by Product, 2010-2015
Operating Revenue of Guangdong Dongyangguang Aluminum by Region, 2009-2015
Gross Margin of Guangdong Dongyangguang Aluminum by Product, 2010-2015
Capacity, Output and Sales Volume of Aluminum Processing Business of Guangdong Dongyangguang Aluminum by Product, 2011-2015
Aluminum Foil Product Projects under Construction of Guangdong Dongyangguang Aluminum, 2016
Revenue and Net Income of Guangdong Dongyangguang Aluminum, 2015-2020E
Revenue and Net Income of Jiangsu ALCHA Aluminum, 2008-2016E
Operating Revenue of Jiangsu ALCHA Aluminum by Product, 2008-2015
Operating Revenue of Jiangsu ALCHA Aluminum by Region, 2008-2015
Projects under Construction of Jiangsu ALCHA Aluminum, 2016
Revenue and Net Income of Jiangsu ALCHA Aluminum, 2015-2020E
Revenue and Net Income of Loften Environmental Technology, 2008-2016E
Major Rolled Aluminum Projects of Loften Environmental Technology, 2016
Operating Revenue Structure of Loften Environmental Technology by Product, 2014-2015
Operating Revenue of Loften Environmental Technology by Region, 2014-2015
Revenue and Net Income of Xinjiang Joinworld, 2008-2016E
Operating Revenue of Xinjiang Joinworld by Product, 2010-2015
Operating Revenue of Xinjiang Joinworld by Region, 2008-2015
Gross Margin of Xinjiang Joinworld by Product, 2010-2015
High-purity Aluminum and Rolled Aluminum Output, Sales Volume, and Inventory of Xinjiang Joinworld by Product, 2014-2015
Revenue and Net Income of Xinjiang Joinworld, 2015-2020E
Revenue and Net Income of Zhongwang, 2008-2016E
Capacity and Output of Aluminum Profile Products of Zhongwang, 2010-2015
Revenue, Sales Volume, and Unit Price of Zhongwang by Business, 2014-2016Q1
Zhongwang’s Revenue and Percentage by Region, 2012-2015
Aluminum Sheet/Strip/Foil Capacity of Zhongwang Holdings, 2016-2019E
Revenue and Net Income of Weiqiao Aluminum & Electricity, 2009-2016E
Revenue and Structure of Weiqiao Aluminum & Electricity by Product, 2013-2016Q1
Revenue Structure of Weiqiao Aluminum & Electricity by Region, 2011-2016Q1
Gross Profit of Weiqiao Aluminum & Electricity by Product, 2009-2016Q1
Gross Margin of Weiqiao Aluminum & Electricity by Product, 2009-2016Q1
Top 5 Aluminum Sheet Material Suppliers and Procurement from First-ranked Supplier of Weiqiao Aluminum & Electricity, 2011-2016Q1
Top 5 Liquid Aluminum Alloy Customers and Revenue Contribution of First-ranked Customer of Weiqiao Aluminum & Electricity, 2011-2016Q1
Ongoing and Planned Projects of Weiqiao Aluminum & Electricity, 2016
Capacity of Weiqiao Aluminum & Electricity by Product, by 2014&2016Q1
Aluminum Product Output of Weiqiao Aluminum & Electricity by Product, 2011-2016Q1
Sales Volume and Sales-Output Ratio of Weiqiao Aluminum & Electricity by Product, 2010-2016Q1
Sales Price of Shandong Weiqiao Aluminum & Electricity by Product, 2011-2016Q1
Revenue and Net Income of Southwest Aluminum, 2012-2016E
Output of Southwest Aluminum, 2011-2015
Output Structure of Southwest Aluminum by Product, 2015
Major Product Capacity of Northeast Light Alloy, 2015
Major Product Applications and Clients of Northeast Light Alloy
Subordinate Companies of Northeast Light Alloy and Their Businesses
Revenue and Total Profit of Northeast Light Alloy, 2009-2016
Aluminum Alloy Sheet/Strip Projects of Northeast Light Alloy
Revenue of DingSheng New Energy Materials, 2014-2015
Aluminum Sheet/Strip Sales Volume of DingSheng New Energy Materials, 2013-2015
Aluminum Sheet/Strip/Foil Production Lines and Product Capacity of Dingsheng New Energy Materials Zhenjiang Base as of March 2016
Aluminum Subsidiaries under DingSheng New Energy Materials and Capacity Distribution, 2016
Ongoing and Planned Projects of Zhenjiang Dingsheng Aluminum Industries, 2016
Revenue and Net Income of Caifa Aluminum, 2011-2015
Revenue and YoY Growth of Guidong Electronic, 2008-2015
Aluminum Foil Output and YoY Growth of Guidong Electronic, 2012-2015
Purchase Amount and Price of Aluminum Foil Raw Materials of Guidong Electronic, 2013-2014
Revenue of Xiashun Holdings, 2013-2015
Revenue Structure of Xiashun Holdings by Product, 2014-2015
Key Aluminum Alloy Automotive Sheet Projects of Sanyuan Aluminum Industry
Revenue and Rolled Aluminum Revenue of Major Global and Chinese Rolled Aluminum Manufacturers, 2015-2016E
Rolled Aluminum Capacity, Sales Volume, and Revenue of 25 Global and Chinese Rolled Aluminum Manufacturers, 2015-2016
Trend in Supply and Demand of Aluminum Sheet/Strip in China, 2016-2020E
Trend in Supply and Demand of Aluminum Foil Worldwide, 2016-2020E
Global and China Optical Fiber Preform Industry Report, 2021-2026
Optical fiber preforms play a key role in the optical fiber communication industry chain. The global construction of 4G and FTTH requires less optical fiber and cable, which has dragged down the deman...
Global and China Photoresist Industry Report, 2021-2026
Since its invention in 1959, photoresist has been the most crucial process material for the semiconductor industry. Photoresist was improved as a key material used in the manufacturing process of prin...
Global and China Needle Coke Industry Report, 2021-2026
Needle coke is an important carbon material, featuring a low thermal expansion coefficient, a low electrical resistivity, and strong thermal shock resistance and oxidation resistance. It is suitable f...
Global and China 3D Glass Industry Report, 2021-2026
3D curved glass is light and thin, transparent and clean, anti-fingerprint, anti-glare, hard and scratch-resistant, and performs well in weather resistance. It is applicable to terminals such as high-...
Global and China Graphene Industry Report, 2020-2026
Graphene, a kind of 2D carbon nanomaterial, features excellent properties such as mechanical property and super electrical conductivity and thermal conductivity. Its downstream application ranges from...
Global and China Optical Fiber Preform Industry Report, 2020-2026
Optical fiber preform as a hi-tech product and a crucial link in the optical fiber industry chain contributes to 70% or so of profit margin. Global 4G and FTTH construction at dusk leads to the shrink...
Global and China 3D Glass Industry Report, 2020-2026
Global 3D glass market has been enlarging over the recent years amid demetallization of smartphone back covers and popularity of smart wearables, to approximately $2.86 billion in 2019 and to an estim...
Global and China Photoresist Industry Report, 2020-2026
In 2019, global photoresist market was valued at $8.3 billion, growing at a compound annual rate of 5.1% or so since 2010, and it will outnumber $12.7 billion in 2026 with advances in electronic techn...
Global and China Synthetic Diamond Industry Report, 2020-2026
While its mechanical property is given full play in fields like grinding and cutting, diamond with acoustic, optical, magnetic, thermal and other special properties, as superconducting material, intel...
Global and China Needle Coke Industry Report, 2020-2026
With the merits like small resistivity, excellent resistance to impact and good anti-oxidation property, needle coke has been widely used in ultra-high power graphite electrodes, nuclear reactor decel...
Global and China Optical Fiber Preform Industry Report, 2019-2025
Optical fiber preform, playing an important role in the optical fiber and cable industry chain, seizes about 70% profits of optical fiber. Global demand for optical fiber preform stood at 16.2kt in 20...
China Silicon Carbide Industry Report, 2019-2025
Silicon carbide (SiC) is the most mature and the most widely used among third-generation wide band gap semiconductor materials. Over the past two years, global SiC market capacity, however, hovered ar...
Global and China Photoresist Industry Report, 2019-2025
Photoresist, a sort of material indispensable to PCB, flat panel display, optoelectronic devices, among others, keeps expanding in market size amid the robust demand from downstream sectors. In 2018, ...
Global and China Graphene Industry Report, 2019-2025
Graphene is featured with excellent performance and enjoys a rosy prospect. The global graphene market was worth more than $100 million in 2018, with an anticipated CAGR of virtually 45% between 2019 ...
Global and China 3D Glass Industry Chain Report, 2019-2025
The evolution of AMOLED conduces to the steady development of 3D curved glass market. In 2018, the global 3D glass market expanded 37.7% on an annualized basis and reached $1.9 billion, a figure proje...
China Wood Flooring Industry Report, 2019-2025
With the better standard of living and the people’s desire for an elegant life, wood flooring sees a rising share in the flooring industry of China, up from 33.9% in 2009 to 38.9% in 2018, just behind...
Global and China Photovoltaic Glass Industry Report, 2019-2025
In China, PV installed capacity has ramped up since the issuance of photovoltaic (PV) subsidy policies, reaching 53GW in 2017, or over 50% of global total. However, the domestic PV demand was hit by t...
Global and China ITO Targets Industry Chain Report, 2019-2025
Featured by good electrical conductivity and transparency, ITO targets are widely applied to fields of LCD, flat-panel display, plasma display, touch screen, electronic paper, OLED, solar cell, antist...