Global and China Optical Fiber Preform Industry Report, 2016-2020
-
Aug.2016
- Hard Copy
- USD
$2,600
-
- Pages:134
- Single User License
(PDF Unprintable)
- USD
$2,450
-
- Code:
- Enterprise-wide License
(PDF Printable & Editable)
- USD
$3,800
-
- Hard Copy + Single User License
- USD
$2,800
-
With large-scale deployment of gigabit network, global demand for optical fiber and cable grows significantly. Staying at the peak of the pyramid of the optical fibre and cable industry, the optical fibre preform industry witnesses rapid development, with global demand reaching 11,017 tons in 2015, up 21.6% from a year ago, and expected to attain 21,000 tons in 2020.
China is the world’s largest consumer of optical fibre preform, needing 6,167 tons in 2015, 56.0% of the world’s total, followed by the United States (12.7%) and Japan (8.2%).
Promoted by the implementation of “Broadband China”, “Internet +” and “Full Fiber-optic Network” strategies, the Chinese optical fibre preform market demand will maintain a growth rate of around 16.8% during 2016-2020, hitting 13,600 tons in 2020 (64.7% of global demand).
The Chinese optical fiber preform market is still plagued by supply shortage with a narrowing gap from 1,949 tons in 2010 to 567 tons in 2015. As local production capacity in China is continuously boosted, optical fiber preform is expected to be completely self-sufficient from 2017 onward.
Global and Chinese optical fiber preform markets are highly concentrated. In 2015, top5 suppliers (YOFC, Corning, Pysmian, Shin-Etsu Chemical, and Hengtong Optic-electric) held a combined global share of 61.3% (by output). Chinese YOFC shared the most 16.4%, followed by U.S. Corning.
Competitive Landscape of Global Optical Fiber Preform Market, 2015
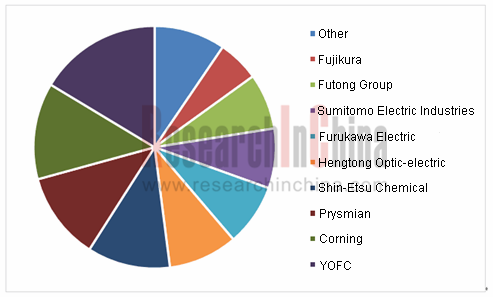
Source: ResearchInChina
Attracted by good development prospects in the Chinese optical communication market, global companies have scaled up their investment in China to expand capacity. In 2016, several major Chinese enterprises have been aggressive in building new plants to raise optical fiber preform and optical fiber drawing tower capacities.
YOFC: the world’s largest supplier of optical fiber preform. In 2016, the company is building Qianjiang Science Park, with Phase I (1,000 t/a optical fiber preform and 10 million core km/a optical fiber) planned to go into production at the end of the year. When Phase II and Phase III are completed and put into operation, the Park will develop production capacity of 3,000 ton/a optical fiber preform and 25 million core km/a optical fiber, becoming the largest optical fiber preform production base in the world.
Shin-Etsu Chemical: First optical fiber preform plant (a joint venture with Fasten Group and other companies) in China went into production in Feb 2012; the second optical fiber preform plant in Hubei (a joint venture with YOFC) is being built and expected to go into operation at the end of 2016 when the company’s optical fiber preform capacity in China will total 690 ton/a.
Hengtong Optic-electric: Optical fiber preform business restructuring is scheduled to be carried out in 2016. The company announced in March that it would invest RMB500 millionof its own funds to set up a wholly-owned subsidiary- Hengtong Photoconductive New Materials with a planned optical fiber preform capacity of 1,500 ton/a.
Global and China Optical Fiber Preform Industry Report, 2016-2020 by ResearchInChina focuses on the followings:
 Global optical fiber preform market (supply & demand, geographical distribution, price, competitive landscape, etc.);
Chinese optical fiber preform market (policy environment, market supply & demand, import & export, competitive landscape, price trend, etc.);
Global and China optical fiber preform downstream sector (optical fiber and cable) (market development, market structure, etc.);
Seven global optical fiber preform enterprises (operation, development in China, etc.);
Six Chinese optical fiber preform enterprises (operation, optical fiber preform business, development, etc.)
Optical fiber preform market trends during 2016-2020.
1 Overview of Optical Fiber Preform
1.1 Definition
1.2 Production Technology
1.3 Industry Chain
1.3.1 Upstream
1.3.2 Downstream
2 Global Optical Fiber Preform Industry
2.1 Status Quo
2.2 Supply & Demand
2.2.1 Supply
2.2.2 Demand
2.3 Regional Structure
2.3.1 USA
2.3.2 Japan
2.3.3 Europe
2.4 Price Trend
2.5 Competitive Landscape
3 Optical Fiber Preform Industry in China
3.1 Policy Environment
3.2 Development History
3.3 Supply & Demand
3.3.1 Supply
3.3.2 Demand
3.4 Import & Export
3.4.1 Import
3.4.2 Export
3.5 Price Trend
3.5.1 Raw Materials
3.5.2 Optical Fiber Preform
3.6 Competitive Landscape
4 Global and Chinese Optical Fiber & Cable Market
4.1 Global
4.1.1 Market Development
4.1.2 Regional Structure
4.2 China
4.2.1 Market Development
4.2.2 Price
4.2.3 Competitive Landscape
5 Major Global Optical Fiber Preform Companies
5.1 Corning
5.1.1 Profile
5.1.2 Operation
5.1.3 Revenue Structure
5.1.4 R&D and Investment
5.1.5 Optical Fiber Preform Business
5.1.6 Development in China
5.1.7 Corning Optical Fiber Cable Chengdu Co. Ltd.
5.2 Sumitomo Electric Industries
5.2.1 Profile
5.2.2 Operation
5.2.3 Optical Fiber Preform Business
5.2.4 Development in China
5.2.5 Chengdu SEI Optical Fiber
5.3 Shin-Etsu Chemical
5.3.1 Profile
5.3.2 Operation
5.3.3 Revenue Structure
5.3.4 Optical Fiber Preform Business
5.3.5 Development in China
5.4 Fujikura
5.4.1 Profile
5.4.2 Operation
5.4.3 Revenue Structure
5.4.4 Optical Fiber Preform Business
5.4.5 Development in China
5.4.6 Fujikura FiberHomeOpto-Electronic Material Technology
5.5 Prysmian
5.5.1 Profile
5.5.2 Operation
5.5.3 Revenue Structure
5.5.4 Optical Fiber Preform Business
5.5.5 Development in China
5.6 Furukawa Electric
5.6.1 Profile
5.6.2 Operation
5.6.3 Revenue Structure
5.6.4 Optical Fiber Preform Business
5.6.5 Development in China
5.7 TwentscheKabel Holding (TKH)
5.7.1 Profile
5.7.2 Operation
5.7.3 Revenue Structure
5.7.4 Optical Fiber Preform Business
5.7.5 Development in China
5.7.6 Twentsche (Nanjing) Fibre Optics
6 Major Chinese Optical Fiber Preform Companies
6.1 YOFC
6.1.1 Profile
6.1.2 Operation
6.1.3 Revenue Structure
6.1.4 Gross Margin
6.1.5 Optical Fiber Preform Business
6.2 Hengtong Optic-electric
6.2.1 Profile
6.2.2 Operation
6.2.3 Revenue Structure
6.2.4 Gross Margin
6.2.5 R&D
6.2.6 Optical Fiber Preform Business
6.3 Jiangsu Zhongtian Technology (ZTT)
6.3.1 Profile
6.3.2 Operation
6.3.3 Revenue Structure
6.3.4 Gross Margin
6.3.5 R&D and Investment
6.3.6 Optical Fiber Preform Business
6.4 FiberHome Technologies
6.4.1 Profile
6.4.2 Operation
6.4.3 Revenue Structure
6.4.4 Gross Margin
6.4.5 R&D and Investment
6.4.6 Optical Fiber Preform Business
6.5 Futong Group
6.5.1 Profile
6.5.2 Operation
6.5.3 Revenue Structure
6.5.4 Gross Margin
6.5.5 Projects under Construction
6.5.6 Optical Fiber Preform Business
6.6 Potevio Fasten Optical Communication
6.6.1 Profile
6.6.2 Operation
6.6.3 Optical Fiber Preform Business
7 Summary and Forecast
7.1 Enterprise
7.2 Market
Optical Fiber Preform Mandrel and Cladding Diagram
Manufacturing Process Comparison of Optical Fiber Preform Mandrel
Optical Fiber Preform Mandrel Process Distribution Proportion, 2015
Manufacturing Process Comparison of Optical Fiber Preform Mandrel in China
Cost Structure of Optical Fiber Preform in China, 2014-2015
Downstream Industrial Chain of Optical Fiber Preform
Global Capacity and Output of Optical Fiber Preform, 2010-2020E
Global Demand for Optical Fiber Preform, 2010-2020E
Global Optical Fiber Preform Capacity and Market Share (by Country/Region), 2010-2015
Global Demand for Optical Fiber Preform (by Country/Region), 2010-2015
Optical Fiber Preform Capacity, Output and Demand in the United States, 2010-2015
Optical Fiber Preform Export in the United States
Optical Fiber Preform Capacity, Output and Demand in Japan, 2010-2015
Optical Fiber Preform Export in Japan, 2010-2015
Price of Optical Fiber Preform Worldwide, 2000-2016
Policies on Optical Fiber Preform Industry in China, 2010-2016
Anti-dumping Results of Optical Fiber Preform in China, 2015
Development History of Optical Fiber Preform in China
Optical Fiber Preform Output and YoY Growth in China, 2007-2016
Key Optical Fiber Preform Projects Planned and under Construction in China, 2016
Optical Fiber Preform Demand and YoY Growth in China
Optical Fiber Preform Self-sufficiency in China, 2007-2016
Optical Fiber Preform Import Volume and YoY Growth in China, 2010-2016
Structure of China’s Optical Fiber Preform Import Volume (by Country), 2013-2015
Optical Fiber Preform Import Value and YoY Growth in China, 2010-2016
Optical Fiber Preform Export Volume and YoY Growth in China, 2010-2016
Structure of China’s Optical Fiber Preform Export Volume (by Country)
Optical Fiber Preform Export Value and YoY Growth in China, 2010-2016
Price Trend of Germanium in China, 2015-2016
Average Price of Optical Fiber Preform in China, 2010-2016
Shareholding Structure and Technologies Applied of Main Optical Fiber Preform Manufacturers in China
Optical Fiber Preform Capacity and Output of Key Optical Fiber Preform Manufacturers in China, 2013-2016
Global Demand for Optical Fiber and Optical Cable (by Country/Region), 2005-2015
Demand for Optical Fiber and Cable from World’s Major Three Regions, 2010-2018E
Optical Cable Export Value and YoY Growth in the United States
Consumption of Optical Fiber and Cable in India, 2013-2016
Demand for Optical Fiber and Cable in France, 2013-2016
Optical Fiber and Cable Demand and YoY Growth in China, 2011-2020E
Price Trend of Optical Fiber in China
Market Share of Optical Fiber Enterprises in China, 2015
Optical Fiber and Optical Cable Capacity of Top 6 Enterprises in China, 2015
Revenue and Net Income of Corning, 2009-2016
Revenue Breakdown and Structure of Corning (by Product), 2013-2016
Revenue Breakdown and Structure of Corning (by Country/Region), 2010-2015
R&D Costs and % of Total Revenue of Corning, 2009-2015
Revenue Breakdown (by Product) of Corning’s Telecom Business Segment, 2011-2015
Corning’s Revenue in China and As a Percentage of Total, 2009-2015
Revenue and Net Income of Sumitomo Electric, FY2008-FY2015
Revenue Breakdown (by Business) of Sumitomo Electric, FY2008-2015
Revenue Breakdown (by Region) of Sumitomo Electric, FY2008-2015
Sumitomo Electric’s Revenue from Information and Communication Business, FY2013-FY2015
Sumitomo Electric’s Revenue in China, FY2011-FY2015
Revenue of Chengdu SEI Optical Fiber Co., Ltd., 2009-2015
Products of Shin-Etsu Chemical (by Division), 2015
Distribution of Shin-Etsu Chemical’s Plants (by Business Division/by Region), 2016
Revenue and Net Income of Shin-Etsu Chemical, FY2011-FY2016
Global Investments of Shin-Etsu Chemical, 2015
Revenue Structure of Shin-Etsu Chemical
Revenue Breakdown and Structure of Shin-Etsu Chemical (by Region), FY2013-FY2016
Revenue and Operating Income of Shin-Etsu Chemical’s Electronic and Functional Materials Division, FY2010-FY2016
Shin-Etsu Chemical’s Revenue in China and As a Percentage of Total, FY2012-FY2016
Profile of Joint Ventures Newly Established by Shin-Etsu Chemical, 2015
Revenue and Net Income of Fujikura, FY2009-FY2015
Revenue Breakdown and Structure of Fujikura (by Business), FY2012-FY2015
Revenue Breakdown and Structure of Fujikura (by Region), FY2012-FY2015
Fujikura’s Power & Telecommunications Revenue (by Business), FY2014-FY2016
Fujikura’s Revenue in China, FY2011-FY2015
Revenue and Net Income of Fujikura FiberHomeOpto-Electronic Material Technology, 2011-2015
Equity Structure of Prysmian, 2015
Global Presence of Prysmian
Business Pattern of Prysmian
Revenue and Net Income of Prysmian, 2007-2016
Distribution of Prysmian’s R&D Centers Worldwide, by the End of 2015
Revenue Structure of Prysmian (by Business), 2012-2015
Revenue Structure of Prysmian (by Business), 2015
Revenue Structure of Prysmian (by Region), 2015
Telecom Business Structure and Key Clients of Prysmian
Distribution of Prysmian’s Subsidiaries in China, by the End of 2015
Layout of Prysmian in China
Global Presence of Furukawa Electric
Business Planning of Furukawa Electric, 2020E
Furukawa Electric’s Planning for Its Global Layout, 2020E
Net Revenue and Operating Income of Furukawa Electric, FY2007-FY2016
Net Revenue Structure (by Business) of Furukawa Electric, FY2016
Telecom Business Revenue and Operating Income of Furukawa Electric, FY2010-FY2016
Telecom Business (By Product) Revenue Breakdown and Structure of Furukawa Electric, FY2012-FY2016
Application of Optical Fiber and Optical Cable Products of Furukawa Electric
Main Optical Fiber Production Bases and Projects under Construction of Furukawa Electric, 2016
Main Optical Cable Production Bases and Projects under Construction of Furukawa Electric, 2016
Global Presence of TKH
Revenue and Net Income of TKH, 2009-2016
Revenue Structure (by Business) of TKH, 2012-2016
Revenue Structure (by Region) of TKH, 2012-2015
Revenue Structure and Business Model (by Business) of TKH’s Telecom Divison, 2015
Distribution of TKH’s Subsidiaries in China, by the End of 2015
Equity Structure of YOFC, 2015
Business Structure of YOFC
Revenue and Net Income of YOFC, 2007-2015
Revenue Structure (by Product) of YOFC, 2011-2015
Operating Revenue (by Region) of YOFC, 2011-2015
Gross Margin (by Product) of YOFC, 2011-2015
Key Suppliers of Raw Materials for YOFC
Optical Fiber Preform Output and Growth Rate of YOFC, 2006-2015
Global Marketing Network of Hengtong Optic-Electric
Revenue and Net Income of Hengtong Optic-Electric, 2008-2016
Output, Sales Volume and Sales-Output Ratio of Hengtong Optic-Electric (by Product), 2012-2015
Revenue Breakdown (by Product) of Hengtong Optic-Electric, 2015
Revenue Breakdown (by Region) of Hengtong Optic-Electric, 2009-2015
Gross Margin of Communication Products of Hengtong Optic-Electric, 2011-2015
R&D Costs and % of Total Revenue of Hengtong Optic-Electric, 2009-2015
Optical Fiber Preform Capacity of Hengtong Optic-Electric, 2010-2015
Optical Fiber Preform Output and Sales Volume of Hengtong Optic-Electric, 2010-2015
Optical Fiber Preform Procurement and Self-Supply Quantity of Hengtong Optic-Electric, 2013-2015
Equity Structure of ZTT, 2015
Revenue and Net Income of ZTT, 2009-2016
Revenue Breakdown (by Product) of ZTT, 2009-2015
Revenue Breakdown (by Region) of ZTT, 2008-2015
Gross Margin (by Product) of ZTT, 2008-2015
R&D Costs and % of Total Revenue of ZTT, 2009-2015
Optical Fiber Preform Output of ZTT, 2010-2015
Equity Structure of FiberHome Technologies, 2015
Revenue and Net Income of FiberHome Technologies, 2008-2016
Revenue Breakdown (by Product) of FiberHome Technologies, 2008-2015
Revenue Breakdown (by Region) of FiberHome Technologies, 2008-2015
Gross Margin (by Product) of FiberHome Technologies, 2008-2015
R&D Costs and % of Total Revenue of FiberHome Technologies, 2011-2015
Net Income of Main Optical Fiber Preform Manufacturing Companies of FiberHome Technologies, 2015
Optical Fiber Preform Output of FiberHome Technologies, 2010-2015
Equity Structure of Futong Group, 2015
Distribution of Futong Group’s Production Bases
Revenue and Net Income of Futong Group, 2009-2016
Global Marketing Network of Futong Group
Revenue Breakdown (by Business) of Futong Group, 2010-2015
Gross Margin (by Business) of Futong Group, 2009-2015
Key Projects under Construction of Futong Group, 2016
Optical Fiber Preform Production Bases of Futong Group
Optical Fiber Preform Capacity and Output of Futong Group, 2009-2016
Self-use and Sales Ratios of Optical Fiber Preform Products of Futong Group, 2013-2016
Average Price of Optical Fiber Preform of Futong Group, 2011-2015
Futong Group’s Optical Fiber Preform Procurement from Top 5 Suppliers and % of Total Procurement, 2013-2016Q1
Equity Structure of Potevio Fasten Optical Communication, 2015
Revenue and Net Income of Potevio Fasten Optical Communication, 2013-2016
Optical Fiber Preform Capacity and Output of Potevio Fasten Optical Communication,2006-2015
Competitive Landscape of Global Optical Fiber Preform Market, 2015
Competition Pattern of Optical Fiber Preform Enterprises in China, 2015-2016
Operation of Key Optical Fiber Preform Manufacturers in China, 2015
Optical Fiber Preform Output and Demand in China, 2016-2020E
Global and China Optical Fiber Preform Industry Report, 2021-2026
Optical fiber preforms play a key role in the optical fiber communication industry chain. The global construction of 4G and FTTH requires less optical fiber and cable, which has dragged down the deman...
Global and China Photoresist Industry Report, 2021-2026
Since its invention in 1959, photoresist has been the most crucial process material for the semiconductor industry. Photoresist was improved as a key material used in the manufacturing process of prin...
Global and China Needle Coke Industry Report, 2021-2026
Needle coke is an important carbon material, featuring a low thermal expansion coefficient, a low electrical resistivity, and strong thermal shock resistance and oxidation resistance. It is suitable f...
Global and China 3D Glass Industry Report, 2021-2026
3D curved glass is light and thin, transparent and clean, anti-fingerprint, anti-glare, hard and scratch-resistant, and performs well in weather resistance. It is applicable to terminals such as high-...
Global and China Graphene Industry Report, 2020-2026
Graphene, a kind of 2D carbon nanomaterial, features excellent properties such as mechanical property and super electrical conductivity and thermal conductivity. Its downstream application ranges from...
Global and China Optical Fiber Preform Industry Report, 2020-2026
Optical fiber preform as a hi-tech product and a crucial link in the optical fiber industry chain contributes to 70% or so of profit margin. Global 4G and FTTH construction at dusk leads to the shrink...
Global and China 3D Glass Industry Report, 2020-2026
Global 3D glass market has been enlarging over the recent years amid demetallization of smartphone back covers and popularity of smart wearables, to approximately $2.86 billion in 2019 and to an estim...
Global and China Photoresist Industry Report, 2020-2026
In 2019, global photoresist market was valued at $8.3 billion, growing at a compound annual rate of 5.1% or so since 2010, and it will outnumber $12.7 billion in 2026 with advances in electronic techn...
Global and China Synthetic Diamond Industry Report, 2020-2026
While its mechanical property is given full play in fields like grinding and cutting, diamond with acoustic, optical, magnetic, thermal and other special properties, as superconducting material, intel...
Global and China Needle Coke Industry Report, 2020-2026
With the merits like small resistivity, excellent resistance to impact and good anti-oxidation property, needle coke has been widely used in ultra-high power graphite electrodes, nuclear reactor decel...
Global and China Optical Fiber Preform Industry Report, 2019-2025
Optical fiber preform, playing an important role in the optical fiber and cable industry chain, seizes about 70% profits of optical fiber. Global demand for optical fiber preform stood at 16.2kt in 20...
China Silicon Carbide Industry Report, 2019-2025
Silicon carbide (SiC) is the most mature and the most widely used among third-generation wide band gap semiconductor materials. Over the past two years, global SiC market capacity, however, hovered ar...
Global and China Photoresist Industry Report, 2019-2025
Photoresist, a sort of material indispensable to PCB, flat panel display, optoelectronic devices, among others, keeps expanding in market size amid the robust demand from downstream sectors. In 2018, ...
Global and China Graphene Industry Report, 2019-2025
Graphene is featured with excellent performance and enjoys a rosy prospect. The global graphene market was worth more than $100 million in 2018, with an anticipated CAGR of virtually 45% between 2019 ...
Global and China 3D Glass Industry Chain Report, 2019-2025
The evolution of AMOLED conduces to the steady development of 3D curved glass market. In 2018, the global 3D glass market expanded 37.7% on an annualized basis and reached $1.9 billion, a figure proje...
China Wood Flooring Industry Report, 2019-2025
With the better standard of living and the people’s desire for an elegant life, wood flooring sees a rising share in the flooring industry of China, up from 33.9% in 2009 to 38.9% in 2018, just behind...
Global and China Photovoltaic Glass Industry Report, 2019-2025
In China, PV installed capacity has ramped up since the issuance of photovoltaic (PV) subsidy policies, reaching 53GW in 2017, or over 50% of global total. However, the domestic PV demand was hit by t...
Global and China ITO Targets Industry Chain Report, 2019-2025
Featured by good electrical conductivity and transparency, ITO targets are widely applied to fields of LCD, flat-panel display, plasma display, touch screen, electronic paper, OLED, solar cell, antist...