China Filling Station and Gas Station Industry Report,2015-2018
-
Apr.2015
- Hard Copy
- USD
$2,550
-
- Pages:170
- Single User License
(PDF Unprintable)
- USD
$2,400
-
- Code:
WLQ028
- Enterprise-wide License
(PDF Printable & Editable)
- USD
$3,700
-
- Hard Copy + Single User License
- USD
$2,750
-
Filling Stations
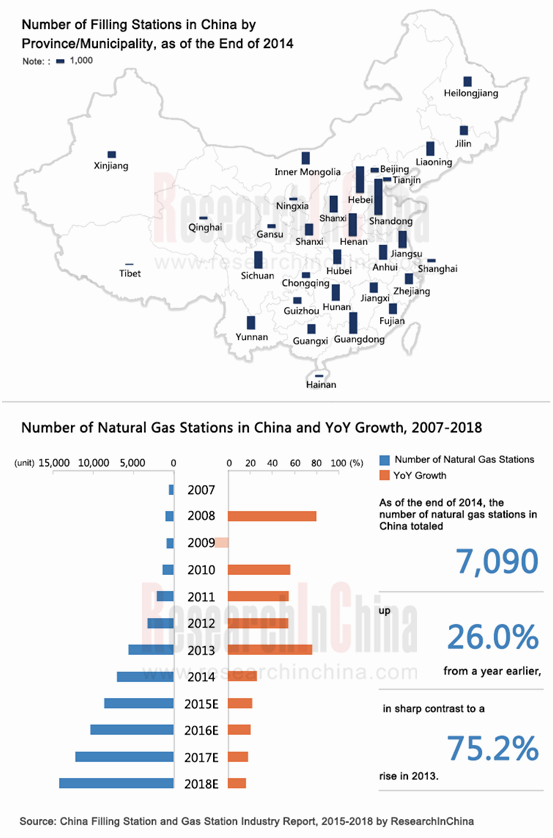
By the end of 2014, China had run a total of 99,000 filling stations, each of which served 1,456 civilian cars; Shandong, Hebei, Henan, Guangdong and Jiangsu ranked top five by the number of filling stations, especially Shandong province had 10,000 ones (it also held the most civilian cars in China with a fast growth rate). In terms of the number of civilian cars served by a filling station, Beijing, Zhejiang, Tianjin, Guangdong and Jiangsu saw each filling station support more than 2,000 civilian cars, particularly Beijing even witnessed 4,900.
Regarding enterprises, Sinopec occupies 31.0% of filling stations in the country, remaining first by number. As of the end of 2014, it had possessed 30,551 filling stations, including 30,538 self-operated ones and 13 franchised ones.
Since Sinopec took the lead to introduce private capital to the field of refined oil products in February 2014, state-owned oil and gas giants (PetroChina, CNOOC, etc.) have been constantly promoting mixed ownership reforms. Sinopec sells its 29.99% stake of its sales companies to realize its mixed ownership reform. PetroChina deepens the reform to the highly monopolized oil and gas exploitation field. As more capital rushes into the oil and gas industry, particularly in the marketing field, the operating modes (such as startup, acquisition, leasing, joint ventures and franchising, etc.) and service modes (introduction of the Internet, open platforms for partners, penetration in all life services) of filling stations will be further optimized, new business models will mushroom, and the filling station industry will seize higher profit margins.
Gas Stations
Before 2012, China's natural gas vehicles were mainly CNG ones. Given LNG vehicles are widely accepted by virtue of environmental friendliness, economical efficiency, security and other features, Shandong, Xinjiang, Hebei, Guangdong, etc. have boosted and popularized LNG vehicles (including heavy trucks, city buses, highway buses) since 2012. Thanks to the wide promotion of LNG vehicles and the maturity of technologies about LNG gas stations, the number of Chinese LNG gas stations jumped from 241 in 2011 to 2,500 in 2014. In October 2012, Natural Gas Utilization Policy defined dual-fuel and LNG vehicles as priority natural gas applications for the first time, stipulated that for the construction of gas stations used for priority projects, and local governments were allowed to issue incentive policies concerning land, financing, charges, etc.. In the future, natural gas stations, particularly LNG gas stations, will maintain rapid growth.
Currently, the world is prompting clean energy (natural gas, etc.) and new energy vehicles (battery electric vehicle, plug-in hybrid electric vehicle, fuel cell vehicle, etc.). In the next decade, traditional fuel vehicles, clean energy vehicles and new energy vehicles will coexist. More and more filling stations will further enrich the energy structure, deploy "oil + gas", "oil + electricity", "oil + gas + electricity" and other modes, and transfer towards integrated energy service stations.
The report highlights the followings:
 Overview of the filling station industry (including definition, classification, major clients and consumption habits, business models and strategies of filling stations at home and abroad, etc.)
Chinese refined oil and filling station market (embracing gasoline and diesel output and sales volume; price trend; refined oil enterprises; number, distribution and competition pattern of filling stations; etc.)
Chinese motor vehicle and filling station market (involving sales volume and ownership of automobiles; the number of motor vehicles and automobiles served by each filling station)
Global and Chinese gas station market (such as market overview; natural gas vehicle ownership; number, competition pattern and development prospect of natural gas stations, etc.)
Analysis (revenue, revenue structure, net income, gross margin, refined oil sales volume, filling station business, etc.) on leading companies (Shell, BP, Sinopec, PetroChina, etc.) in global and China filling station industry.
1. Overview of Filling Station Industry
1.1 Definition and Classification
1.1.1 Definition
1.1.2 Classification
1.2 Major Clients and Consumption Characteristics
1.3 Business Models and Strategies of Filling Stations at Home and Abroad
1.3.1 Business Models (By Entity)
1.3.2 Business Models of Filling Stations in Europe (by Business)
1.3.3 Business Models of Filling Stations in the United States (by Business)
1.3.4 Business Models of Filling Stations in Japan (by Business)
1.3.5 Business Strategies of Filling Stations in China
2. Chinese Refined Oil and Filling Station Market
2.1 Refined Oil Output and Sales Volume
2.2 Refined Oil Output and Sales Volume by Segmented Product
2.2.1 Diesel
2.2.2 Gasoline
2.2.3 Kerosene
2.3 Refined Oil Price
2.3.1 Overview
2.3.2 Gasoline
2.3.3 Diesel
2.4 Refined Oil Enterprises
2.4.1 Policies
2.4.2 Distribution Firms
2.4.3 Employees
2.4.4 Operation
2.5 Filling Station
2.5.1 Number and Distribution
2.5.2 Non-oil Business
2.5.3 Filling Station Chain
2.5.4 Competition Pattern
2.5.5 Development Trends
3. Chinese Motor Vehicle and Filling Station Market
3.1 Motor Vehicle Ownership
3.1.1 Overall Market
3.1.2 Regional Market
3.2 Automobile Sales Volume
3.2.1 Overall Market
3.2.2 New Energy Vehicle Sales Volume
3.3 Automobile Ownership
3.3.1 Overall Market
3.3.2 Regional Market
3.4 Filling Station and Motor Vehicle Market
3.4.1 Number Comparison between Filling Stations and Motor Vehicles
3.4.2 Number of Motor Vehicles Served by Each Filling Station
4. Global and Chinese Gas Station Market
4.1 Market Overview
4.1.1 Overview
4.1.2 Natural Gas Station
4.1.3 LPG Station
4.2 Natural Gas Vehicle
4.2.1 Market Overview
4.2.2 Global Market
4.2.3 Chinese Market
4.3 Natural Gas Station
4.3.1 Global Market
4.3.2 Chinese Market
4.4 Competition Pattern
4.4.1 Corporate Competition
4.4.2 Regional Competition
4.5 Development Prospect
5. Global Key Filling Station Companies
5.1 Shell
5.1.1 Profile
5.1.2 Operating Performance
5.1.3 Revenue Structure
5.1.4 Oil and Gas Production and Sale
5.1.5 LNG Business
5.1.6 Filling Station Business
5.1.7 Filling Station Business in China
5.1.8 Development Strategy
5.2 BP
5.2.1 Profile
5.2.2 Operating Performance
5.2.3 Revenue Structure
5.2.4 Oil and Gas Production and Sale
5.2.5 Filling Station Business
5.2.6 Filling Station Business in China
5.2.7 Development Strategy
5.3 ExxonMobil
5.3.1 Profile
5.3.2 Operating Performance
5.3.3 Revenue Structure
5.3.4 Oil and Gas Production and Sale
5.3.5 Filling Station Business
5.4 Total
5.4.1 Profile
5.4.2 Operating Performance
5.4.3 Revenue Structure
5.4.4 Oil and Gas Production and Sale
5.4.5 Filling Station Business
5.4.6 Filling Station Business in China
6. Key Chinese Filling Station Enterprises
6.1 Sinopec
6.1.1 Profile
6.1.2 Operating Performance
6.1.3 Revenue Structure
6.1.4 Gross Margin
6.1.5 Oil and Gas Output and Sales Volume
6.1.6 Filling Station Business
6.1.7 Mixed Ownership Reform
6.1.8 Business Plan
6.2 PetroChina
6.2.1 Profile
6.2.2 Operating Performance
6.2.3 Revenue Structure
6.2.4 Gross Margin
6.2.5 Oil and Gas Output and Sales Volume
6.2.6 Filling Station Business
6.2.7 Business Plan
6.3 CNOOC
6.3.1 Profile
6.3.2 Operating Performance
6.3.3 Revenue Structure
6.3.4 Filling Station Business
6.3.5 Development Prospect
7. Summary and Forecast
7.1 Filling Station and Gas Station
7.1.1 Number of Filling Stations and Gas Stations
7.1.2 Number of Cars Served by Filling Stations and Gas Stations
7.2 Comparison between Listed Companies
7.2.1 Revenue
7.2.2 Net Income
Classification of Filling Stations by Grade
Consumption Characteristics and Habits of Major Filling Station Clients
China's Refined Oil Output and YoY Growth, 2006-2018E
China's Refined Oil Sales Volume and YoY Growth, 2006-2018E
China's Refined Oil Apparent Consumption and YoY Growth, 2006-2018E
China's Refined Oil Output Structure, 2006-2014
China's Refined Oil Apparent Consumption Structure, 2006-2014
China's Refined Oil Import dependency and self-sufficiency Ratios, 2006-2014
China's Diesel Output and YoY Growth, 2006-2014
China's Diesel Sales Volume and YoY Growth, 2006-2014
China's Diesel Apparent Consumption and YoY Growth, 2006-2014
% of China's Diesel in Refined Oil by Output and Apparent Consumption, 2006-2014
China's Gasoline Output and YoY Growth, 2006-2014
China's Gasoline Sales Volume and YoY Growth, 2006-2014
China's Gasoline Apparent Consumption and YoY Growth, 2006-2014
% of China's Gasoline in Refined Oil by Output and Apparent Consumption, 2006-2014
China’s Kerosene Output and YoY Growth, 2006-2014
China’s Kerosene Sales Volume and YoY Growth, 2006-2014
China’s Kerosene Apparent Consumption and YoY Growth, 2006-2014
% of China's Kerosene in Refined Oil by Output and Apparent Consumption, 2006-2014
China's 90 # Lead-free Gasoline Wholesale and Retail Prices, 2009-2014
China's 93 # Gasoline Wholesale and Retail Prices, 2009-2014
China's 93 # Lead-free Gasoline Wholesale and Retail Prices, 2009-2014
China's 97 # Gasoline Wholesale and Retail Prices, 2009-2014
Difference between China's 93 # and 97 # Gasoline Wholesale and Retail Prices, 2009-2014
China's 0 # Diesel Wholesale and Retail Prices, 2009-2014
Difference between China's 0 # Diesel Wholesale and Retail Prices, 2009-2014
Number of Refined Oil Wholesale, Storage and Retail Enterprises in China, 2006-2014
Number of State-owned, Private and Foreign Refined Oil Enterprises in China, 2012-2013
Number of Employees Working for State-owned, Private and Foreign Refined Oil Wholesale, Storage and Retail Enterprises in China, 2012-2013
China's Refined Oil Wholesale Volume, Storage Volume and Retail Sales Volume, 2011-2014
Number of Filling Stations and YoY Growth in China, 2006-2018E
Number of Filling Stations in China (by Annual Retail Sales Volume), 2012-2014
Regional Distribution of Filling Stations in China, 2012-2014
Number and YoY Growth of Filling Stations Conducting Non-oil Business in China, 2009-2018
Non-oil Revenue and YoY Growth of Filling Stations in China, 2009-2018E
Total Number of Headquarters and YoY Growth of Filling Station Chains in China, 2009-2014
Number of Stores and YoY Growth of Filling Station Chains in China, 2006-2014
Business Area and YoY Growth of Filling Station Chains in China, 2006-2014
Number of Employees of Filling Station Chains in China, 2006-2014
Procurement and YoY Growth of Filling Station Chains in China, 2006-2014
Revenue and YoY Growth of Filling Station Chains in China, 2009-2014
Difference between Revenue and Procurement of Filling Station Chains in China, 2009-2014
Market Share of State-owned, Private and Foreign Filling Stations in China by Number, 2010-2014
Entry Time and Layout Area of Foreign Companies in Chinese Filling Station Market
Number of Filling Stations of Major Enterprises in China (by Province/Municipality), by the end of 2014
China’s Motor Vehicle Ownership and YoY Growth, 2006-2018E
China’s Motor Vehicle Ownership Structure, 2014
China’s Motor Vehicle Ownership and Market Share (by Province/Municipality), 2014
China’s Automobile Sales Volume and YoY Growth, 2006-2018E
China’s Passenger Car and Commercial Vehicle Sales Volume, 2006-2018E
China's Automobile Sales Volume Structure (by Power), 2006-2014
China's Passenger Car Sales Volume Structure (by Power), 2006-2014
China's Commercial Vehicle Sales Volume Structure (by Power), 2006-2014
China's New Energy Vehicle Sales Volume and YoY Growth, 2010-2018E
% of New Energy Vehicle Sales Volume in China's Total Automobile Sales Volume, 2010-2018E
China's New Energy Vehicle Sales Volume Structure (by Technology), 2011-2014
China’s Automobile Ownership and YoY Growth, 2006-2018E
China’s Civilian Automobile Ownership and YoY Growth, 2006-2018E
Family Car Ownership per 100 Urban Families in China and YoY Growth, 2006-2018E
China’s Civilian Vehicle Ownership (by Province/Municipality), 2006-2014
YoY Growth of China’s Civilian Automobile Ownership (by Province/Municipality), 2007-2014
Family Car Ownership per 100 Urban Families in China (by Province/ Municipality), 2006-2013
YoY Growth of Family Car Ownership per 100 Urban Families in China (by Province/Municipality), 2007-2013
Number of Filling Stations, Motor Vehicles, Automobiles and Civilian Automobiles in China, 2006-2018E
Growth Rates of Filling Stations, Motor Vehicles, Automobiles and Civilian Automobiles in China, 2007-2018E
Number of Motor Vehicles, Automobiles and Civilian Automobiles Served by Each Filling Station in China, 2006-2018E
Number of Civilian Automobiles Served by Each Filling Station (by Province/Municipality), 2014
Merits and Demerits of LNG and CNG
Advantages and Disadvantages of LNG and CNG Vehicles
Classification of Natural Gas Stations
Policies on Natural Gas Vehicle in China, 2012-2014
Global Natural Gas Vehicle Ownership and YoY Growth, 2006-2018E
Growth Rate of Global Natural Gas Vehicle Ownership by Region, 2006-2013
Global Top 20 Countries by Natural Gas Vehicle Ownership, 2006-2013
China’s Natural Gas Vehicle Ownership and YoY Growth, 2006-2018E
% of Natural Gas Vehicle Ownership in China’s Total Automobile Ownership, 2006-2018E
China’s LNG and CNG Vehicle Ownership, 2011-2018E
Number of Global Natural Gas Stations and YoY Growth, 2007-2018E
Global Top 20 Countries by Number of Natural Gas Stations, 2007-2013
Number of Natural Gas Vehicles Served by Each Natural Gas Station in the World, 2007-2018E
Number of Natural Gas Stations and YoY Growth in China, 2007-2018E
Number of CNG and LNG Gas Stations in China, 2011-2018E
Number of Natural Gas Vehicles Served by Each Natural Gas Station in China, 2011-2018E
China’s CNG Vehicle Ownership (by Province/Municipality), 2012-2013
Number of CNG Gas Stations in China (by Province / Municipality), 2012-2013
Number of CNG Vehicles Served by Each CNG Gas Station in China (by Province / Municipality), 2012-2013
Shell's Revenue and YoY Growth, 2009-2014
Shell's Net Income and YoY Growth, 2009-2014
Shell's Main Business
Shell's Revenue Structure (by Business), 2010-2014
Shell's Revenue Structure (by Region), 2010-2014
Shell's Net Income (by Business), 2012-2014
Financial Indicators of Shell's Upstream Business, 2014
Financial Indicators of Shell's Downstream Business, 2014
Shell's Proven Crude Oil and Natural Gas Reserves (by Region), 2012-2014
Shell's Crude Oil Output (by Region), 2012-2014
Shell's Natural Gas Output (by Region), 2012-2014
Shell's Oil Product Sales Volume (by Product and Region), 2009-2014
Shell's LNG Capacity, 2007-2020E
Shell's Status in LNG Business
Distribution of Shell's LNG Liquefaction Plants, by the end of 2014
Shell's LNG Sales Volume (by Region), 2012-2014
Number of Shell's Filling Stations (by Region), 2009-2013
Number of Shell's Filling Stations in China (by Province / Municipality), by the end of 2014
BP's Revenue and YoY Growth, 2009-2014
BP's Net Income and YoY Growth, 2009-2014
BP's Revenue Structure (by Business), 2008-2013
Key Financial Indicators of BP's Upstream Business, 2012-2014
Key Financial Indicators of BP's Downstream Business, 2012-2014
Key Financial Indicators of BP's Other Business, 2012-2014
BP's Proven Crude Oil and Natural Gas Reserves, 2012-2014
BP's Output of Crude Oil and Natural Gas, 2012-2014
BP's Oil Product Sales Volume (by Product and Region), 2009-2014
Number of BP's Filling Stations (by Region), 2010-2014
Number of BP's Filling Stations in Guangdong (by City), by the end of 2014
ExxonMobil’s Revenue and YoY Growth, 2009-2014
ExxonMobil’s Net Income and YoY Growth, 2009-2014
ExxonMobil's Key Financial Indicators, 2010-2014
ExxonMobil's Revenue Structure (by Business), 2012-2013
ExxonMobil's Revenue Structure (by Region), 2010-2014
ExxonMobil's Proven Crude Oil and Natural Gas Reserves (by Region), by the end of 2014
ExxonMobil's Output of Crude Oil and Natural Gas (by Region), 2012-2014
ExxonMobil's Oil Product Sales Volume (by Product and Region), 2009-2014
Number of ExxonMobil's Filling Stations (by Region), 2009-2014
Total's Revenue and YoY Growth, 2009-2014
Total's Net Income and YoY Growth, 2009-2014
Total's Key Financial Indicators, 2012-2014
Total's Revenue Structure (by Business), 2012-2014
Total's Revenue Structure (by Region), 2012-2014
Total's Proven Crude Oil and Natural Gas Reserves (by Region), 2009-2013
Total's Output of Crude Oil and Natural Gas (by Region), 2009-2013
Total's Oil Product Sales Volume (by Product and Region), 2010-2013
Total's LNG Business (by Region)
Total's LNG Sales Volume (by Region), 2009-2013
Total's Pipeline Gas Sales Volume (by Region), 2009-2013
Number of Total's Filling Stations (by Region), 2010-2014
Sinopec's Revenue and YoY Growth, 2009-2014
Sinopec's Net Income and YoY Growth, 2009-2014
Sinopec's Revenue Structure (by Business), 2009-2014
Sinopec's Gross Margin (by Business), 2009-2014
Sinopec's Proven Crude Oil and Natural Gas Reserves, 2006-2014
Sinopec's Output of Crude Oil, Natural Gas and Refined Oil (by Product), 2006-2014
Sinopec's Sales Volume of Crude Oil, Natural Gas and Refined Oil (by Product), 2009-2014
Average Selling Price of Sinopec's Oil Products (by Product), 2006-2014
Number and Market Share of Sinopec's Filling Stations, 2006-2018E
Structure of Sinopec's Filling Stations by Number, 2000-2014
Average Annual Filling Volume and YoY Growth of Each Filling Station under Sinopec, 2006-2018E
Non-oil Revenue and YoY Growth of Sinopec's Filling Stations, 2008-2018E
25 Investors Introduced by Sinopec's Mixed Ownership Reform
Sinopec's Revenue and YoY Growth, 2015-2018E
PetroChina's Revenue and YoY Growth, 2009-2014
PetroChina's Net Income and YoY Growth, 2009-2014
PetroChina's Revenue Structure (by Business), 2009-2014
PetroChina's Revenue Structure (by Region), 2009-2014
PetroChina's Gross Margin (by Business), 2009-2014
PetroChina's Proven Crude Oil and Natural Gas Reserves, 2006-2014
PetroChina's Output of Crude Oil, Natural Gas and Refined Oil (by Product), 2006-2014
PetroChina's Sales Volume of Crude Oil, Natural Gas and Refined Oil (by Product), 2006-2014
Average Selling Price of PetroChina's Oil Products (by Product), 2006-2014
Number and Market Share of PetroChina's Filling Stations, 2006-2018E
Structure of PetroChina's Filling Stations by Number, 2006-2014
Average Annual Filling Volume and YoY Growth of Each Filling Station under PetroChina, 2006-2018E
PetroChina's Revenue and YoY Growth, 2015-2018E
CNOOC's Revenue and YoY Growth, 2009-2014
CNOOC's Net Income and YoY Growth, 2009-2014
CNOOC's Revenue Structure (by Business), 2009-2014
CNOOC's Marketing Network, by the end of 2014
Number and YoY Growth of CNOOC's Filling Stations, 2009-2018E
CNOOC's Revenue and YoY Growth, 2015-2018E
Number of Filling Stations and Natural Gas Stations in China, 2007-2018E
Growth Rates of Number of Filling Stations and Natural Gas Stations in China, 2008-2018E
Number of Automobiles and Natural Gas Vehicles Served by Each Filling Station and Natural Gas Station in China Respectively, 2007-2018E
Revenue Comparison between Global and Chinese Major Oil Companies, 2009-2014
Revenue Growth Comparison between Global and Chinese Major Oil Companies, 2009-2014
Net Income Comparison between Global and Chinese Major Oil Companies, 2009-2014
Net Income Growth Comparison between Global and Chinese Major Oil Companies, 2010-2014
Comparison between Major Oil Companies in China by Number of Filling Stations, 2010-2014
Global and China Wind Farm O&M Industry Report, 2017-2021
As the wind power installed capacity grows and the warranty period of a large number of wind turbines is coming to an end, wind farm O & M has become the focus of the industry. In 2016, the global...
Global and China Electrical Energy Storage (EES) Industry Report, 2016-2020
Energy storage finds widespread application in power system, involving power generation, transmission, distribution, and end users. Global cumulative installed capacity of electrical energy storage (E...
Global and China Wind Farm Operation and Maintenance Industry Report, 2015-2018
In 2014, the global wind farm O & M market size hit USD9.25 billion, representing a year-on-year growth rate of 25.8%; by 2018, the market size is expected to reach USD13.78 billion. The mainstrea...
China Energy Storage for Grid System Industry Report, 2015-2018
Energy storage finds wide application in electric power system, involving all aspects of power generation, transmission, distribution and end user. Technically, energy storage for grid system can be d...
China Energy Conservation Service Industry Report, 2015
Energy conservation service industry provides service and support for enterprises and projects in terms of energy conservation and emission reduction. An Energy Service Company, more commonly referred...
China Natural Gas Fueling Station Equipment Industry Report, 2015-2018
According to different fuels used by natural gas stations, gas station equipment can be divided into compressed natural gas (CNG) station equipment and liquefied natural gas (LNG) station equipment. T...
China Filling Station and Gas Station Industry Report,2015-2018
Filling Stations By the end of 2014, China had run a total of 99,000 filling stations, each of which served 1,456 civilian cars; Shandong, Hebei, Henan, Guangdong and Jiangsu ranked top five by the nu...
China Biodiesel Industry Report, 2014-2017
Biodiesel refers to a renewable diesel fuel made from oil crops, animal fats, food waste oil that can substitute petroleum diesel and has environmental protection, safety, renewability and other advan...
China Filling Station And Refueling Station Industry Report,2013-2016
By the end of 2012, China has had a total of 96,313 filling stations, an increase of 875 or up 0.92% compared to 2011, including 51,854 SOE filling stations (53.8% of the total), 42,425 private fillin...