Global and China Semiconductor Equipment Industry Report, 2014-2015
-
June 2015
- Hard Copy
- USD
$2,500
-
- Pages:116
- Single User License
(PDF Unprintable)
- USD
$2,300
-
- Code:
ZYW209
- Enterprise-wide License
(PDF Printable & Editable)
- USD
$3,600
-
- Hard Copy + Single User License
- USD
$2,700
-
Global and China Semiconductor Equipment Industry Report, 2014-2015covers the following:
1. Global Semiconductor Market and Industry;
2. China Semiconductor Market and Industry;
3. Global and China Semiconductor Equipment Market and Industry;
4. Fifteen Semiconductor Equipment Vendors
In 2014, the global semiconductor equipment market size totaled USD38 billion, up 10.4% from 2013. It is predicted that in 2015 this figure will climb to USD40.5 billion, a rise of 6.7% from a year ago, and that the market size in 2016 will slump by 5.6% as compared to 2015. However, the possible shrinkage in 2016 might come from the following factors:
Firstly, following a peak in 2014, main electronic products such as smartphones and tablet and laptop PCs have stagnated or declined. This is particularly true of tablet PCs, which has presented a significant decline. On the other hand, equipment market delays being sluggish but will without doubt decline in 2016.
Secondly, due to the global deflation, prices for bulk commodity led by oil and iron ore plunged and would cause knock-on effect, which would in turn result in a fall in semiconductor equipment prices.
Thirdly, global economic recovery will probably come to a halt, with the US GDP dropping by 0.7% in 2015Q1. Moreover, China’s GDP growth slowed obviously. The both countries constituted the major driving force of the global economy. The stimulatory effect of US QE began to fade away, and therefore the economy might go down.
In the future, it is difficult to come up with a start product like smartphones. Thus, the prospects for the semiconductor industry remain uncertain.
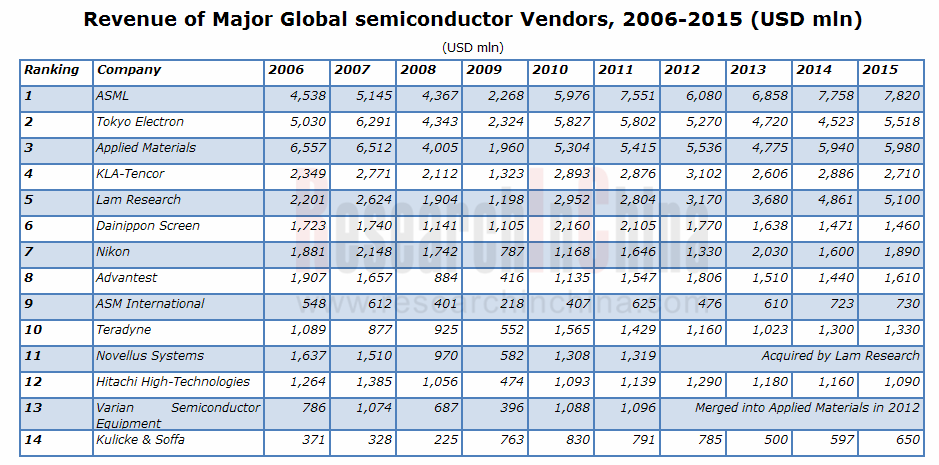
In 2014, semiconductor equipment vendors made remarkable performance, with a substantial rise in operating profit, though their revenue did not increased. The merger of Applied Material and Tokyo Electron was rejected by the US Department of Commerce. In future, more of M&A plans may well be intervened by the government, after all semiconductor equipment market is a highly concentrated market.
In 2015, the Chinese semiconductor companies and institutions showed their strength, launching a series of mergers and acquisitions. The Chinese enterprises are adept in and fond of capital operation rather than industrial production. The semiconductor equipment market size in China will reach USD4.4 billion in 2015, of which the domestic companies, mostly engaged in low-end equipment, will account for just 14%.
1 Global Semiconductor Industry
1.1 Overview
1.2 Memory Industry Overview
1.3 DRAM Supply and Demand
1.4 NAND Supply and Demand
1.5 Memory Industry Chain
1.6 Market Share of Memory Vendors
1.7 Ranking of Memory Vendors
1.8 Market Share of NorFlash Vendors
1.9 IC Fabrication and Wafer Foundry
1.10 Overview of IC Packaging and Testing Industry
1.11 Chinese IC Market
1.12 China’s Semiconductor Industry
1.13 China’s Policies for Fostering Semiconductor Industry
1.14 M&A Activities in China’s Semiconductor Industry
1.15 China’s IC Industry Development Forecast
2 Semiconductor Equipment Industry
2.1 Semiconductor Equipment Market
2.2 Latest Developments of Semiconductor Equipment
2.3 Etching Equipment Industry
2.4 Thin Film Deposition Equipment Industry
2.5 Lithography Equipment Industry
2.6 Semiconductor Process Control Equipment
2.7 Compound Semiconductor Equipment Market
2.7.1 Aixtron
2.7.2 VEECO
2.8 Ranking of Semiconductor Equipment Vendors
2.9 China’s Semiconductor Equipment Industry
3 Major Semiconductor Equipment Vendors
3.1 Applied Materials
3.2 ASML
3.3 Tokyo Electron
3.4 KLA-Tencor
3.5 Lam Research
3.6 DAINIPPON SCREEN
3.7 Nikon Precision
3.8 Advantest
3.9 Hitachi High-Technologies
3.10 ASM International N.V.
3.11 Teradyne
3.12 ASM PACIFIC
3.13 Kulicke & Soffa
3.14 AMEC
3.15 Sevenstar Electronics
4 Semiconductor Downstream Market
4.1LTE Mobile Phone Market
4.2Global Mobile Phone Industry
4.3 China’s Mobile Phone Market
4.4 Laptop PC Market
4.5 Tablet PC Market
Global Semiconductor Market Size, 2013-2019E
Product Distribution of Global Semiconductor Market, 2013-2016E
Growth Rate of Global Semiconductor Products by Market Size, 2013-2016E
Capital Expenditure of Global Semiconductor Equipment, 2008-2017E
Capital Expenditure of Global Semiconductor Equipment by Downstream Application, 2008-2017E
Global Memory Market by Type, 2014
Automotive Memory Market Size, 2008-2015
Automotive Memory Market by Technology, 2010-2015
DRAM Industry Capex, 2008-2015
DRAM Oversupply Ratio, 2013-2016E
DRAM Demand by Device, 2013-2015
DRAM GB/System, 2013-2015
DRAM Oversupply Ratio, 2014Q1-2016Q4
NAND Industry Capex, 2008-2015
Memory Industry Chain
Branded DRAM Vendor Market Share, 2014Q1-Q4
Branded NAND Vendor Market share, 2014Q1-Q4
Mobile DRAM Vendor Market share, 2014Q1-Q4
Ranking of Major Memory Vendors by Revenue, 2013-2015
Revenue and Operating Margin of Memory Design Houses, 2013-2015
Operating Margin of Major Memory Vendors, 2013-2014
Market Share of Major NorFlash Vendors, 2012
Market Share of Major NorFlash Vendors, 2014
Global Foundry Market Size, 2008-2017E
Foundry Revenue of Advanced Nodes, 2012-2017E
Capacity of Top 10 IC Wafer Leaders, 2013
Ranking of Global Wafer Foundries by Sales, 2005-2014
Global IC Packaging and Testing Market Size, 2012-2017E
Global Outsourced IC Packaging and Testing Market Size, 2012-2017E
Global IC Packaging Market Size, 2012-2017E
Global IC Testing Market Size, 2012-2017E
China’s IC Market Size, 2011-2017E
China’s IC Import Value, 2006-2014
China’s IC Export Value, 2006-2014
Sales of China’s IC Industry, 2008-2014
China’s IC Industry Capex, 2008-2014
Ranking of Top 10 IC Design Houses by Sales, 2004/2014
National IC Fund Structure
Semiconductor Manufacturing Process
Capital Spending of Semiconductor Equipment, 2013-2019E
Semiconductor Equipment Market Size, 2010-2018E
Market Size of Semiconductor Equipment by Region, 2010-2016E
Global Fab Equipment Investment, 2007-2016E
Semiconductor Shipments to Japan vs. Japanese Electronic Equipment Production, 2009-2015
North American Semiconductor Equipment Industry Book/Bill Ratio, 1999-2015
Global Silicon Wafer vs. Semiconductor Shipments, 2000-2015
Etching Market by Solution, 2008-2012
Market Share of Major Etching Equipment Players , 2000\2005\2010\2013
Market Share of Major Global CVD, PVD, ECD, and CMP Vendors, 2000\2005\2010
Deposition market by Solution, 2008-2012
Deposition Market Share, 2012
Market Share of Global Lithography Equipment Vendors, 1992-2011
Growth Rate of Semiconductor Process Control Equipment Market, 1995-2012
Connectivity RF Market Size, 2011-2017E
Costs of Mobile Phone RF System
Global Presence of AIXTRON
AIXTRON’s Revenue and EBIT, 2003-2015
AIXTRON’s Revenue by Application, 1999-2014
AIXTRON’s Order Intake, 2013Q1-2015Q1
AIXTRON Order Backlog, 2013Q1-2015Q1
AIXTRON Technology Position
Aixtron Sales by End Application, Q1/2015
Aixtron Sales by Business, Q1/2015
VEECO’s Revenue and Operating Margin, 2004-2015
VEECO’s MOCVD Market Share, 2007-2014
VEECO’s Market Data, Q1/15
VEECO’s Revenue by End Market, Q1/14-Q1/15
Veeco PSP: Front-End Performance at Packaging Costs
Ranking of Global Semiconductor Equipment Vendors by Revenue, 2006-2015
Operating Margin of Major Global Semiconductor Equipment Vendors, 2013-2015
AMAT's Revenue, Gross Margin and Operating Margin, FY2007-FY2015
AMAT’s Operation Profit by Segment, FY2012-FY2014
Value of AMAT's New Orders and Order Backlog, FY2007-FY2014
AMAT's New Order Value and Operating Profit, 2013Q4-2015Q1
AMAT's Revenue and Operating Margin, 2013Q4-2015Q1
AMAT's New Orders by Region, FY2009-FY2015
AMAT's New Orders by Division, FY2009-FY2015
AMAT's Order Backlog by Division, FY2010-FY2013
AMAT's Net Sales by Region, FY2009-FY2015
AMAT’s Net Sales by Segment, FY2009-FY2015
AMAT’s Display Revenue by Region, FY2011-FY2014
New Orders of AMAT's Semiconductor Equipment Segment by Business, FY2009-FY2014
ASML's Revenue and Gross Margin, 2007-2015
ASML's Revenue, 2010Q1-2015Q1
ASML's Revenue by Application, 2010Q1-2015Q1
ASML’s Order Backlog by Technology and Region, 2015Q1
ASML's Quarterly Revenue and Operating Margin, 2013Q4-2015Q1
ASML's Quarterly Sales Volume and ASP, 2013Q4-2015Q1
ASML's Quarterly Revenue and Netbooking, 2013Q4-2015Q1
ASML's Order Backlog Value by Region, 2010-2015
ASML's Order Backlog Value by Application, 2010-2015
ASML's Order Backlog Value by Technology, 2010-2015
ASML's Roadmap
TEL’s Revenue and Operating Margin, FY2007-FY2016
Global Presence of TEL
TEL’s Revenue by Business, FY2006-FY2015
TEL’s Semi Equipment Revenue by Region, FY2006-FY2015
TEL’s Cleaning System
TEL’s ETCH System
KLA-Tencor’s Revenue and Operating Margin, FY2007-FY2015
KLA-Tencor’s Revenue by Business, FY2009-FY2015
KLA-Tencor’s Revenue by Application, FY2010-FY2015
KLA-Tencor’s Revenue by Region, FY2009-FY2015
SEMI Process Control Vendor Market Share, 2004-2013
KLA-Tencor Annual R&D Spending, 2002-2014
Foundry Fab: Normalized to $’s per 10k Wafer Starts per Month
Revenue and Operating Margin of Lam Research, FY2007-FY2015
Revenue and Net Income of Novellus, FY 2007- FY 2011
Revenue and Gross Profit of Novellus, 2010Q1-2011Q4
Net Orders and MoM Growth of Novellus, 2010Q1-2011Q4
Revenue of Novellus by Region, 2009-2011
Revenue of Lam Research by Application, FY2011-FY2015
Revenue of Lam Research by Region, FY2009-FY2015
Organizational Structure of DAINIPPON SCREEN MFG
Revenue and Operating Margin of DAINIPPON SCREEN, FY2007-FY2016
DNP Net Sales by Segment, FY2014-FY2015
DNP Operation Profit by Segment, FY2014-FY2015
DNP Quarterly Net Sales by Segment, Q1/FY13-Q4/FY15
DNP Quarterly Orders Received and Order Backlog, Q1/FY13-Q4/FY15
DNP SE Segment Order Received by Application, Q1/FY13-Q4/FY15
DNP Quarterly SE Segment Order Received by Region, Q4/FY15
DNP Quarterly FT Segment Order Received by Application, Q1/FY13-Q4/FY15
DNP FT Segment Order Received by Region, Q4/FY15
Balance Sheet of DNP, Q1/FY2015
Revenue and Operating Margin of Nikon Precision, FY2006-FY2016
NIKON Precision Equipment IC Steppers & Scanners Sales by Technology, FY2012-FY2016
NIKON Precision Equipment LCD Steppers & Scanners Sales by Generation, FY2012-FY2016
Advantest's Gross Margin and Operating Profit, FY2013Q1-FY2015Q4
Advantest's New Orders by Division, FY2013Q1-FY2015Q4
Advantest's New Orders by Region, FY2013Q1-FY2015Q4
Advantest's Revenue by Division, FY2013Q1-FY2015Q4
Advantest's Revenue by Region, FY2013Q1-FY2015Q4
Advantest Capex/R&D /Depreciation, FY2013Q1-FY2015Q4
Balance Sheet of Advantest, 2015Q1
Global Presence of Advantest
Revenue and Operating Margin of Hitachi High-Technologies, FY2007-FY2016
Revenue of Hitachi High-Technologies by Division, FY2011-FY2016
Operating Profit of Hitachi High-Technologies by Division, FY2011-FY2016
Electronic Device System Revenue of Hitachi High-Technologies by Business, FY2013-FY2014
Electronic Device System Front-end Revenue of Hitachi High-Technologies by Field, FY2013-FY2014
Hitachi High-Technologies’ Reverence from Electronic Device Systems by Business, FY2015-FY2016
ASM’s Revenue and Operating Margin, 2006-2014
ASM’s Revenue by Business, 2006-2012
ASM’s Sales and EBIT, 2009Q1-2015Q1
ASM’s Net Sales and Working Capital, 2011Q1-2015Q1
ASM’s Bookings/Backlog, 2009Q1-2015Q1
ASM’s Front-end Revenue by Region, 2010-2014
Profile of Universal Robots
Shipments of Universal Robots, 2008-2014
Teradyne’s Revenue and Operating Margin, 2006-2015
Teradyne’s Quarterly Orders, 2013Q1-2015Q1
Teradyne’s Quarterly Sales, 2013Q1-2015Q1
Teradyne’s Quarterly Gross Margin, 2013Q1-2015Q1
Teradyne Litepiont’s Quarterly Sales and Order, 2013Q1-2015Q1
Teradyne’s Sales by Region, 2015Q1
ASM PACIFIC’s Branches
ASM PACIFIC’s Revenue and Operating Profit, 2008-2014
ASM PACIFIC’s Product lines
ASM PACIFIC’s Revenue by Business, 2012-2014
ASM PACIFIC’s EBIT by Business, 2013-2014
ASM PACIFIC’s Revenue by Region, 2012-2014
Revenue and Operating Margin of Kulicke & Soffa, FY2007-FY2015
Top 10 Clients of Kulicke & Soffa, FY2011-FY2013
Global Presence of Kulicke & Soffa
Revenue and Operating Margin of Kulicke & Soffa, 2012Q1-2015Q1
Kulicke & Soffa R&D, 2012Q1-2015Q1
Kulicke & Soffa’s Main Products
K&S’s Share of Wire Bonder Equipment Market, 208-2017E
K&S’s Copper Bonder Unit, 2012-2017E
Revenue and Operating Profit of Sevenstar Electronics, 2008-2015
Revenue of Sevenstar Electronics by Business, 2009-2014
Frequency Bands per Mobile Handset Device, 2000-2018E
Cellular Terminal Shipment by Cellular Standard, 2000-2018E
LTE-enabled Cellular Terminal, 2011-2018E
Worldwide Smartphone Sales to End Users by Vendor, 2014 (Thousands of Units)
Worldwide Smartphone Sales to End Users by Operating System, 2014 (Thousands of Units)
Shipments of World’s Top 10 Mobile Phone Vendors, 2014
Monthly Shipments of Mobile Phones in China, Jan, 2013-Dec. 2014
Market Share of Major Smartphone Vendors in China, 2014
Market Share of Major 4G Mobile Phone Vendors in China, 2014
Laptop Computer Shipments, 2008-2015
Shipments of Major Laptop ODM Vendors Worldwide, 2010-2014
Global Tablet PC Shipments, 2011-2016E
Shipments of Top 5 Tablet Vendors, 2014Q4
Shipments, Market Share, and Growth of Top 5 Tablet Vendors, 2014
Global and China PCB Industry Chain Panorama (Copper Clad Laminate, Copper Foil, Electronic Resin, Electronic Fabric, Special Equipment) Industry Research Report, 2026
PCB: The Core "Skeleton" and "Nerve Center" of Electronic Devices
Printed Circuit Board (PCB) refers to a circuit board that forms copper circuit patterns on a copper-clad laminate according to a pre...
Global and China CMOS Camera Module (CCM) Industry Report, 2020-2026
The global CCM market has been ballooning thanks to expeditious penetration of multi-camera phones and advances in automotive ADAS, being worth $22.723 billion with a year-on-year spike of 16.6% in 20...
Global and China Multi-Layer Ceramic Capacitor (MLCC) Industry Report, 2020-2025
Electronic components like MLCC enjoy a rosy prospect alongside the burgeoning electronic manufacturing, the thriving internet and the prevalence of smart hardware.
MLCC was much sought after and it...
Global and China Voice Coil Motor (VCM) Industry Report, 2019-2025
VCM (voice circle motor or voice coil actuator), a part for smartphone camera, shares around 6% of smartphone camera industry chain value.
Globally, popularity of smartphones such as those with mult...
Global and China Aluminum Electrolytic Capacitor Industry Report, 2019-2025
Chinese aluminum electrolytic capacitor market has been expanding amid a transfer of its downstream industries to China like home appliance illumination, cellphones and computers as well as automatic ...
Global and China Flexible Printed Circuit (FPC) Industry Report, 2019-2025
Flexible printed circuit (FPC) products make their way into consumer electronics like smartphone and tablet PC, in the form of modules for display, touch control, fingerprint recognition, etc. The vol...
Global and China GaAs Industry Report, 2019-2025
Gallium arsenide (GaAs), one of the most mature compound semiconductors, is an integral part of smartphone power amplifier (PA). In 2018, GaAs-based radio frequency (RF) seized over half of the GaAs w...
Global and China Advanced Packaging Industry Report, 2019-2025
The global semiconductor packaging and testing market is enlarging with the prevalence of consumer electronics, automotive semiconductors and the Internet of Things (IoT), with its size edging up 2.5%...
Global and China MLCC Electronic Ceramics Industry Report, 2019-2025
MLCC is mainly used in audio and video equipment, mobile phones, computers and automobiles. The prospective boom of MLCC formula powder hinges on demand: 1) The accelerated renewal of consumer electro...
Global and China OLED Industry Report, 2019-2025
OLED, a new-generation display technology, features simple display structure, green consumables and flexibility and can be rolled up, which makes it easier to transport and install without considering...
Global and China Camera Module Industry Report, 2019-2025
Affected by factors like the maturity of mobile phone markets worldwide and the prolonged replacement of mobile phone by users, the mobile phone market has undergone a slowdown in growth rate. From Q4...
Global and China Multi-Layer Ceramic Capacitor (MLCC) Industry Report, 2018-2023
MLCC finds most application in consumer electronics, automobile and industrial fields and gets beefed up remarkably with the approaching 5G era of cellphones and tablet PCs, the advances in automotive...
Global and China Aluminum Electrolytic Capacitor Industry Report, 2018-2023
Aluminum electrolytic capacitor, a core electronic component, is widely used in consumer electronics, computers and peripherals, industry, electric power, lighting and automobiles.
Global aluminum e...
Global and China CMOS Camera System Industry Report, 2017-2021
Global CCM (CMOS Camera Module) market was worth USD16.611 billion in 2015, a year-on-year rise of 3.8% from 2014, the slowest rate since 2010. Global market fell modestly in 2016 due to a drop in shi...
Global and China Organic Light-Emitting Diode (OLED) Industry Report, 2017-2021
Global OLED market size approximated USD15.7 billion in 2016, a 20.8% rise from a year earlier. Stimulated by reports that Apple will adopt OLED screen for multiple iPhone models in 2017-2018, OLED sc...
Global and China CMOS Camera System Industry Report, 2016-2020
Global and China CMOS Camera System Industry Report, 2016-2020 covers the following:1. Analysis of CMOS Image Sensor (CIS) Industry and Market, with 7 vendors involved.2. Analysis of CMOS Camera Lens ...
Global and China Multi-layer Ceramic Capacitor (MLCC) Industry Report, 2017-2020
The rapid development of consumer electronics and industrial intelligentization has greatly promoted the booming of passive components including multi-layer ceramic capacitor (MLCC). In 2015, China’s ...
Global PCB Industry Report, 2015-2020
Global PCB Industry Report, 2015-2020 highlights the followings:1. Global PCB Market and Status Quo of the Industry2. Global Downstream Markets of PCB3. Mobile Phone PCB Trends4. Tablet PC/Laptop Comp...