Global and China Optical Fiber Preform Industry Report, 2014-2017
-
July 2015
- Hard Copy
- USD
$2,500
-
- Pages:97
- Single User License
(PDF Unprintable)
- USD
$2,350
-
- Code:
ZHP025
- Enterprise-wide License
(PDF Printable & Editable)
- USD
$3,700
-
- Hard Copy + Single User License
- USD
$2,700
-
Optical fiber preform, a kind of specialty glass preform used to draw optical fiber, is the core material for the manufacturing of optical fiber. Optical fiber preform, optical fiber and optical cable account for 70%, 20% and 10% of the total profit of the optical fiber industry chain.
Global optical fiber preform capacity amounted to 13,000 tons in 2014, mainly concentrated in the United States, Japan and China (totaling as much as 85.2% of the world’s total), of which China ranked first with a share of 39.8%. Besides a big producer of optical fiber preform, China is also a large consumer, demanding 6,639 tons in 2014, 60.9% of global demand. The figure is expected to increase to 7,144 tons in 2015.
Due to technological limitation, over 70% of China’s demand for optical fiber preform was imported prior to 2010. In recent years, as key domestic companies enhanced their capability for independent research and development, China’s optical fiber preform production capacity continued to expand. Thus, the self-sufficiency rate in optical fiber preform rose from 20.0% in 2007 to 64.4% in 2014, and is expected to reach 72.6% in 2015.
In March 2014, the Ministry of Commerce initiated an anti-dumping investigation on optical fiber preforms originating in Japan and the United States. In May 2015, the preliminary verdict showed that China Customs would levy security deposits on imports of optical fiber preform from Japan and the United States based on dumping margin (7.8%-39.0%) decided in preliminary rulings. Affected by this, China’s imports of optical fiber preform recorded negative growth (-9.5%) for the first time in 2014 and are expected to keep falling in 2015 (a year-on-year decline of 8.7% during Jan-May).
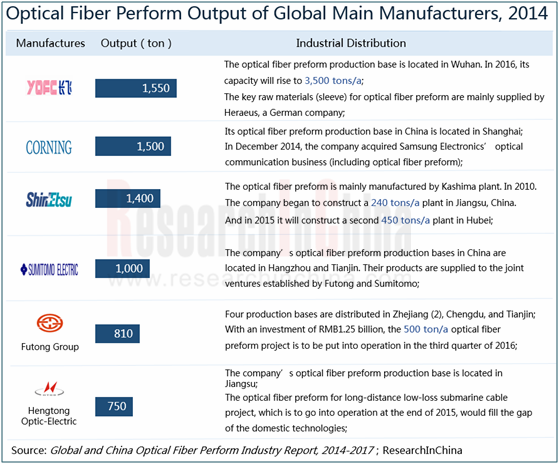
Global optical fiber preform industry is highly concentrated, with top5 companies (one in China, two in the United States, and two in Japan) together making up 59.4% of market share in 2014, of which Chinese Yangtze Optical Fibre and Cable Co., Ltd. (YOFC) taking the first place with a share of 13.3%, followed by U.S. Corning Inc. (12.9%).
 ?
?
YOFC: In Jun 2015, the company came to an agreement with Shin-Etsu Chemical Co., Ltd. to establish a joint venture (located in Qianjiang, Hubei Province), which is scheduled to be set up in Aug and specializes in the production of optical fiber preform with designed capacity of 450t/a.
Corning Inc.: In 2014, the company posted net sales of USD1.89 billion in China, making up 19.5% of its total. By 2014, the company had 9 manufacturing facilities in China, including one optical fiber preform manufacturing facility in Shanghai.
Sumitomo Electric Industries, Ltd.: The company cooperates with Futong Group in optical fiber preform field in China, jointly building two optical fiber preform production bases- Hangzhou SEI-Futong Optical Fiber Co., Ltd. and Tianjin SEI-Futong Optical Fiber Co., Ltd. with the latter going into production in Aug 2014 and being the first optical fiber preform project in northern China.
Hengtong Optic-electric Co., Ltd.: In Dec 2014, the company developed optical fiber preform of 200mm in diameter and 6 meters in length that could be drawn 15,000 km of thread, hitting a new world record; in Feb 2015, the company made breakthroughs in “long-distance low-loss submarine optical cable-used optical fiber preform R&D and industrialization” project, and is expected to start mass production at the end of 2015.
Global and China Optical Fiber Preform Industry Report, 2014-2017 highlights the followings:
 Supply & demand, competitive landscape, and price trend of the global optical fiber preform market;
Policy environment, supply & demand, import & export, and price trend of the Chinese optical fiber preform market;
Operation, revenue structure, gross margin, optical fiber preform business, and development in China of seven major global companies;
Operation, revenue structure, gross margin, and optical fiber preform business of six major Chinese companies.
1. Overview of Optical Fiber Preform
1.1 Definition
1.2 Production Technology
1.3 Industry Chain
1.3.1 Upstream
1.3.2 Downstream
2. Development of Global Optical Fiber Preform Industry
2.1 Status Quo
2.2 Supply & Demand
2.2.1 Supply
2.2.2 Demand
2.3 Regional Structure
2.3.1 USA
2.3.2 Japan
2.3.3 Europe
2.4 Price Trend
3. Development of China Optical Fiber Preform Industry
3.1 Policy Environment
3.2 Supply & Demand
3.2.1 Supply
3.2.2 Demand
3.3 Competition Pattern
3.4 Import & Export
3.4.1 Import
3.4.2 Export
3.5 Price Trend
3.5.1 Upstream & Downstream
3.5.2 Optical Fiber Preform
4. Global Optical Fiber Preform Companies
4.1 Corning
4.1.1 Profile
4.1.2 Operation
4.1.3 Revenue Structure
4.1.4 R&D and Investment
4.1.5 Optical Fiber Business
4.1.6 Development in China
4.2 Sumitomo Electric Industries
4.2.1 Profile
4.2.2 Operation
4.2.3 Optical Fiber Business
4.2.4 Development in China
4.3 Shin-Etsu Chemical
4.3.1 Profile
4.3.2 Operation
4.3.3 Revenue Structure
4.3.4 Optical Fiber Business
4.3.5 Development in China
4.4 Fujikura
4.4.1 Profile
4.4.2 Operation
4.4.3 Revenue Structure
4.4.4 Optical Fiber Business
4.4.5 Development in China
4.5 Prysmian
4.5.1 Profile
4.5.2 Operation
4.5.3 Revenue Structure
4.5.4 Optical Fiber Business
4.5.5 Development in China
4.6 Furukawa Electric
4.6.1 Profile
4.6.2 Operation
4.6.3 Revenue Structure
4.6.4 Optical Fiber Business
4.6.5 Development in China
4.7 NV Twentsche Kabel Holding (TKH)
4.7.1 Profile
4.7.2 Operation
4.7.3 Revenue Structure
4.7.4 Optical Fiber Business
4.7.5 Development in China
5. Chinese Optical Fiber Preform Companies
5.1 Yangtze Optical Fibre and Cable Company Ltd. (YOFC)
5.1.1 Profile
5.1.2 Operation
5.1.3 Revenue Structure
5.1.4 Gross Margin
5.1.5 Optical Fiber Business
5.2 Hengtong Optic-electric Co., Ltd.
5.2.1 Profile
5.2.2 Operation
5.2.3 Revenue Structure
5.2.4 Gross Margin
5.2.5 R&D
5.2.6 Optical Fiber Business
5.3 Jiangsu Zhongtian Technology Co., Ltd.
5.3.1 Profile
5.3.2 Operation
5.3.3 Revenue Structure
5.3.4 Gross Margin
5.3.5 Clients and Suppliers
5.3.6 R&D and Investment
5.3.7 Optical Fiber Business
5.4 FiberHome Telecommunication Technologies Co., Ltd.
5.4.1 Profile
5.4.2 Operation
5.4.3 Revenue Structure
5.4.4 Gross Margin
5.4.5 R&D and Investment
5.4.6 Optical Fiber Business
5.5 Futong Group
5.5.1 Profile
5.5.2 Operation
5.5.3 Revenue Structure
5.5.4 Gross Margin
5.5.5 Projects under Construction
5.5.6 Optical Fiber Business
5.6 Potevio Fasten Optical Communication Co., Ltd.
5.6.1 Profile
5.6.2 Projects under Construction
5.6.3 Optical Fiber Business
6. Summary and Forecast
6.1 Market
6.2 Enterprises
Optical Fiber Preform Mandrel and Cladding Diagram
Manufacturing Process Comparison of Optical Fiber Preform Mandrel
Optical Fiber Preform Mandrel Process Distribution Proportion, 2014
Manufacturing Process Comparison of Optical Fiber Preform Mandrel
China’s Optical Fiber Preform Cost Structure, 2014
Optical Fiber Preform Downstream Industry Chain
Global Optical Fiber Preform Capacity and Output, 2010-2017E
Global Optical Fiber Preform Demand, 2010-2017E
Global Optical Fiber Preform Capacity and Market Share (by Country/Region), 2010-2014
Global Optical Fiber Preform Demand (by Country/Region), 2010-2014
U.S. Optical Fiber Preform Capacity, Output and Demand, 2010-2014
U.S. Optical Fiber Preform Exports, 2010-2014
Japan’s Optical Fiber Preform Capacity, Output and Demand, 2010-2014
Japan’s Optical Fiber Preform Exports, 2010-2014
Global Optical Fiber Preform Price, 2000-2014
Policies on Optical Fiber Preform Industry in China, 2010-2015
Results of China’s Anti-dumping Actions on Imported Optical Fiber Preform, 2015
China’s Optical Fiber Preform Output and YoY Growth, 2007-2017E
Main Optical Fiber Preform Projects in China, 2014-2016
China’s Optical Fiber Preform Demand and YoY Growth, 2010-2017
China’s Self-sufficiency Rate in Optical Fiber Preform, 2007-2015
Stockholder Structure and Used Technologies of Major Chinese Optical Fiber Preform Manufacturers
Optical Wand, Fiber, and Cable Capacity and Output of Major Optical Fiber Preform Enterprises in China, 2013-2014
Import Volume and YoY Growth of Optical Fiber Preform in China, 2010-2015
Import Structure of Optical Fiber Preform in China by Country, 2013-2014
Import Value and YoY Growth of Optical Fiber Preform in China, 2010-2015
Export Volume and YoY Growth of Optical Fiber Preform in China, 2010-2015
Export Structure of Optical Fiber Preform in China by Country, 2013-2014
Export Value and YoY Growth of Optical Fiber Preform, 2010-2015
Centralized Procurement Price for Optical Fiber and Cable in China, 2004-2015
ASP of Optical Fiber Preform in China, 2010-2015
Corning's Revenue and Net Income, 2009-2015
Corning’s Revenue Structure by Product, 2012-2014
Corning’s Revenue Structure by Country/Region, 2010-2014
Corning’s R&D Costs and % of Net Sales, 2009-2014
Revenue of Corning’s Telecommunications Business Segment by Product, 2011-2014
Corning’s Revenue in China and % of Total Net Sales, 2009-2014
Net Sales and Net Income of Sumitomo Electric Industries, FY2008-FY2015
Revenue of Sumitomo Electric Industries by Business, FY2008-FY2015
Revenue of Sumitomo Electric Industries by Region, FY2008-FY2014
Sumitomo Electric Industries’ Revenue from Information and Communication, FY2013-FY2015
Revenue of Sumitomo Electric Industries in China, FY2011-FY2015
CDSEI’s Revenue, 2009-2014
Products of Shin-Etsu (by Segment), 2014
Net Sales and Net Income of Shin Etsu, FY2011-FY2015
Global Investment of Shin-Etsu, 2015
Revenue Structure of Shin-Etsu (by Segment), FY2014-FY2015
Revenue Structure of Shin-Etsu (by Region), FY2013-FY2015
Net Sales and Operating Income of Electronics & Functional Materials of Shin-Etsu, FY2010-FY2015
Net Sales in China and % of the Total Revenue of Shin-Etsu, FY2012-FY2015
Profile of Joint Venture of Shin-Etsu in China, 2015
Net Sales of Net Income of Fujikura, FY2009-FY2014
Sales Structure of Fujikura (by Segment), FY2012-FY2014
Sales Structure of Fujikura (by Region), FY2012-FY2014
Net Sales of Fujikura in China, FY2011-FY2014
Revenue and Net Income of FFOE, 2011-2014
Equity Structure of Prysmian, 2014
Global Distribution of Prysmian
Sales and Net Income of Prysmian, 2007-2014
Distribution of R&D Centers of Prysmian, As of 2014
Revenue Structure of Prysmian (by Segment), 2012-2014
Revenue Structure of Prysmian (by Region), 2014
Subsidiaries of Prysmian in China
Distribution of Prysmian in China
Global Distribution of Furukawa Electric
Net Revenue and Operating Income of Furukawa Electric, FY2007-FY2015
Net Revenue Structure of Furukawa Electric (by Business), FY2014
Sales and Operating Income of Furukawa Electric’s Telecommunications Service, FY2010-FY2015
Sales Breakdown and Percentage of Furukawa Electric’s Telecommunications Service (by Product), FY2012-FY2014
Global Distribution of TKH
Revenue and Net Income of TKH, 2009-2015
Revenue Breakdown and Percentage of TKH (by Business), 2012-2014
Revenue Structure of TKH (by Region), 2012-2014
Business Model and Markets of TKH’s Telecom Solutions
Ownership Structure of YOFC, 2015
Business Structure of YOFC
Revenue and Net Income of YOFC, 2007-2014
Revenue Structure of YOFC (by Product), 2011-2014
Operating Revenue of YOFC (by Region), 2011-2014
Gross Margin of YOFC (by Product), 2011-2014
(Optical Fiber Preform) Output and YoY of YOFC, 2006-2014
Main Materials Suppliers of YOFC
Equity Structure of Hengtong Optic-Electric, 2015
Global Marketing Networks of Hengtong Optic-Electric
Revenue and Net Income of Hengtong Optic-Electric, 2008-2015
Output, Sales Volume and Sales-output Ratio of Hengtong Optic-Electric (by Product), 2011-2014
Revenue of Hengtong Optic-Electric (by Product), 2011-2014
Revenue of Hengtong Optic-Electric (by Region), 2009-2014
Gross Margin of Hengtong Optic-Electric’s Optical Communication Products, 2011-2014
Hengtong Optic-Electric’s R&D Expenses and % of Total Revenue, 2009-2014
Capacity of Hengtong Optic-Electric’s Optical Fiber Perform, 2010-2015
Output and Sales Volume of Hengtong Optic-Electric’s Optical Fiber Perform, 2010-2014
Equity Structure of Jiangsu Zhongtian Technology, 2015
Revenue and Net Income of Jiangsu Zhongtian Technology, 2008-2015
Revenue Structure of Jiangsu Zhongtian Technology (by Product), 2009-2014
Revenue Structure of Jiangsu Zhongtian Technology (by Region), 2008-2014
Gross Margin of Jiangsu Zhongtian Technology by Product, 2008-2014
Revenue from Top 5 Clients and % of Total Revenue of Jiangsu Zhongtian Technology, 2009-2014
Procurement from Top 5 Suppliers and % of Total Procurement of Jiangsu Zhongtian Technology, 2009-2014
R&D Costs and % of Total Revenue of Jiangsu Zhongtian Technology, 2009-2014
Optical Fiber Preform Output of Jiangsu Zhongtian Technology, 2010-2014
Equity Structure of Fiberhome Telecommunication, 2015
Revenue and Net Income of FiberHome Telecommunication Technologies, 2008-2015
Revenue of FiberHome Telecommunication Technologies (by Product), 2008-2014
Revenue of FiberHome Telecommunication Technologies (by Region), 2008-2014
Gross Margin of FiberHome Telecommunication Technologies by Product, 2008-2014
R&D Costs and % of Total Revenue of FiberHome Telecommunication Technologies, 2011-2014
Net Income of Fiberhome Telecommunication’s Major Optical Fiber Preform Subsidiaries, 2014
Optical Fiber Preform Output of FiberHome Telecommunication Technologies, 2010-2014
Equity Structure of Futong Group, 2015
Production Base Distribution of Futong Group
Revenue and Net Income of Futong Group, 2009-2015
Global Marketing Network of Futong Group
Revenue Structure of Futong Group by Business, 2010-2015
Gross Margin of Futong Group by Business, 2009-2015
Major Projects under Construction of Futong Group, 2015
Optical Fiber Preform Production Bases of Futong Group
Optical Fiber Preform Capacity and Output of Futong Group, 2009-2015
Average Price of Optical Fiber Preform of Futong Group, 2011-2015
Major Raw Materials Suppliers of Optical Fiber Preform of Futong Group, 2014
Equity Structure of PUTIAN-FASTEN, 2015
Optical Fiber Preform Capacity and Output of Potevio FASTEN, 2006-2014
Global Optical Fiber Preform Capacity Structure, 2014
Growth of Global and China’s Demand for Optical Fiber Preform, 2011-2017E
Growth Rate of China's Import and Export Volume of Optical Fiber Preform, 2011-2015
Revenue Growth Rate of Major Global Optical Fiber Preform Enterprises, 2009-2015
Competition Pattern of Global Optical Fiber Preform Market, 2014
Competition Pattern of Chinese Optical Fiber Preform Market, 2014
Global and China Photoresist Industry Report, 2021-2026
Since its invention in 1959, photoresist has been the most crucial process material for the semiconductor industry. Photoresist was improved as a key material used in the manufacturing process of prin...
Global and China Needle Coke Industry Report, 2021-2026
Needle coke is an important carbon material, featuring a low thermal expansion coefficient, a low electrical resistivity, and strong thermal shock resistance and oxidation resistance. It is suitable f...
Global and China 3D Glass Industry Report, 2021-2026
3D curved glass is light and thin, transparent and clean, anti-fingerprint, anti-glare, hard and scratch-resistant, and performs well in weather resistance. It is applicable to terminals such as high-...
Global and China Graphene Industry Report, 2020-2026
Graphene, a kind of 2D carbon nanomaterial, features excellent properties such as mechanical property and super electrical conductivity and thermal conductivity. Its downstream application ranges from...
Global and China 3D Glass Industry Report, 2020-2026
Global 3D glass market has been enlarging over the recent years amid demetallization of smartphone back covers and popularity of smart wearables, to approximately $2.86 billion in 2019 and to an estim...
Global and China Photoresist Industry Report, 2020-2026
In 2019, global photoresist market was valued at $8.3 billion, growing at a compound annual rate of 5.1% or so since 2010, and it will outnumber $12.7 billion in 2026 with advances in electronic techn...
Global and China Synthetic Diamond Industry Report, 2020-2026
While its mechanical property is given full play in fields like grinding and cutting, diamond with acoustic, optical, magnetic, thermal and other special properties, as superconducting material, intel...
Global and China Needle Coke Industry Report, 2020-2026
With the merits like small resistivity, excellent resistance to impact and good anti-oxidation property, needle coke has been widely used in ultra-high power graphite electrodes, nuclear reactor decel...
Global and China Optical Fiber Preform Industry Report, 2019-2025
Optical fiber preform, playing an important role in the optical fiber and cable industry chain, seizes about 70% profits of optical fiber. Global demand for optical fiber preform stood at 16.2kt in 20...
China Silicon Carbide Industry Report, 2019-2025
Silicon carbide (SiC) is the most mature and the most widely used among third-generation wide band gap semiconductor materials. Over the past two years, global SiC market capacity, however, hovered ar...
Global and China Photoresist Industry Report, 2019-2025
Photoresist, a sort of material indispensable to PCB, flat panel display, optoelectronic devices, among others, keeps expanding in market size amid the robust demand from downstream sectors. In 2018, ...
Global and China Graphene Industry Report, 2019-2025
Graphene is featured with excellent performance and enjoys a rosy prospect. The global graphene market was worth more than $100 million in 2018, with an anticipated CAGR of virtually 45% between 2019 ...
Global and China 3D Glass Industry Chain Report, 2019-2025
The evolution of AMOLED conduces to the steady development of 3D curved glass market. In 2018, the global 3D glass market expanded 37.7% on an annualized basis and reached $1.9 billion, a figure proje...
China Wood Flooring Industry Report, 2019-2025
With the better standard of living and the people’s desire for an elegant life, wood flooring sees a rising share in the flooring industry of China, up from 33.9% in 2009 to 38.9% in 2018, just behind...
Global and China Photovoltaic Glass Industry Report, 2019-2025
In China, PV installed capacity has ramped up since the issuance of photovoltaic (PV) subsidy policies, reaching 53GW in 2017, or over 50% of global total. However, the domestic PV demand was hit by t...
Global and China ITO Targets Industry Chain Report, 2019-2025
Featured by good electrical conductivity and transparency, ITO targets are widely applied to fields of LCD, flat-panel display, plasma display, touch screen, electronic paper, OLED, solar cell, antist...
Global and China MO Source Industry Report, 2019-2025
MO source is a key raw material for metal-organic chemical vapor deposition (MOCVD) process. Global MO source output ranged at 102.6 tons in 2018, a rise of roughly 4.6% from a year earlier, a figure ...
Global and China Bi-Metal Band Saw Blade Industry Report, 2018-2023
Chinese manufacturing rebounded in the wake of a pick-up in infrastructure construction between 2016 and 2018, so did the bi-metal band saw blade as a key integral of metal processing industry. In 201...