China Energy Conservation Service Industry Report, 2015
-
Sep.2015
- Hard Copy
- USD
$2,600
-
- Pages:113
- Single User License
(PDF Unprintable)
- USD
$2,400
-
- Code:
WLQ034
- Enterprise-wide License
(PDF Printable & Editable)
- USD
$3,700
-
- Hard Copy + Single User License
- USD
$2,800
-
Energy conservation service industry provides service and support for enterprises and projects in terms of energy conservation and emission reduction. An Energy Service Company, more commonly referred to as an "ESCO," is a company that provides/installs and manages a suite of comprehensive energy solutions for a client company which reduces the energy expenses and greenhouse gas emissions for the client. Main business models for an ESCO to carry out energy saving business are Energy Management Contracting (EMC) / Energy Performance Contracting (EPC), etc, involving Shared Savings, Guaranteed Savings, Chauffage, etc.
By the end of 2014, there were 5,125 energy conservation service companies and 562,000 practitioners in China, up 5.6% and 10.6% respectively on a year-on-year basis. In 2014, China’s energy conservation service industry created output value of RMB265.037 billion, up 23.0% year-on-year (annual growth of 30% or over during 2007-2013)
Output Value and YoY Growth of China Energy Conservation Service Industry, 2007-2018E
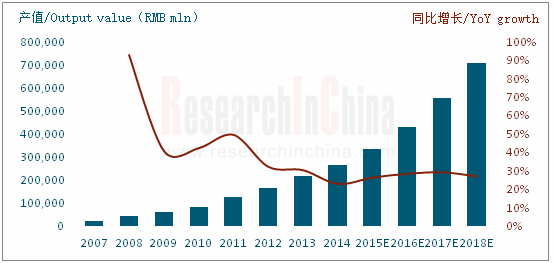
Source: EMCA, ResearchInChina
With respect to business models, EMC occupies an important position, seeing investment up 29.2% year-on-year to RMB95.876 billion, making up 36.2% of the industry’s output value. Concerning specific ways, shared savings dominates the market. Restricted by capital of energy conservation service companies, guaranteed savings and chauffage are expected to see a larger proportion of EMC investment in the future. At the same time, along with China’s implementation of the reform that allows social capital to participate in the urban infrastructure investment and operations through franchise and other ways, PPP mode (participation from energy conservation service companies, social capital and government) energy conservation service will possibly become dominant in infrastructure and public utilities.
At present, China’s energy conservation service applications are mainly found in industrial sectors (about 70% of the total energy consumption in the country), whose energy conservation service output value makes up more than 70% of the industry-wide output value. In the industrial field, energy conservation services are mainly concentrated in recycling of waste heat / residual pressure, energy-saving of motor system, optimization of energy system, improvement of furnace / boiler, etc. Besides, construction, transportation and other fields also have great energy saving potentials e.g. China’s existing building energy-saving renovation market potential reached RMB4.434 trillion by the end of 2014.
Because of small assets scale and difficult financing, services provided by Chinese energy conservation service companies are mainly single energy conservation types with small amount of investment. However, with the expansion of financing channels and improvement of professional skill, an integrated solution covering energy saving, environmental protection and intellectualization for systems (including heating system, air conditioning and refrigeration system, lighting system, ventilation and air exchange system, water system and other subsystems) will become a trend.
China Energy Conservation Service Industry Report, 2015 mainly covers the following:
 Overview of energy conservation service industry, including definition, business model, EMC comparison between China and the US, PPP mode, etc.;
Operation of energy conservation service industry, including relevant policies, number of enterprises and employees, industry output value, EMC investment, applications, competition pattern, etc.;
Energy conservation service market segments, including status, market size, competition pattern, prospects, etc. of waste heat power generation / motor energy saving / building energy saving;
17 major players, including their profile, operating performance, revenue structure, gross margin, energy conservation services, development strategy, etc.
1. Overview of Energy-saving Service Sector
1.1 Definition and Business Model
1.1.1 Definition
1.1.2 Business Model
1.2 EMC/EPC
1.2.1 Overview
1.2.2 EPC in the US
1.2.3 EMC in China
1.2.4 Comparison between China and the US
2. Energy Saving Service Market Operation
2.1 Relevant Policies
2.2 Market Size
2.2.1 Number of Enterprises and Employees
2.2.2 Output Value
2.2.3 EMC Investment
2.3 Applications
2.4 Competition Pattern
3. Energy Saving Service Market Segments
3.1 Waste Heat to Power (WHP)
3.1.1 Market Status
3.1.2 Market Size
3.1.3 Competitive Landscape
3.1.4 Prospects
3.2 Motor Energy Saving
3.2.1 Market Overview
3.2.2 Market Size
3.3 Building Energy Saving
3.3.1 Market Profile
3.3.2 Market Size
3.3.3 Competition Pattern
4. Major Companies
4.1 Sinoma Energy Conservation Ltd.
4.1.1 Profile
4.1.2 Operating Performance
4.1.3 Revenue Structure
4.1.4 Gross Margin
4.1.5 Energy Conservation Services
4.1.6 Development Strategy
4.1.7 Prospects
4.2 China Southern Power Grid Comprehensive Energy Co., Ltd.
4.2.1 Profile
4.2.2 Business Model
4.2.3 Operating Performance
4.2.4 Energy Conservation Services
4.3 Beijing Kingtech Co., Ltd.
4.3.1 Profile
4.3.2 Operating Performance
4.3.3 Revenue Structure
4.3.4 Gross Margin
4.3.5 Top 5 Customers
4.3.6 Energy Conservation Services
4.4 Schneider Electric
4.4.1 Profile
4.4.2 Operating Performance
4.4.3 Revenue Structure
4.4.4 Gross Margin
4.4.5 Energy Conservation Services
4.4.6 Business in China
4.5 Guangzhou Zhiguang Electric Co., Ltd.
4.5.1 Profile
4.5.2 Operating Performance
4.5.3 Revenue Structure
4.5.4 Gross Margin
4.5.5 Energy Conservation Services
4.5.6 Development Strategy
4.6 Shuangliang Eco-Energy Systems Co., Ltd.
4.6.1 Profile
4.6.2 Operating Performance
4.6.3 Revenue Structure
4.6.4 Gross Margin
4.6.5 Energy Conservation Services
4.6.6 Development Strategy
4.7 Beijing Yuanshen Energy Saving Technology Co., Ltd.
4.8 Zhejiang Ecowell Energy Management Technology Co., Ltd.
4.8.1 Profile
4.8.2 Operating Performance
4.8.3 Revenue Structure
4.8.4 Gross Margin
4.8.5 Top 5 Customers
4.8.6 Energy Conservation Services
4.9 INVT Energy Management (Shenzhen) Co., Ltd.
4.10 Beijing ZNXY Energy & Environment Co., Ltd.
4.10.1 Profile
4.10.2 Operating Performance
4.10.3 Revenue Structure
4.10.4 Gross Margin
4.10.5 Top 5 Customers
4.10.6 Energy Conservation Services
4.11 Oriental Green Energy-Saving Environmental Protection Engineering Co., Ltd.
4.12 Beijing Dynamic Power Co., Ltd.
4.12.1 Profile
4.12.2 Operating Performance
4.12.3 Revenue Structure
4.12.4 Gross Margin
4.12.5 Energy Conservation Services
4.12.6 Development Strategy
4.13 East New Energy
4.13.1 Profile
4.13.2 Operating Performance
4.13.3 Revenue Structure
4.13.4 Gross Margin
4.13.5 Major Shareholding Companies
4.13.6 R & D
4.13.7 Major Cases
4.14 Zhejiang Dun'An Artificial Environment Co., Ltd.
4.14.1 Profile
4.14.2 Operating Performance
4.14.3 Revenue Structure
4.14.4 Gross Margin
4.14.5 R&D
4.14.6 Energy Conservation Services
4.15 Beijing SNTA Energy-Efficient Electric Co., Ltd.
4.16 Yantai Longyuan Power Technology Co., Ltd.
4.16.1 Profile
4.16.2 Operating Performance
4.16.3 Revenue Structure
4.16.4 Gross Margin
4.16.5 R&D
4.16.6 Energy Conservation Services
4.17 Shenwu Environmental Technology Co., Ltd
4.17.1 Profile
4.17.2 Operating Performance
4.17.3 Revenue Structure
4.17.4 Gross Margin
4.17.5 Energy Conservation Services
Number of Enterprises and YoY Growth in China Energy Conservation Service Industry, 2007-2018E
Number of Employees and YoY Growth in China Energy Conservation Service Industry, 2007-2018E
Output Value and YoY Growth in China Energy Conservation Service Industry, 2007-2018E
Average Output Value of Each Enterprise/Employee in China Energy Conservation Service Industry, 2007-2018E
Investment and YoY Growth of Chinese EMC Projects, 2007-2018E
Number of Chinese EMC Projects (by Technology), 2013
Energy Saving Capacity and YoY Growth of Chinese EMC Projects, 2007-2018E
High-efficiency Electrical Machine Sales and YoY Growth, 2013-2018E
China’s Building Energy Consumption Structure
Market Size and YoY Growth of China Building Energy Saving Industry, 2013-2018E
Revenue and YoY Growth of Sinoma Energy Conservation, 2010-2015
Net Income and YoY Growth of Sinoma Energy Conservation, 2010-2015
Revenue Structure of Sinoma Energy Conservation (by Business), 2010-2015
Revenue Structure of Sinoma Energy Conservation (by Region), 2010-2015
Gross Margin of Sinoma Energy Conservation (by Business), 2010-2015
Revenue and YoY Growth of Sinoma Energy Conservation, 2015-2018E
Major Co-partners of China Southern Power Grid Comprehensive Energy
Revenue and YoY Growth of China Southern Power Grid Comprehensive Energy, 2011-2018E
Net Income and YoY Growth of China Southern Power Grid Comprehensive Energy, 2011-2018E
Outlets of Kingtech
Revenue and YoY Growth of Kingtech, 2012-2018E
Net Income and YoY Growth of Kingtech, 2012-2018E
Revenue Structure of Kingtech by Business, 2012-2015
Gross Profit and Gross Margin of Kingtech by Business, 2012-2015
Employee of Schneider Electric by Region by the end of 2014
Revenue and YoY Growth of Schneider Electric, 2010-2015
Net Income and YoY Growth of Schneider Electric, 2010-2015
Revenue Structure of Schneider Electric by Business, 2010-2015
Revenue Structure of Schneider Electric by Region, 2010-2015
Gross Profit, YoY Growth and Gross Margin of Schneider Electric, 2010-2015
Schneider Electric’s Subsidiaries in China
Schneider Electric’s Revenue from China and YoY Growth, 2010-2018E
Revenue and YoY Growth of Guangzhou Zhiguang Electric, 2010-2015
Net Income and YoY Growth of Guangzhou Zhiguang Electric, 2010-2015
Revenue Structure of Guangzhou Zhiguang Electric by Business, 2010-2015
Revenue Structure of Guangzhou Zhiguang Electric by Region, 2010-2015
Gross Margin of Guangzhou Zhiguang Electric by Business, 2010-2015
Gross Margin of Guangzhou Zhiguang Electric by Region, 2010-2015
Sales Volume of Guangzhou Zhiguang Electric’s Main Products, 2010-2015
Revenue and YoY Growth of Guangzhou Zhiguang Electric, 2015-2018
Revenue and YoY Growth of Shuangliang Eco-Energy, 2010-2015
Net Income and YoY Growth of Shuangliang Eco-Energy, 2010-2015
Revenue Structure of Shuangliang Eco-Energy by Business, 2010-2015
Revenue Structure of Shuangliang Eco-Energy by Region, 2010-2015
Gross Margin of Shuangliang Eco-Energy by Business, 2010-2015
Revenue and YoY Growth of Zhejiang Ecowell, 2011-2018
Net Income and YoY Growth of Zhejiang Ecowell, 2011-2018E
Revenue Structure of Zhejiang Ecowell by Sector, 2011-2014
Revenue Structure of Zhejiang Ecowell by Region, 2011-2014
Gross Margin of Zhejiang Ecowell by Sector, 2011-2014
Main Financial Indicators of INVT Energy Management (Shenzhen), 2013-2014
Revenue and YoY Growth of Beijing ZNXY Energy & Environment, 2013-2018E
Net Income and YoY Growth of Beijing ZNXY Energy & Environment, 2013-2018E
Revenue Breakdown of Beijing ZNXY Energy & Environment (by Business), 2013-2015
Gross Margin of Beijing ZNXY Energy & Environment (by Business), 2013-2015
Cost Structure of EMC Projects of Beijing ZNXY Energy & Environment, 2013-2014
China’s Fixed-Asset Investment and YoY Growth, 2013-2015
China’s Import/Export Scale and YoY Growth, 2013-2015
China’s Total Retail Sales of Consumer Goods and YoY Growth, 2013-2015
Main Business Models of Energy-saving Service Sector
US Innovation in Energy-saving Service Sector and Effect
Funding Sources of EMC Projects in China
EMC Comparison between China and the US
Policies on China Energy Saving Service Industry, 2006-2015
Energy-Saving Capacity of Key Energy Saving & Emission Reduction Projects during the 12th Five-Year Plan Period
Average EMC Contract Size in Each Sector and Sectoral Share in Total, 2010-2011
Market Share of Chinese Energy Conservation Service Projects (by Application), 2013-2014
Top 30 Enterprises in China Energy Conservation Service Industry (by Energy Saving Capacity), 2013
Number of Employees/Output Value/EMC Project Investment of Top 100 Enterprises in China Energy Conservation Service Industry (by Energy Saving Capacity), 2011-2014
Revenue / EMC Project Investment of Top 100 Enterprises in China Energy Conservation Service Industry (by Assets), 2013
Revenue / EMC Project Investment of Top 100 Enterprises in China Energy Conservation Service Industry (by Corporate Nature), 2013
EMC Project Energy Saving Capacity of Top 100 Enterprises in China Energy Conservation Service Industry (by Model and Industry), 2013
New Cement Production Lines and Added Capacity in China, 2007-2014
Number and Investment in China of Cement Production Lines Equipped with WHP Facilities, 2010-2018E
WHP Revenue of Major Enterprises in China, 2010-2015
China’s Potential Market Size of Industrial WHP Excluding Cement
Main Paths for Electrical Machine Energy Saving
High-efficiency Electrical Machine Promotion Targets in China, 2013-2015
High-efficiency Electrical Machine Production Targets in China, 2013-2015
Market Capacity of Electrical Machine System Energy-saving Technical Retrofit
Domestic Companies Engaged in Motor Energy Saving
Revenue of Motor Energy Saving Business
China’s Newly-built Energy Saving Building Area and Cumulative Built-up Energy Saving Building Area, 2010-2018E
China’s Existing Building Energy-Saving Renovation Market Potential as of End-2014
Building Energy Saving Revenue of Major Manufacturers in China, 2010-2015
Number of Employees of Sinoma Energy Conservation (by Professional and Educational Background), 2013-2014
Number of Production Lines and Installed Capacity of New Cogeneration Projects (by Business Model) of Sinoma Energy Conservation, 2008-2014
Business Model of China Southern Power Grid Comprehensive Energy
Completed Energy Conservation Service Projects of China Southern Power Grid Comprehensive Energy, 2014-2015
Kingtech’s Revenue from Top5 Customers, 2014-2015
Main Business of Schneider Electric
Schneider Electric (China) Co Ltd. is Schneider Electric’s subsidiary that engages in energy saving service business in China.
Newly-signed Energy Saving Service Projects of Guangzhou Zhiguang Electric, 2014-2015
Main Business of Beijing Yuanshen Energy Saving Technology
Revenue from Zhejiang Ecowell’s Top 5 Customers, 2013-2014
Zhejiang Ecowell’s Major Energy-saving Services
Zhejiang Ecowell’s Energy Performance Contracting Projects and Electricity Saving Amount, 2011-2014
Raw Material Procurement of Zhejiang Ecowell by Product, 2011-2014
Main Business of INVT Energy Management (Shenzhen)
Main Successful Cases of INVT Energy Management (Shenzhen)
Beijing ZNXY Energy & Environment’s Sales from Top 5 Customers, 2014-2015
Energy Saving Service Business of Beijing ZNXY Energy & Environment
In-Production EMC Projects of Beijing ZNXY Energy & Environment, 2013-2014
Energy Savings of Oriental Green Energy-Saving Environmental Protection Engineering, 2013-2014
Revenue and YoY Growth of Beijing Dynamic Power, 2010-2015
Net Income and YoY Growth of Beijing Dynamic Power, 2010-2015
Revenue of Beijing Dynamic Power by Product, 2010-2015
Revenue of Beijing Dynamic Power by Region, 2010-2015
Consolidated Gross Margin of Beijing Dynamic Power, 2010-2015
Gross Margin of Beijing Dynamic Power by Product, 2010-2015
Major Energy Conservation Service Subsidiaries of Beijing Dynamic Power, 2015
Revenue and YoY Growth of East New Energy, 2010-2015
Net Income and YoY Growth of East New Energy, 2010-2015
Revenue of East New Energy by Product, 2010-2015
Consolidated Gross Margin of East New Energy, 2010-2015
Gross Margin of East New Energy by Product, 2010-2015
Major Shareholding Companies and Net Income of East New Energy, H1 2015
Revenue and YoY Growth of Zhejiang Dun'An Artificial Environment, 2010-2015
Net Income and YoY Growth of Zhejiang Dun'An Artificial Environment, 2010-2015
Revenue Breakdown of Zhejiang Dun'An Artificial Environment by Product, 2010-2015
Revenue Breakdown of Zhejiang Dun'An Artificial Environment by Region, 2010-2015
Consolidated Gross Margin of Zhejiang Dun'An Artificial Environment, 2010-2015
Gross Margin of Zhejiang Dun'An Artificial Environment by Product, 2010-2015
R&D Costs and % of Total Revenue of Zhejiang Dun'An Artificial Environment, 2010-2015
Main Projects of Zhejiang Dun'An Artificial Environment, 2014-2015
Revenue and YoY Growth of Yantai Longyuan Power Technology, 2010-2015
Net Income YoY Growth of Yantai Longyuan Power Technology, 2010-2015
Revenue Breakdown of Yantai Longyuan Power Technology by Product, 2010-2015
Revenue Breakdown of Yantai Longyuan Power Technology by Region, 2010-2014
Consolidated Gross Margin of Yantai Longyuan Power Technology, 2010-2015
Gross Margin of Yantai Longyuan Power Technology by Product, 2010-2015
R&D Costs and % of Total Revenue of Yantai Longyuan Power Technology, 2010-2015
Output and Sales Volume of Energy-efficient and Environment-friendly Products, 2013-2014
New Order and Execution of Energy Saving and Environmental Protection Projects of Yantai Longyuan Power Technology, 2015H1
Revenue and YoY Growth of Shenwu Environmental Technology, 2010-2015
Net Income and YoY Growth of Shenwu Environmental Technology, 2010-2015
Revenue Breakdown of Shenwu Environmental Technology by Product, 2010-2015
Consolidated Gross Margin of Shenwu Environmental Technology, 2010-2015
Gross Margin of Shenwu Environmental Technology by Product, 2010-2015
Global and China Wind Farm O&M Industry Report, 2017-2021
As the wind power installed capacity grows and the warranty period of a large number of wind turbines is coming to an end, wind farm O & M has become the focus of the industry. In 2016, the global...
Global and China Electrical Energy Storage (EES) Industry Report, 2016-2020
Energy storage finds widespread application in power system, involving power generation, transmission, distribution, and end users. Global cumulative installed capacity of electrical energy storage (E...
Global and China Wind Farm Operation and Maintenance Industry Report, 2015-2018
In 2014, the global wind farm O & M market size hit USD9.25 billion, representing a year-on-year growth rate of 25.8%; by 2018, the market size is expected to reach USD13.78 billion. The mainstrea...
China Energy Storage for Grid System Industry Report, 2015-2018
Energy storage finds wide application in electric power system, involving all aspects of power generation, transmission, distribution and end user. Technically, energy storage for grid system can be d...
China Energy Conservation Service Industry Report, 2015
Energy conservation service industry provides service and support for enterprises and projects in terms of energy conservation and emission reduction. An Energy Service Company, more commonly referred...
China Natural Gas Fueling Station Equipment Industry Report, 2015-2018
According to different fuels used by natural gas stations, gas station equipment can be divided into compressed natural gas (CNG) station equipment and liquefied natural gas (LNG) station equipment. T...
China Filling Station and Gas Station Industry Report,2015-2018
Filling Stations By the end of 2014, China had run a total of 99,000 filling stations, each of which served 1,456 civilian cars; Shandong, Hebei, Henan, Guangdong and Jiangsu ranked top five by the nu...
China Biodiesel Industry Report, 2014-2017
Biodiesel refers to a renewable diesel fuel made from oil crops, animal fats, food waste oil that can substitute petroleum diesel and has environmental protection, safety, renewability and other advan...
China Filling Station And Refueling Station Industry Report,2013-2016
By the end of 2012, China has had a total of 96,313 filling stations, an increase of 875 or up 0.92% compared to 2011, including 51,854 SOE filling stations (53.8% of the total), 42,425 private fillin...