China Energy Storage for Grid System Industry Report, 2015-2018
-
Sep.2015
- Hard Copy
- USD
$2,400
-
- Pages:94
- Single User License
(PDF Unprintable)
- USD
$2,200
-
- Code:
HK062
- Enterprise-wide License
(PDF Printable & Editable)
- USD
$3,400
-
- Hard Copy + Single User License
- USD
$2,600
-
Energy storage finds wide application in electric power system, involving all aspects of power generation, transmission, distribution and end user. Technically, energy storage for grid system can be divided into mechanical energy storage, chemical energy storage and electromagnetic energy storage, including the widely used pumped storage under mechanical energy storage, as well as sodium-sulfur batteries, lithium batteries and lead-acid batteries which belong to the scope of chemical energy storage.
In the past five years, the global installed capacity of energy storage for grid system (excluding pumped storage, compressed air storage and thermal storage) has maintained the growth rate of around 20%, hitting 840MW in 2014. By technology, sodium-sulfur batteries and lithium-ion batteries occupy 75% of the global installed capacity together as the mainstream.
In 2014, China’s installed capacity of energy storage for grid system (excluding pumped storage, compressed air storage and thermal storage) accounted for about 10% of the world, up over 50% from 2013; meanwhile , China’s development pace was far higher than the global growth rate. Unlike foreign counterparts, China emphasizes lithium-ion batteries which share 71% of China’s total installed capacity, followed by the lead-acid batteries with about 14%.
To create a clean, sustainable future, the Chinese government is shifting its focus in policy to clean energy technology. As of the end of 2014, China's wind power generation installed capacity had reached 114.6GW, becoming the third power source in China following thermal power and hydropower. Meanwhile, China had seen the photovoltaic (PV) power generation installed capacity of 28.1GW, overtaking the United States as the world’s largest PV market. In 2014, the demand of Chinese grid-connected wind power and PV for energy storage equaled to 5.7GW and 3.5GW respectively.
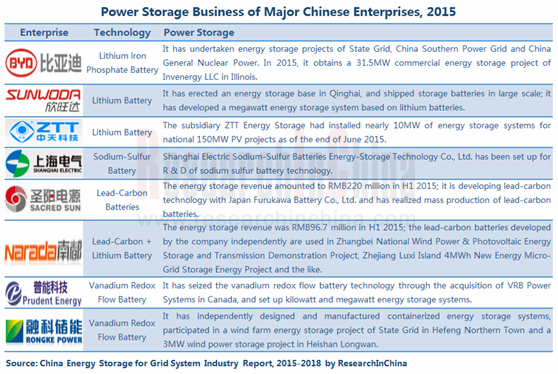
Now, there has been scores of energy storage enterprises in China. Among them, BYD, China Aviation Lithium Battery Co., Ltd. and Sunwoda Electronic Co., Ltd. employ lithium battery energy storage technology; Zhejiang Narada Power Source Co., Ltd. and Shandong Sacred Sun Power Sources Co., ltd. adopt lead-acid battery technology; Dalian Rongke Power Co. Ltd and Prudent Energy Inc. depend on fluid flow battery technology; Shanghai Electric Group Co., Ltd. and Sieyuan Electric Co., Ltd. resort to sodium-sulfur energy storage technology.
The report is mainly concerned with the followings:
 Development environment, trends, etc. of energy storage for grid system in China;
Current situation and prediction of energy storage for grid system in China, like market size, competitive landscape, , etc.;
Status quo and forecast for energy storage applications in China;
Operation and business analysis of 21 major energy storage companies in China and the world.
1 Overview of Energy Storage for Grid System
1.1 Definition and Classification
1.2 Application
1.3 Industrial Chain
1.4 Existing Problems
2 Status Quo of Energy Storage for Grid System in China
2.1 Policy Environment
2.2 Technology Environment
2.3 Scale of Energy Storage
2.3.1 Global Market
2.3.2 Chinese Market
2.4 Competition Pattern
2.4.1 Competition among Enterprises
2.4.2 Pumped Storage
2.4.3 Lithium Battery
2.4.4 Flywheel Energy Storage
2.4.5 Liquid Flow Battery Energy Storage
2.4.6 Compressed Air Energy Storage
2.4.7 Sodium-sulfur Battery
3 Applications of Energy Storage for Grid System in China
3.1 Wind Power Generation
3.2 PV Power Generation
3.3 Distributed Power Generation and Micro-grid
3.4 Peak Shaving
4 World’s Renown Energy Storage Companies
4.1 Alstom power
4.1.1 Profile
4.1.2 Operation
4.1.3 Energy Storage Business
4.2 Axion Power
4.2.1 Profile
4.2.2 Energy Storage Business
4.3 Beacon power
4.3.1 Profile
4.3.2 Energy Storage Business
4.4 GE
4.4.1 Profile
4.4.2 Operation
4.4.3 Energy Storage Business
4.5 Maxwell Technologies
4.5.1 Profile
4.5.2 Operation
4.5.3 Energy Storage Business
4.6 Altairnano Technologies
4.6.1 Profile
4.6.2 Energy Storage Business
4.7 Summary
5 Leading Chinese Energy Storage Companies
5.1 Shandong Sacred Sun Power Source Co., Ltd.
5.1.1 Profile
5.1.2 Operation
5.1.3 Revenue Structure
5.1.4 Gross Margin
5.1.5 Energy Storage Business
5.1.6 Outlook and Forecast
5.2 Zhejiang Narada Power Source Co., Ltd.
5.2.1 Profile
5.2.2 Operation
5.2.3 Revenue Structure
5.2.4 Gross Margin
5.2.5 Energy Storage Business
5.2.6 Outlook and Forecast
5.3 Shenzhen Inovance Technology Co., Ltd.
5.3.1 Profile
5.3.2 Operation
5.3.3 Energy Storage Business
5.4 Zhongtian Technology Co., Ltd.
5.4.1 Profile
5.4.2 Operation
5.4.3 Revenue Structure
5.4.4 Gross Margin
5.4.5 Energy Storage Business
5.4.6 Outlook and Forecast
5.5 Fengfan Co., Ltd.
5.5.1 Profile
5.5.2 Operation
5.5.3 Revenue Structure
5.5.4 Gross Margin
5.5.5 Energy Storage Business
5.5.6 Outlook and Forecast
5.6 BYD
5.6.1 Profile
5.6.2 Operation
5.6.3 Revenue Structure
5.6.4 Gross Margin
5.6.5 Energy Storage Business
5.6.6 Outlook and Forecast
5.7 Sungrow Power Supply Co., Ltd.
5.7.1 Profile
5.7.2 Operation
5.7.3 Revenue Structure
5.7.4 Gross Margin
5.7.5 Energy Storage Business
5.7.6 Outlook and Forecast
5.8 Shanghai Electric Co., Ltd
5.8.1 Profile
5.8.2 Revenue
5.8.3 Energy Storage Business
5.9 Sunwoda Electronic Co., Ltd.
5.9.1 Profile
5.9.2 Revenue
5.9.3 Revenue Structure
5.9.4 Gross Margin
5.9.5 Energy Storage Business
5.9.6 Outlook and Forecast
5.10 Shenzhen Clou Electronics Co., Ltd.
5.10.1 Profile
5.10.2 Operation
5.10.3 Revenue Structure
5.10.4 Gross Margin
5.10.5 Energy Storage Business
5.10.6 Outlook and Forecast
5.11 Prudent Energy
5.11.1 Profile
5.11.2 Energy Storage Business
5.12 RAY Power
5.12.1 Profile
5.12.2 Energy Storage Business
5.13 Dalian Rongke Power Co., Ltd.
5.13.1 Profile
5.13.2 Energy Storage Business
5.14 Shandong Realforce Enterprises Co., Ltd
5.14.1 Profile
5.14.2 Energy Storage Business
5.15 China Aviation Lithium Battery Co., Ltd.
5.15.1 Profile
5.15.2 Energy Storage Business
6 Summary and Prediction
6.1 Summary
6.2 Prediction
Classification of Energy Storage Technologies
Applications of Energy Storage
Application of Energy Storage in Smart Grid
Application of Energy Storage in Electric Power System
Energy Storage Industry Chain
Policies about Energy Storage Industry in China
Technical Indicators of Currently Mainstream Energy Storage Devices for Grid System (I)
Technical Indicators of Currently Mainstream Energy Storage Devices for Grid System (II)
Cumulatively Installed Capacity of Energy Storage Worldwide, 2009-2015
Shares of Major Technology Roadmaps for Global Energy Storage System in 2014
Cumulatively Installed Capacity of Energy Storage in China, 2011-2015
Distribution of Energy Storage Projects by Regions in China, 2014
Distribution of Applications of Energy Storage for Power System in China, 2014
The Leading Energy Storage Enterprises and Technology Roadmaps in China
Installed Capacity of Pumped Storage in China, 2010-2015
Chinese Vanadium Battery Enterprises and Their Business Scope
Windpower Installed Capacity in China, 2009-2015
Windpower Energy Storage Demand, 2009-2015
PV Installed Capacity in China, 2009-2015
Energy Storage Demand of PV Power Generation in China, 2009-2015
Revenue and Net Income of Alstom, FY2010-FY2014
Revenue of Alstom (by Products), 2011-2013
Revenue and Net Income of GE, 2011-2015
Revenue of GE (by Division), 2013-2015
Revenue and Net Income of Maxwell, 2011-2015
Revenue Structure of Maxwell (by Products), 2012-2014
World’s Famous Energy Storage Companies
Revenue and Net Income of Sacred Sun, 2011-2015
Revenue of Sacred Sun (by Products), 2013-2015
Revenue Structure of Sacred Sun (by Products), 2013-2015
Revenue of Sacred Sun (by Regions), 2013-2015
Revenue Structure of Sacred Sun (by Regions), 2013-2015
Gross Margin of Sacred Sun (by Products), 2013-2015
Key Energy Storage Projects of Sacred Sun, 2013-2015
Revenue and Net Income of Sacred Sun, 2014-2018E
Revenue and Net Income of Zhejiang Narada Power Source, 2011-2015
Revenue of Zhejiang Narada Power Source (by Sector), 2013-2015
Revenue Structure of Zhejiang Narada Power Source (by Sector), 2013-2015
Revenue of Zhejiang Narada Power Source (by Products), 2013-2014
Revenue Structure of Zhejiang Narada Power Source (by Products), 2013-2014
Revenue of Zhejiang Narada Power Source (by Regions), 2012-2014
Revenue Structure of Zhejiang Narada Power Source (by Regions), 2012-2014
Gross Margin of Zhejiang Narada Power Source (by Sector), 2013-2015
Gross Margin of Zhejiang Narada Power Source (by Products), 2013-2014
Some Energy Storage Projects Won with Lead Carbon Battery Technology Roadmap of Zhejiang Narada Power Source
Revenue and Net Income of Zhejiang Narada Power Source, 2014-2018E
Revenue and Net Income of Shenzhen Inovance Technology, 2011-2015
Revenue and Net Income of Zhongtian Technology, 2011-2015
Revenue of Zhongtian Technology (by Products), 2013-2015
Revenue Structure of Zhongtian Technology (by Products), 2013-2015
Revenue of Zhongtian Technology (by Regions), 2013-2015
Revenue Structure of Zhongtian Technology (by Regions), 2013-2015
Gross Margin of Zhongtian Technology (by Products), 2013-2015
Revenue and Net Income of ZTT Energy Storage Technology, 2013-2015
Revenue and Net Income of Zhongtian Technology, 2014-2018E
Revenue and Net Income of Fengfan Co., Ltd., 2011-2015
Revenue of Fengfan Co., Ltd. (by Products), 2013-2015
Revenue Structure of Fengfan Co., Ltd. (by Products), 2013-2015
Revenue of Fengfan Co., Ltd. (by Regions), 2013-2015
Revenue Structure of Fengfan Co., Ltd. (by Regions), 2013-2015
Gross Margin of Fengfan Co., Ltd. (by Products), 2013-2015
Revenue and Net Income of Fengfan Co., Ltd., 2014-2018E
Revenue and Net Income of BYD, 2011-2015
Revenue of BYD (by Products), 2013-2015
Revenue Structure of BYD (by Products), 2013-2015
Revenue of BYD (by Regions), 2013-2015
Revenue Structure of BYD (by Regions), 2013-2015
Gross Margins of BYD’s Main Products, 2013-2015
Revenue and Net Income of BYD, 2014-2018E
Revenue and Net Income of Sungrow Power Supply, 2011-2015
Revenue of Sungrow Power Supply (by Products), 2013-2015
Revenue Structure of Sungrow Power Supply (by Products), 2013-2015
Revenue of Sungrow Power Supply (by Regions), 2013-2015
Revenue Structure of Sungrow Power Supply (by Regions), 2013-2015
Gross Margin of Sungrow Power Supply (by Products), 2013-2015
Revenue and Net Income of Sungrow Power Supply, 2014-2018E
Revenue and Net Income of Shanghai Electric, 2011-2015
Revenue and Net Income of Sunwoda Electronic, 2011-2015
Revenue of Sunwoda Electronic (by Products), 2013-2015
Revenue Structure of Sunwoda Electronic (by Products), 2013-2015
Revenue of Sunwoda Electronic (by Regions), 2013-2015
Revenue Structure of Sunwoda Electronic (by Regions), 2013-2015
Gross Margin of Sunwoda Electronic (by Products), 2013-2015
Revenue and Net Income of Sunwoda Electronic, 2014-2018E
Revenue and Net Income of Shenzhen Clou Electronics, 2011-2015
Revenue of Shenzhen Clou Electronics (by Products), 2013-2015
Revenue Structure of Shenzhen Clou Electronics (by Products), 2013-2015
Revenue of Shenzhen Clou Electronics (by Regions), 2013-2015
Revenue Structure of Shenzhen Clou Electronics (by Regions), 2013-2015
Gross Margin of Shenzhen Clou Electronics (by Products), 2013-2015
Revenue and Net Income of Shenzhen Clou Electronics, 2014-2018E
KW-level VRB Energy Storage System Application Projects of Prudent Energy
MW-level VRB Energy Storage System Application Projects of Prudent Energy
Key Energy Storage Projects of Rongke Power
Electric Power and Energy Storage Scale in China, 2009-2014
Cumulatively Installed Capacity of Energy Storage for Grid System in China, 2014-2018
Electric Power and Energy Storage Scale in China, 2014-2018
Global and China Wind Farm O&M Industry Report, 2017-2021
As the wind power installed capacity grows and the warranty period of a large number of wind turbines is coming to an end, wind farm O & M has become the focus of the industry. In 2016, the global...
Global and China Electrical Energy Storage (EES) Industry Report, 2016-2020
Energy storage finds widespread application in power system, involving power generation, transmission, distribution, and end users. Global cumulative installed capacity of electrical energy storage (E...
Global and China Wind Farm Operation and Maintenance Industry Report, 2015-2018
In 2014, the global wind farm O & M market size hit USD9.25 billion, representing a year-on-year growth rate of 25.8%; by 2018, the market size is expected to reach USD13.78 billion. The mainstrea...
China Energy Storage for Grid System Industry Report, 2015-2018
Energy storage finds wide application in electric power system, involving all aspects of power generation, transmission, distribution and end user. Technically, energy storage for grid system can be d...
China Energy Conservation Service Industry Report, 2015
Energy conservation service industry provides service and support for enterprises and projects in terms of energy conservation and emission reduction. An Energy Service Company, more commonly referred...
China Natural Gas Fueling Station Equipment Industry Report, 2015-2018
According to different fuels used by natural gas stations, gas station equipment can be divided into compressed natural gas (CNG) station equipment and liquefied natural gas (LNG) station equipment. T...
China Filling Station and Gas Station Industry Report,2015-2018
Filling Stations By the end of 2014, China had run a total of 99,000 filling stations, each of which served 1,456 civilian cars; Shandong, Hebei, Henan, Guangdong and Jiangsu ranked top five by the nu...
China Biodiesel Industry Report, 2014-2017
Biodiesel refers to a renewable diesel fuel made from oil crops, animal fats, food waste oil that can substitute petroleum diesel and has environmental protection, safety, renewability and other advan...
China Filling Station And Refueling Station Industry Report,2013-2016
By the end of 2012, China has had a total of 96,313 filling stations, an increase of 875 or up 0.92% compared to 2011, including 51,854 SOE filling stations (53.8% of the total), 42,425 private fillin...