China Aquaculture Industry Report, 2015-2018
-
Oct.2015
- Hard Copy
- USD
$2,700
-
- Pages:140
- Single User License
(PDF Unprintable)
- USD
$2,550
-
- Code:
ZLC025
- Enterprise-wide License
(PDF Printable & Editable)
- USD
$3,900
-
- Hard Copy + Single User License
- USD
$2,900
-
With the improvement of cultivation technology and the steady growth in per-capita consumption of aquatic products, both the output value of Chinese fishery industry and the output of aquatic products keep growing year after year. In 2014, the gross output value of China’s fishing industry amounted to RMB2.0859 trillion, and the added value was up to RMB971.8 billion; the national output of aquatic products totaled 64.615 million tons, a rise of 4.7% from a year earlier, of which the output of aquaculture reported 47.484 million tons, up 4.6% year on year.
Freshwater culture is the main part of aquaculture in China, with its output holding more than 60%. In 2014, the freshwater cultured output reached 29,357.6 kt, accounting for 61.8%; and mariculture output hit 18,126.5 kt, occupying 38.2%. In freshwater aquiculture, fishes are the primary varieties, making up about 88% of total output of freshwater culture; while in mariculture, the shellfishes see the highest output, an above-70% share of total output of seaculture.
The regions like Guangdong, Shandong, Fujian, Jiangsu and Hubei are the key aquaculture provinces in China, with their total output sweeping over 50% of national output. Elaborately, Guangdong is the largest province in terms of aquaculture, with equal output of freshwater culture to that of mariculture; Fujian and Shandong give priority to seaculture; while Jiangsu and Hubei are mainly involved in freshwater breeding.
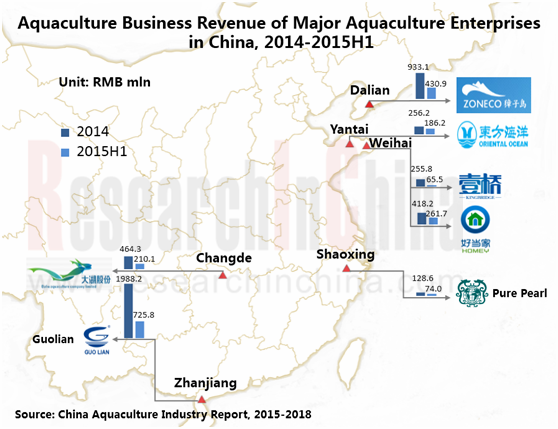
Chinese aquaculture industry is composed of individual farmers, cooperatives and enterprises, among which aquaculture enterprises are in the advantageous position in competition, but with inadequate power of exerting influence on the market. Chinese aquaculture companies consist mainly of ZONECO Group, Zhanjiang Guolian Aquatic Products Co., Ltd, Dalian Yi Qiao Sea Cucumber Co., Ltd, Shandong Oriental Ocean Sci-Tech Co., Ltd., Shandong Homey Aquatic Development Co., Ltd., Pure Pearl Group Co., Ltd and Dahu Aquaculture Company Limited. In 2014, the total aquaculture output of ZONECO Group, Zhanjiang Guolian Aquatic Products Co., Ltd and Dalian Yi Qiao Sea Cucumber Co., Ltd was merely 82.65 kt, just making up 0.174%.
Zhanjiang Guolian Aquatic Products Co., Ltd is China’s state-level penaeusvannamei genetics & breeding center, with the revenue from aquaculture business in 2014 reaching RMB1.988 billion with a share of 0.23% in Chinese aquaculture market. The company is now endeavoring to transfer to be a global aquatic marketing platform and aquatic food maker; also, it strengthens the domestic market construction and brand promotion.
ZONECO Group is primarily focused on seaculture business, boasting the largest clear seawaters in China. In 2014, the aquaculture output of the company was up to 53.43 kt, sharing 0.113% of national total output in the same period. In August 2015, the company publicized the preplan of non-public offering of shares and planned to raise RMB1.45 billion for fingerling platform construction project, O2O new business model construction project and otherwise, in a bid to accelerate its transition towards a food enterprise.
Dahu Aquaculture Company Limited is the largest freshwater fish base and in possession of about 1.8 million mu (1mu=1/15 hec.) of water area in China, making up 4.9% of the area of reservoirs and lakes with aquaculture across the country. It has been focusing on the construction of its marketing network and comprehensive industrial chain by means of acquisitions and capital increase over the recent two years.
China Aquaculture Industry Report, 2015-2018 highlights the following:
 Development environment of China aquaculture industry report, involving industrial policy, residents’ consumption, the development of upstream and downstream sectors, etc.;
Development overview of China aquaculture industry, including status quo, mariculture, freshwater aquaculture, aquatic fingerlings, import & export, competitive landscape, prediction and outlook, etc.;
Development overview of key aquaculture regions (like Guangdong, Shandong, Fujian, Jiangsu and Hubei) in China, and the development of medium- and high-end aquatic products (such as abalone, sea cucumber, prawn, tilapia);
Operation, developments and so forth of 15 Chinese aquaculture companies.
1. Overview of Aquaculture Industry
1.1 Basic Concepts
1.2 Product Types
1.2.1 Regular Aquatic Products
1.2.2 Famous Products
1.2.3 Superior Products for Export
2 Development Environments of China Aquaculture Industry
2.1 Policies
2.2 Consumption of Residents
2.3 Upstream and Downstream
2.3.1 Upstream
2.3.2 Downstream
3 Development of China Aquaculture Industry
3.1 Status Quo
3.2 Mariculture
3.2.1 Overview
3.2.2 Regional Structure
3.2.3 Product Structure
3.2.4 Breeding Mode
3.3 Freshwater Aquaculture
3.3.1 Overview
3.3.2 Regional Structure
3.3.3 Product Structure
3.3.4 Breeding Mode
3.4 Aquatic Fingerlings
3.5 Import and Export
3.6 Competition Pattern
3.7 Anticipation and Prospect
3.7.1 Aquaculture
3.7.2 Consumption of Aquatic Products
4 Main Aquaculture Regions in China
4.1 Fujian
4.1.1 Overview
4.1.2 Aquaculture
4.2 Jiangsu
4.2.1 Overview
4.2.2 Aquaculture
4.3 Shandong
4.3.1 Overview
4.3.2 Aquaculture
4.4 Liaoning
4.4.1 Overview
4.4.2 Aquaculture
4.5 Guangdong
4.5.1 Overview
4.5.2 Aquaculture
4.6 Zhejiang
4.6.1 Overview
4.6.2 Aquaculture
4.7 Hubei
4.7.1 Overview
4.7.2 Aquaculture
4.8 Hunan
4.8.1 Overview
4.8.2 Aquaculture
5 Development of Medium and High-end Aquatic Products In China
5.1 Abalone
5.2 Sea Cucumber
5.3 Scallop
5.4 Urchin
5.5 Conch
5.6 Penaeus Vannamei
5.7 Tilapia
5.8 Pearl
6 Key Enterprises
6.1 Dalian Yi Qiao Sea Cucumber Co., Ltd.
6.1.1 Profile
6.1.2 Operation
6.1.3 Revenue Structure
6.1.4 Gross Margin
6.1.5 Supply and Marketing
6.1.6 R & D and Investment
6.1.7 Anticipation and Prospect
6.2 Zhanjiang Guolian Aquatic Products Co., Ltd.
6.2.1 Profile
6.2.2 Operation
6.2.3 Revenue Structure
6.2.4 Gross Margin
6.2.5 R & D and Investment
6.2.6 Production and Marketing
6.2.7 Anticipation and Prospect
6.3 ZONECO Group
6.3.1 Profile
6.3.2 Operation
6.3.3 Revenue Structure
6.3.4 Gross Margin
6.3.5 R & D and Investment
6.3.6 Production and Marketing
6.3.7 Anticipation and Prospect
6.4 Shandong Oriental Ocean Sci-Tech Co., Ltd.
6.4.1 Profile
6.4.2 Operation
6.4.3 Revenue Structure
6.4.4 Gross Margin
6.4.5 R & D and Investment
6.4.6 Anticipation and Prospect
6.5 Shandong Homey Aquatic Development Co., Ltd.
6.5.1 Profile
6.5.2 Operation
6.5.3 Revenue Structure
6.5.4 Gross Margin
6.5.5 R & D and Investment
6.5.6 Anticipation and Prospect
6.6 Pure Pearl Group Co., Ltd.
6.6.1 Profile
6.6.2 Operation
6.6.3 Revenue Structure
6.6.4 Gross Margin
6.6.5 Investment
6.6.6 Anticipation and Prospect
6.7 Dahu Aquaculture Company Limited
6.7.1 Profile
6.7.2 Operation
6.7.3 Revenue Structure
6.7.4 Gross Margin
6.7.5 Investment
6.7.6 Anticipation and Prospect
6.8 Hubei Wuchangyu Co., Ltd.
6.8.1 Profile
6.8.2 Operation
6.8.3 Aquaculture Business
6.9 Guangdong Haid Group Co., Ltd.
6.9.1 Profile
6.9.2 Operation
6.9.3 Revenue Structure
6.9.4 Gross Margin
6.9.5 R & D and Investment
6.9.6 Production and Marketing
6.9.7 Anticipation and Prospect
6.10 Baiyang Aquatic Group, Inc.
6.10.1 Profile
6.10.2 Operation
6.10.3 Revenue Structure
6.10.4 Investment
6.10.5 Anticipation and Development
6.11 Ningbo Tech-Bank Co., Ltd.
6.11.1 Profile
6.11.2 Operation
6.11.3 Revenue Structure
6.11.4 Aquafeed Business
6.11.5 Anticipation and Development
6.12 Tongwei Group Co., Ltd.
6.12.1 Profile
6.12.2 Operation
6.12.3 Revenue Structure
6.12.4 Aquafeed Business
6.12.5 Anticipation and Prospect
6.13 Guangzhou LUXE Seafood ENT.Ltd.
6.13.1 Profile
6.13.2 Operation
6.13.3 Development Strategy
6.14 Xunshan Group
6.14.1 Profile
6.14.2 Operation
6.14.3 Development Strategy
6.14.4 R & D
6.15 Dalian RainLion Group
6.15.1 Profile
6.15.2 Operation
6.15.3 Development Strategy
Aquaculture Industry Chain
Policies about Aquaculture Industry in China
Per-capita Ownership of Aquatic Products in China, 2006-2014
Per-capita Full-year Purchased Volume of Aquatic Products by Urban and Rural Chinese, 2006-2014
China’s Aquafeed Output, 2006-2014
Output Value and Added Value of China Aquafeed Industry, 2006-2014
Output Value and Added Value of China Fishery Drug Industry, 2006-2014
Output Value and Added Value of China Aquatic Product Circulation Industry, 2006-2014
Output Value and Added Value of China Aquatic Product Warehouse and Transportation Industry, 2006-2014
Output Value and Added Value of China Aquatic Product Processing Industry, 2006-2014
China’s Processing Quantity of Aquatic Products and Capacity Utilization, 2006-2014
China's Fishery Output Value and Added Value, 2012- 2014
China's Aquaculture Output and Breeding Area, 2012- 2014
China's Mariculture Output Value and Added Value, 2006- 2014
China's Mariculture Output and Breeding Area, 2012- 2014
China's Mariculture Output Share (by Region), 2014
China's Mariculture Output (by Product), 2007- 2014
Output Share of China's Mariculture (by Product), 2007- 2014
China's Mariculture Area (by Product), 2012- 2014
China's Mariculture Area Structure (by Product), 2012- 2014
China's Mariculture Output (by Breeding Waters), 2007- 2014
China's Mariculture Output (by Breeding Mode), 2008- 2014
China's Freshwater Aquaculture Output Value and Added Value, 2006- 2014
China's Freshwater Aquaculture Output and Breeding Area, 2012- 2014
Output Share of China's Freshwater Aquaculture (by Region), 2014
China's Freshwater Aquaculture Output (by Product), 2007- 2014
Output Share of China's Freshwater Aquaculture (by Product), 2007- 2014
China's Freshwater Breeding Area (by Breeding Waters), 2012- 2014
China's Freshwater Breeding Area Structure (by Breeding Waters), 2012- 2014
China's Freshwater Aquaculture Output (by Breeding Waters), 2007- 2014
China's Freshwater Aquaculture Output (by Breeding Mode), 2007- 2014
Output Value and Added Value of Chinese Aquatic Fingerlings, 2006- 2014
Output of Chinese Seawater Fingerlings (by Product), 2008- 2014
Output of Chinese Freshwater Fingerlings (by Product), 2008- 2014
Import and Export Volume of Aquatic Products in China, 2006- 2015
Import and Export Value of Aquatic Products in China, 2006-2015
Average Import and Export Price of Aquatic Products in China, 2006-2014
Export Volume and Value of Main Aquatic Products in China, 2014
Major Export Destinations of Main Aquatic Products in China by Export Volume and Value, 2014
Major Exporting Provinces of Main Aquatic Products in China by Export Volume and Value, 2014
Aquatic Product Output and Share of Major Aquaculture Enterprises in China, 2013- 2014
Aquaculture Revenue and Market Share of Major Aquaculture Enterprises in China, 2014
China's Mariculture Output and Breeding Area, 2012-2018E
China's Freshwater Aquaculture Output and Breeding Area, 2012-2018E
Per Capita Ownership and Consumption of Aquatic Products in China, 2014-2018E
Fujian's Aquaculture Output (by Breeding Mode), 2008- 2014
Output Share of Fujian's Mariculture (by Breeding Mode), 2014
Output Share of Fujian's Freshwater Aquaculture (by Breeding Mode), 2014
Jiangsu's Aquaculture Output (by Breeding Mode), 2008- 2014
Output Share of Jiangsu's Mariculture (by Breeding Mode), 2014
Output Share of Jiangsu's Freshwater Aquaculture (by Breeding Mode), 2014
Shandong's Aquaculture Output (by Breeding Mode), 2008- 2014
Output Share of Shandong's Mariculture (by Breeding Mode), 2014
Output Share of Shandong's Freshwater Aquaculture (by Breeding Mode), 2014
Liaoning's Aquaculture Output (by Breeding Mode), 2008- 2014
Output Share of Liaoning's Mariculture (by Breeding Mode), 2014
Output Share of Liaoning's Freshwater Aquaculture (by Breeding Mode), 2014
Guangdong's Aquaculture Output (by Breeding Mode), 2008- 2014
Output Share of Guangdong's Mariculture (by Breeding Mode), 2014
Output Share of Guangdong's Freshwater Aquaculture (by Breeding Mode), 2014
Zhejiang's Aquaculture Output (by Breeding Mode), 2008- 2014
Output Share of Zhejiang's Mariculture (by Breeding Mode), 2014
Output Share of Zhejiang's Freshwater Aquaculture (by Breeding Mode), 2014
Hubei's Aquaculture Output, 2008- 2014
Output Share of Hubei's Freshwater Aquaculture (by Breeding Mode), 2014
Hunan's Aquaculture Output, 2008- 2014
Output Share of Hunan's Freshwater Aquaculture (by Breeding Mode), 2014
China's Cultured Abalone Output, 2006-2014
Abalone Price in Weihai Aquatic Product Wholesale Market, 2014-2015
China's Cultured Sea Cucumber Output, 2006-2014
Sea Cucumber Price in Weihai Aquatic Product Wholesale Market, 2014-2015
China's Cultured Scallop Output, 2006-2014
Scallop Price in Beijing Fengtai District Xinfadi Agricultural Product Wholesale Market, 2014-2015
China's Cultured Sea Urchin Output, 2006-2014
China's Cultured Conch Output, 2006-2014
China's Cultured Penaeus Vannamei Output, 2006-2014
Output Share of China's Cultured Penaeus Vannamei (by Breeding Mode), 2006-2014
China's cultured tilapia Output, 2006-2014
Tilapia Price in Beijing Fengtai District Xinfadi Agricultural Product Wholesale Market, 2014-2015
China's Cultured Pearl Output, 2006-2014
China's Freshwater Cultured Pearl Output, 2006-2014
Revenue and Net Income of Yi Qiao Sea Cucumber, 2010-2015
Revenue of Yi Qiao Sea Cucumber (by Business), 2010-2014
Revenue Structure of Yi Qiao Sea Cucumber (by Business), 2010-2014
Revenue of Yi Qiao Sea Cucumber (by Region), 2010-2014
Revenue Structure of Yi Qiao Sea Cucumber (by Region), 2010-2014
Gross Margin of Yi Qiao Sea Cucumber, 2010-2015
Gross Margin of Yi Qiao Sea Cucumber (by Product), 2010-2015
Gross Margin of Yi Qiao Sea Cucumber (by Region), 2010-2015
Procurement from Top 5 Suppliers and% of Total Procurement of Yi Qiao Sea Cucumber, 2012-2014
Revenue from Top 5 Clients and % of Total Revenue of Yi Qiao Sea Cucumber, 2012-2014
Output, Sales Volume and Inventory of Yi Qiao Sea Cucumber, 2013-2014
R & D Costs and % of Total Revenue of Yi Qiao Sea Cucumber, 2012-2014
Revenue and Net Income of Yi Qiao Sea Cucumber, 2014-2018E
Revenue and Net Income of Guolian Aquatic Products, 2010-2015
Revenue of Guolian Aquatic Products (by Product), 2010-2015
Revenue Structure of Guolian Aquatic Products (by Product), 2010-2015
Revenue of Guolian Aquatic Products (by Region), 2010-2014
Revenue Structure of Guolian Aquatic Products (by Region), 2010-2014
Gross Margin of Guolian Aquatic Products, 2010-2015
Gross Margin of Guolian Aquatic Products (by Product), 2010-2015
Gross Margin of Guolian Aquatic Products (by Region), 2013-2014
R & D Costs and % of Total Revenue Inventory of Guolian Aquatic Products, 2012-2014
Output, Sales Volume and Inventory of Guolian Aquatic Products, 2013- 2014
Revenue and Net Income Inventory of Guolian Aquatic Products, 2014-2018E
Revenue and Net Income of ZONECO Group, 2010-2015
Revenue of ZONECO Group (by Product), 2010-2015
Revenue Structure of ZONECO Group (by Product), 2010-2015
Revenue of ZONECO Group (by Region), 2010-2015
Revenue Structure of ZONECO Group (by Region), 2010-2015
Gross Margin of ZONECO Group, 2010-2015
R & D Costs and % of Total Revenue of ZONECO Group, 2011-2014
Investment Projects Funded by Non-public Offering Plan of ZONECO Group, 2015
Output, Sales Volume and Inventory of ZONECO Group, 2013-2014
Revenue and Net Income of ZONECO Group, 2014-2018E
Revenue and Net Income of Oriental Ocean Sci-Tech, 2010-2015
Revenue of Oriental Ocean Sci-Tech (by Business), 2011-2015
Revenue Structure of Oriental Ocean Sci-Tech (by Business), 2011-2015
Revenue of Oriental Ocean Sci-Tech (by Region), 2010-2015
Revenue Structure of Oriental Ocean Sci-Tech (by Region), 2010-2015
Gross Margin of Oriental Ocean Sci-Tech, 2010-2015
Gross Margin of Oriental Ocean Sci-Tech (by Business), 2011-2015
Gross Margin of Oriental Ocean Sci-Tech (by Region), 2010-2015
Revenue and Net Income of Oriental Ocean Sci-Tech, 2014-2018E
Revenue and Net Income of Homey Aquatic Development, 2011-2015
Revenue of Homey Aquatic Development (by Business), 2012-2015
Revenue Structure of Homey Aquatic Development (by Business), 2012-2015
Revenue of Homey Aquatic Development (by Region), 2012-2015
Revenue Structure of Homey Aquatic Development (by Region), 2012- 2015
Gross Margin of Homey Aquatic Development, 2011- 2015
Gross Margin of Homey Aquatic Development (by Business), 2012-2015
R & D Costs and % of Total Revenue of Homey Aquatic Development, 2012-2014
Revenue and Net Income of Homey Aquatic Development, 2014-2018E
Revenue and Net Income of Pure Pearl, 2011- 2015
Revenue of Pure Pearl (by Product), 2011-2015
Revenue Structure of Pure Pearl (by Product), 2011-2015
Revenue of Pure Pearl (by Region), 2011-2015
Revenue Structure of Pure Pearl (by Region), 2011-2015
Gross Margin of Pure Pearl, 2011-2015
Gross Margin of Pure Pearl (by Product), 2011-2015
Gross Margin of Pure Pearl (by Region), 2012- 2015
Revenue and Net Income of Pure Pearl, 2014-2018E
Revenue and Net Income of Dahu Aquaculture, 2011-2015
Revenue of Dahu Aquaculture (by Product), 2012-2015
Revenue Structure of Dahu Aquaculture (by Product), 2012-2015
Revenue of Dahu Aquaculture (by Region), 2012- 2015
Revenue Structure of Dahu Aquaculture (by Region), 2012-2015
Gross Margin of Dahu Aquaculture, 2011- 2015
Gross Margin of Dahu Aquaculture (by Product), 2012- 2015
Revenue and Net Income of Dahu Aquaculture, 2014-2018E
Wuchangyu's Revenue and Net Income, 2011- 2015
Wuchangyu's Revenue (by Industry), 2009- 2015
Haid's Revenue and Net Income, 2009- 2015
Haid's Revenue (by Product), 2009- 2015
Haid's Revenue Structure (by Product), 2009- 2015
Haid's Revenue (by Region), 2009- 2015
Haid's Revenue Structure (by Region), 2009- 2015
Haid's Gross Margin (by Product), 2012- 2015
Haid's Gross Margin (by Region), 2012- 2015
Haid's R & D Costs and % of Total Revenue, 2012- 2014
Haid's Output, Sales Volume and Inventory, 2013- 2014
Haid's Revenue and Net Income, 2014-2018E
Baiyang's Revenue and Net Income, 2009- 2015
Baiyang's Revenue Structure (by Product), 2014
Baiyang's Revenue (by Region), 2009- 2015
Baiyang's Revenue Structure (by Region), 2009- 2015
Baiyang Revenue and Net Income, 2014-2018E
Tech-Bank's Revenue and Net Income, 2009- 2015
Tech-Bank's Revenue (by Region), 2009- 2015
Tech-Bank's Revenue Structure (by Region), 2009- 2015
Tech-Bank's Revenue (by Product), 2009- 2015
Tech-Bank's Revenue Structure (by Product), 2009- 2015
Tech-Bank's Aquaculture-related Patents
Tech-Bank's Feedstuff Sales Volume and YoY Growth Rate, 2012- 2015
Tech-Bank's Revenue and Net Income, 2014-2018E
Tongwei's Revenue and Net Income, 2009- 2015
Tongwei's Revenue (by Product), 2009- 2015
Tongwei's Revenue Structure (by Product), 2009- 2015
Tongwei's Revenue (by Region), 2009- 2015
Tongwei's Revenue Structure (by Region), 2009- 2015
Tongwei's Sales Volume of Feedstuff and Aquafeeds, 2010- 2014
Tongwei's Revenue and Net Income, 2014-2018E
Five Production Bases of Dalian RainLion
China Aquaculture Industry Report, 2015-2018
With the improvement of cultivation technology and the steady growth in per-capita consumption of aquatic products, both the output value of Chinese fishery industry and the output of aquatic products...