Global and China NdFeB Industry Report, 2015-2018
-
Nov.2015
- Hard Copy
- USD
$2,500
-
- Pages:104
- Single User License
(PDF Unprintable)
- USD
$2,300
-
- Code:
ZHP030
- Enterprise-wide License
(PDF Printable & Editable)
- USD
$3,500
-
- Hard Copy + Single User License
- USD
$2,700
-
As the third-generation rare-earth permanent magnet material, NdFeB, an alloy of Pr-Nd metal and ferroboron, is featured with strong magnetic energy product, high coercive force, and high energy density. Being the best-value magnet, it enjoys the reputation of the “King of Magnets”.
Thanks to the booming NdFeB industry in China, global NdFeB output soared from 14 kt in 2000 to 127 kt in 2014 at a CAGR of 13.4%. As the Chinese government eliminated export quota for rare earths, global NdFeB output will continue to grow to 143 kt in 2015.
China is the world’s largest NdFeB producer with an output of 112 kt in 2014 (88.1% of the global total), up 19.0% year on year. In 2015, due to ceaseless decline in NdFeB price, China will produce 127 kt throughout the year, gaining by 13.5% from a year ago.
Nowadays, around 75% of NdFeB is used in traditional fields (electro-acoustic devices, magnetic separation, consumer electronics, etc.), while only 25% finds application in new fields (inverter air-conditioners, new energy vehicles, and energy-saving elevators). Compared with stable demand from traditional fields, the demand for NdFeB from new applications, especially new energy vehicles, increases significantly. According to the statistics, new energy vehicles’ consumption of NdFeB was 439 tons in China in 2014 when 79,000 new energy vehicles were manufactured, and is expected to further rise to 946 tons in 2015 when the country’s new energy vehicle output will witness a spectacular rise (to an estimated 178,000).
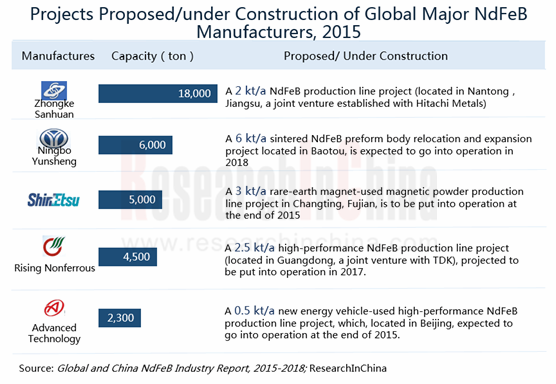
As downstream demand grows steadily and upstream raw material resources are abundant in China, the world’s major NdFeB companies have made their presence here and continued to expand capacity.
Hitachi Metals: The largest NdFeB manufacturer in Japan where is the home to most of its production bases. The company decided in Jun 2015 to set up a joint venture- Hitachi Metals San Huan Magnetic Materials (Nantong) Co., Ltd. with Beijing Zhong Ke San Huan Hi-Tech Co., Ltd. Phase I of the project will see the construction of 2 kt/a NdFeB production line and is planned to go into operation in 2016.
Shin-Etsu Chemical: With completion of 3 kt/a magnet alloys production line for rare earth magnets in Changting base in 2013, the 3 kt/a magnetic powder production line for rare earth magnets will finish construction at the end of 2015. All products manufactured by the project will be exported to Japan for the production of hybrid electric vehicles.
Beijing Zhong Ke San Huan Hi-Tech: The largest NdFeB manufacturer in China and even across the world; production bases located in Ningbo, Tianjin, Nantong, Beijing, Guangdong, and Shanghai with total NdFeB capacity of 18 kt/a. The 2 kt/a high-performance NdFeB production line was officially completed in Nantong base in May 2015.
Global and China NdFeB Industry Report, 2015-2018 focuses on the followings:
 Global NdFeB industry (development environment, market size/structure, competitive landscape, etc.);
NdFeB industry in China (industrial policies, market size/structure, competitive landscape, import & export, etc.);
NdFeB in China (price changes of main raw materials, demand structure of main applications, etc.);
Operation, revenue structure, NdFeB business, etc. of 5 foreign and 16 Chinese NdFeB manufacturers.
1 Introduction to NdFeB Industry
1.1 Definition
1.2 Product Category
1.3 Industry Chain
2 Status Quo of Global NdFeB Market
2.1 Development Environment
2.2 Market Size
2.3 Market Structure
2.4 Competitive Landscape
3 Status Quo of Chinese NdFeB Market
3.1 Industrial Policy
3.2 Market Size
3.3 Market Structure
3.4 Cost Structure
3.5 Import & Export
3.5.1 Import
3.5.2 Export
3.6 Competitive Landscape
4 Upstream and Downstream of NdFeB Industry
4.1 Raw Material Price
4.2 Main Applications
4.2.1 New Energy Vehicle
4.2.2 Wind Power Equipment
4.2.3 Inverter Air Conditioner
4.2.4 Energy-saving Elevator
5 Major Foreign NdFeB Manufacturers
5.1 Hitachi Metals
5.1.1 Profile
5.1.2 Operation
5.1.3 Revenue Structure
5.1.4 NdFeB Business
5.1.5 Development in China
5.2 Shin-Etsu Chemical
5.2.1 Profile
5.2.2 Operation
5.2.3 Revenue Structure
5.2.4 NdFeB Business
5.2.5 Development in China
5.3 TDK
5.3.1 Profile
5.3.2 Operation
5.3.3 Revenue Structure
5.3.4 NdFeB Business
5.4 Other Enterprises
5.4.1 Seiko Epson
5.4.2 VAC
6 Major Chinese NdFeB Manufacturers
6.1 Beijing Zhong Ke San Huan High-Tech Co., Ltd.
6.1.1 Profile
6.1.2 Operation
6.1.3 Revenue Structure
6.1.4 Gross Margin
6.1.5 NdFeB Business
6.1.6 Developments
6.2 China Northern Rare Earth (Group) High-tech Co., Ltd.
6.2.1 Profile
6.2.2 Operation
6.2.3 Revenue Structure
6.2.4 NdFeB Business
6.2.5 Developments
6.3 Taiyuan Twin Tower Aluminum Oxide Co., Ltd.
6.3.1 Profile
6.3.2 Operation
6.3.3 Revenue Structure
6.3.4 Gross Margin
6.3.5 NdFeB Business
6.4 Yantai Zhenghai Magnetic Material Co., Ltd.
6.4.1 Profile
6.4.2 Operation
6.4.3 Revenue Structure
6.4.4 Gross Margin
6.4.5 R&D
6.4.6 NdFeB Business
6.4.7 Key Projects
6.5 Ningbo Yunsheng Co., Ltd.
6.5.1 Profile
6.5.2 Operation
6.5.3 Revenue Structure
6.5.4 NdFeB Business
6.5.5 Developments
6.6 Rising Nonferrous Metals Co., Ltd.
6.6.1 Profile
6.6.2 Operation
6.6.3 Revenue Structure
6.6.4 Gross Margin
6.6.5 NdFeB Business
6.6.6 Developments
6.7 Xiamen Tungsten Co., Ltd.
6.7.1 Profile
6.7.2 Operation
6.7.3 Revenue Structure
6.7.4 NdFeB Business
6.8 Advanced Technology & Materials Co., Ltd.
6.8.1 Profile
6.8.2 Operation
6.8.3 Revenue Structure
6.8.4 NdFeB Business
6.8.5 Developments
6.9 Sinosteel Anhui Tianyuan Technology Co., Ltd.
6.9.1 Profile
6.9.2 Operation
6.9.3 Revenue Structure
6.9.4 NdFeB Business
6.10 Zhongshan Broad-Ocean Motor Co., Ltd.
6.10.1 Profile
6.10.2 Operation
6.10.3 Revenue Structure
6.10.4 Gross Margin
6.10.5 NdFeB Business
6.11 Chengdu Galaxy Magnets Co., Ltd.
6.11.1 Profile
6.11.2 Operation
6.11.3 Revenue Structure
6.11.4 NdFeB Business
6.11.5 Key Projects
6.12 Other Enterprises
6.12.1 Yantai Shougang Magnetic Materials Inc
6.12.2 Beijing Jingci Magnet Co., Ltd.
6.12.3 Beijing Thinova
6.12.4 Anhui Earth-Panda Advance Magnetic Material Co., Ltd.
6.12.5 Ningbo Jinji Strong Magnetic Material Co., Ltd
7 Summary and Forecast
7.1 Market
7.2 Enterprise
Elements of NdFeB
Magnetic Performance Comparison between NdFeB Permanent Magnet Materials and Other Permanent Magnet Materials
Performance Comparison of Three Kinds of NdFeB
Classification of NdFeB
NdFeB Industry Chain
Consumption of Bonded NdFeB by Application, 2014
Development History of Global Permanent Magnet Materials
Expiration of Main Global NdFeB Patents
Enterprises Holding Authorized NdFeB Patents in China, by 2015H1
Global NdFeB Output and Growth Rate, 2008-2018E
Global Bonded NdFeB Output, 2008-2018E
Global High-performance NdFeB Output, 2008-2018E
Global NdFeB Output Structure (by Country), 2014
Global High-performance NdFeB Output Structure (by Country), 2014
Global Downstream NdFeB Consumption Structure, 2014
Global High-performance NdFeB Market Competition Pattern, 2014
Global High-performance NdFeB Competition Pattern, 2018E
Policies on NdFeB Industry in China, 2000-2015
NdFeB Output and Growth Rate in China, 2006-2018E
High-performance NdFeB Output and Growth Rate in China, 2007-2018E
NdFeB Capacity Distribution in China, 2014
China’s Demand for High-performance NdFeB by Field, 2010-2018E
NdFeB Cost Structure in China, 2014
Import Volume & Value of NdFeB and Related Products in China, 2011-2015
Import Volume Structure of NdFeB Permanent Magnets by Country/Region, 2014
Export Volume & Value of NdFeB and Related Products from China, 2013-2015
Export Volume Structure of NdFeB Permanent Magnets by Country/Region, 2014
Export Volume Structure of NdFeB Magnetic Powder by Country/Region, 2014
Export Volume Structure of Other Neodymium-Iron Alloys by Country/Region, 2014
Capacity Structure of NdFeB Manufacturers, 2015
Capacity of Major Chinese NdFeB Manufacturers, 2015
China's Metal Neodymium Price, 2013-2015
China's Metal Praseodymium Price, 2013-2015
Structure of Downstream Demand for NdFeB in China, 2014
New Energy Vehicle Output in China, 2011-2018E
Performance Comparison between Permanent Magnet Motors and Other Motors
Global Mainstream New Energy Vehicle Drive Motors, 2015
Demand for NdFeB from New Energy Vehicle in China, 2014-2018E
China’s Installed Wind Power Capacity, 2010-2018E
Direct-drive Permanent Magnet Turbine Installed Capacity in China, 2014-2018E
Demand for NdFeB from Wind Power Equipment in China, 2014-2018E
Demand for NdFeB from Converter Air Conditioner in China, 2014-2018E
Demand for NdFeB from Energy-saving Elevator in China, 2014-2018E
Global Business Presence of Hitachi Metals
Revenue and Net Income of Hitachi Metals, FY2009-FY2015
Revenue Structure of Hitachi Metals by Product, FY2013-FY2015
Global Market Expansion Strategy of Hitachi Metals, 2015
Magnetic Material Revenue of Hitachi Metals, FY2014
NdFeB Application Structure of Hitachi Metals, FY2014
NdFeB Production Bases of Hitachi Metals, FY2014
Sales Structure of Hitachi Metals in China, FY2014
Hitachi Metals’ Enterprises in China, 2015
Global Presence of Shin-Etsu Chemical
Revenue and Net Income of Shin-Etsu Chemical, FY2008-FY2016
Revenue Structure of Shin-Etsu Chemical by Business, FY2014-FY2016
Revenue Structure of Shin-Etsu Chemical by Region, FY2014-FY2015
Shin-Etsu Chemical’s Investment in Magnetic Material Business, 2015
Global Marketing Network of TDK
Revenue and Net Income of TDK, FY2010-FY2016
Revenue Structure of TDK by Product, FY2013-FY2016
Revenue Structure of TDK by Region, FY2010-FY2016
Main Magnetic Products of TDK
Global Marketing Network of Seiko Epson
Operating Revenue Structure of VAC by Product, 2015
Equity Structure of Beijing Zhong Ke San Huan High-Tech, 2015
Revenue and Net Income of Beijing Zhong Ke San Huan High-Tech, 2009-2015
Operating Revenue Breakdown of Beijing Zhong Ke San Huan High-Tech by Product, 2008-2015
Operating Revenue Structure of Beijing Zhong Ke San Huan High-Tech by Region, 2012-2015
Gross Profit and Gross Margin of Beijing Zhong Ke San Huan High-Tech, 2010-2015
Revenue of NdFeB Subsidiaries of Beijing Zhong Ke San Huan High-Tech, 2014
NdFeB Revenue and Growth Rate of Beijing Zhong Ke San Huan High-Tech, 2003-2015
NdFeB Application Structure of Beijing Zhong Ke San Huan High-Tech, 2014
Equity Structure of China Northern Rare Earth (Group) High-tech, 2015
Employees of China Northern Rare Earth (Group) High-tech, 2008-2014
Revenue and Net Income of China Northern Rare Earth (Group) High-tech, 2008-2015
Subsidiaries Eliminated by China Northern Rare Earth (Group) High-tech for Backward Capacity, 2014
Revenue Structure of China Northern Rare Earth (Group) High-tech by Product, 2012-2015
Revenue Structure of China Northern Rare Earth (Group) High-tech by Region, 2008-2015
NdFeB Revenue and Gross Margin of China Northern Rare Earth (Group) High-tech, 2008-2015
Key Economic Indicators of Inner Mongolia Baotou Steel Rare Earth Magnetic Material, 2012-2015
Equity Structure of Taiyuan Twin Tower Aluminum Oxide, 2015
Employees of Taiyuan Twin Tower Aluminum Oxide, 2008-2014
Revenue and Net Income of Taiyuan Twin Tower Aluminum Oxide, 2008-2015
Revenue Structure of Taiyuan Twin Tower Aluminum Oxide by Product, 2013-2015
Revenue Structure of Taiyuan Twin Tower Aluminum Oxide by Region, 2008-2015
Gross Margin of Taiyuan Twin Tower Aluminum Oxide by Product, 2008-2015
NdFeB Cost Structure of Taiyuan Twin Tower Aluminum Oxide, 2013-2014
NdFeB Revenue and Growth Rate of Taiyuan Twin Tower Aluminum Oxide, 2008-2015
Revenue and Net Income of Zhejiang Innuovo Magnetics, 2012-2015
Revenue and Net Income of Shanxi Innuovo Magnetics, 2012-2015
Equity Structure of Yantai Zhenghai Magnetic Material, 2015
Revenue and Net Income of Yantai Zhenghai Magnetic Material, 2009-2015
Revenue Structure of Yantai Zhenghai Magnetic Material by Product, 2015
Revenue Structure of Yantai Zhenghai Magnetic Material by Region, 2010-2014
Gross Margin of Yantai Zhenghai Magnetic Material, 2010-2015
R&D Costs of Yantai Zhenghai Magnetic Material, 2011-2015
NdFeB Revenue and Gross Margin of Yantai Zhenghai Magnetic Material, 2010-2015
NdFeB Output and Sales Volume of Yantai Zhenghai Magnetic Material, 2012-2014
NdFeB Revenue Structure of Yantai Zhenghai Magnetic Material by Type, 2014
NdFeB Consumption Structure of Yantai Zhenghai Magnetic Material, 2014
Equity Structure of Ningbo Yunsheng, 2015
Employees of Ningbo Yunsheng, 2007-2014
Revenue and Net Income of Ningbo Yunsheng, 2008-2015
Revenue Structure of Ningbo Yunsheng by Product, 2012-2015
Revenue Structure of Ningbo Yunsheng by Region, 2010-2015
Revenue of Ningbo Yunsheng’s Major NdFeB Subsidiaries, 2014
NdFeB Revenue and Gross Margin of Ningbo Yunsheng, 2009-2015
NdFeB Cost Structure of Ningbo Yunsheng, 2012-2014
NdFeB Consumption Structure of Ningbo Yunsheng, 2014
Equity Structure of Rising Nonferrous Metals, 2015
Employees of Rising Nonferrous Metals, 2009-2014
Revenue and Net Income of Rising Nonferrous Metals, 2009-2015
Revenue Structure of Rising Nonferrous Metals by Product, 2013-2015
Revenue Structure of Rising Nonferrous Metals by Region, 2013-2015
Gross Margin of Rising Nonferrous Metals by Product, 2009-2015
Revenue and Net Income of Guangdong Rising Nonferrous Metals Import & Export, 2012-2015
Revenue and Net Income of Guangdong Rising Zhiwei Rare Earth New Materials, 2012-2015
Equity Structure of Xiamen Tungsten, 2015
Revenue and Net Income of Xiamen Tungsten, 2008-2015
Revenue Structure of Xiamen Tungsten by Product, 2012-2015
Revenue Structure of Xiamen Tungsten by Region, 2009-2015
Revenue and Net Income of Changting Golden Dragon Rare-Earth, 2010-2015
Equity Structure of Advanced Technology & Materials, 2015
Revenue and Net Income of Advanced Technology & Materials, 2009-2015
Revenue Structure of Advanced Technology & Materials by Product, 2013-2015
Revenue Structure of Advanced Technology & Materials by Region, 2010-2015
Revenue of Highmag Technology, 2013-2015
Equity Structure of Sinosteel Anhui Tianyuan Technology, 2015
Revenue and Net Income of Sinosteel Anhui Tianyuan Technology, 2008-2015
Revenue Structure of Sinosteel Anhui Tianyuan Technology by Product, 2013-2015
Revenue Structure of Sinosteel Anhui Tianyuan Technology by Region, 2009-2015
Equity Structure of Zhongshan Broad-Ocean Motor, 2015
Employees of Zhongshan Broad-Ocean Motor, 2009-2014
Revenue and Net Income of Zhongshan Broad-Ocean Motor, 2009-2015
Revenue Structure of Zhongshan Broad-Ocean Motor by Product, 2013-2015
Revenue Structure of Zhongshan Broad-Ocean Motor by Region, 2009-2015
Gross Margin of Zhongshan Broad-Ocean Motor by Product, 2009-2015
Revenue of Ningbo Co-star Materials Hi-Tech, 2012-2014
Equity Structure of Chengdu Galaxy Magnets, 2015
Revenue and Net Income of Chengdu Galaxy Magnets, 2008-2015
Revenue Structure of Chengdu Galaxy Magnets by Product, 2012-2014
Revenue Structure of Chengdu Galaxy Magnets by Region, 2011-2015
NdFeB Revenue and Growth Rate of Chengdu Galaxy Magnets, 2009-2015
NdFeB Revenue Structure of Chengdu Galaxy Magnets by Product, 2013-2015
Key R&D Projects of Chengdu Galaxy Magnets, 2015
Main Production Bases and Capacity of Anhui Earth-Panda Advance Magnetic Material
Global NdFeB and High-performance NdFeB Output, 2008-2018E
NdFeB and High-performance NdFeB Output in China, 2007-2018E
High-performance NdFeB Application Structure in China, 2014/2018E
Revenue Growth Rate of the World’s Major NdFeB Manufacturers, 2009-2015
Competitive Landscape of Global NdFeB Manufacturers, 2015
Global and China Photoresist Industry Report, 2021-2026
Since its invention in 1959, photoresist has been the most crucial process material for the semiconductor industry. Photoresist was improved as a key material used in the manufacturing process of prin...
Global and China Needle Coke Industry Report, 2021-2026
Needle coke is an important carbon material, featuring a low thermal expansion coefficient, a low electrical resistivity, and strong thermal shock resistance and oxidation resistance. It is suitable f...
Global and China 3D Glass Industry Report, 2021-2026
3D curved glass is light and thin, transparent and clean, anti-fingerprint, anti-glare, hard and scratch-resistant, and performs well in weather resistance. It is applicable to terminals such as high-...
Global and China Graphene Industry Report, 2020-2026
Graphene, a kind of 2D carbon nanomaterial, features excellent properties such as mechanical property and super electrical conductivity and thermal conductivity. Its downstream application ranges from...
Global and China 3D Glass Industry Report, 2020-2026
Global 3D glass market has been enlarging over the recent years amid demetallization of smartphone back covers and popularity of smart wearables, to approximately $2.86 billion in 2019 and to an estim...
Global and China Photoresist Industry Report, 2020-2026
In 2019, global photoresist market was valued at $8.3 billion, growing at a compound annual rate of 5.1% or so since 2010, and it will outnumber $12.7 billion in 2026 with advances in electronic techn...
Global and China Synthetic Diamond Industry Report, 2020-2026
While its mechanical property is given full play in fields like grinding and cutting, diamond with acoustic, optical, magnetic, thermal and other special properties, as superconducting material, intel...
Global and China Needle Coke Industry Report, 2020-2026
With the merits like small resistivity, excellent resistance to impact and good anti-oxidation property, needle coke has been widely used in ultra-high power graphite electrodes, nuclear reactor decel...
Global and China Optical Fiber Preform Industry Report, 2019-2025
Optical fiber preform, playing an important role in the optical fiber and cable industry chain, seizes about 70% profits of optical fiber. Global demand for optical fiber preform stood at 16.2kt in 20...
China Silicon Carbide Industry Report, 2019-2025
Silicon carbide (SiC) is the most mature and the most widely used among third-generation wide band gap semiconductor materials. Over the past two years, global SiC market capacity, however, hovered ar...
Global and China Photoresist Industry Report, 2019-2025
Photoresist, a sort of material indispensable to PCB, flat panel display, optoelectronic devices, among others, keeps expanding in market size amid the robust demand from downstream sectors. In 2018, ...
Global and China Graphene Industry Report, 2019-2025
Graphene is featured with excellent performance and enjoys a rosy prospect. The global graphene market was worth more than $100 million in 2018, with an anticipated CAGR of virtually 45% between 2019 ...
Global and China 3D Glass Industry Chain Report, 2019-2025
The evolution of AMOLED conduces to the steady development of 3D curved glass market. In 2018, the global 3D glass market expanded 37.7% on an annualized basis and reached $1.9 billion, a figure proje...
China Wood Flooring Industry Report, 2019-2025
With the better standard of living and the people’s desire for an elegant life, wood flooring sees a rising share in the flooring industry of China, up from 33.9% in 2009 to 38.9% in 2018, just behind...
Global and China Photovoltaic Glass Industry Report, 2019-2025
In China, PV installed capacity has ramped up since the issuance of photovoltaic (PV) subsidy policies, reaching 53GW in 2017, or over 50% of global total. However, the domestic PV demand was hit by t...
Global and China ITO Targets Industry Chain Report, 2019-2025
Featured by good electrical conductivity and transparency, ITO targets are widely applied to fields of LCD, flat-panel display, plasma display, touch screen, electronic paper, OLED, solar cell, antist...
Global and China MO Source Industry Report, 2019-2025
MO source is a key raw material for metal-organic chemical vapor deposition (MOCVD) process. Global MO source output ranged at 102.6 tons in 2018, a rise of roughly 4.6% from a year earlier, a figure ...
Global and China Bi-Metal Band Saw Blade Industry Report, 2018-2023
Chinese manufacturing rebounded in the wake of a pick-up in infrastructure construction between 2016 and 2018, so did the bi-metal band saw blade as a key integral of metal processing industry. In 201...