Global and China Wind Farm Operation and Maintenance Industry Report, 2015-2018
-
Dec.2015
- Hard Copy
- USD
$2,400
-
- Pages:102
- Single User License
(PDF Unprintable)
- USD
$2,200
-
- Code:
CYH042
- Enterprise-wide License
(PDF Printable & Editable)
- USD
$3,500
-
- Hard Copy + Single User License
- USD
$2,600
-
In 2014, the global wind farm O & M market size hit USD9.25 billion, representing a year-on-year growth rate of 25.8%; by 2018, the market size is expected to reach USD13.78 billion. The mainstream onshore wind farm O & M market seized the share of 90.2% in 2014, much higher than the rest offshore wind farm O & M market. With the accelerating construction of offshore wind power, the global offshore wind farm O & M market is expected to grow at above 20% in 2015-2018.
China ranks first worldwide in terms of wind farm O&M market size. In 2014, the country achieved USD2.18 billion, accounting for 23.6%. Since the warranty period of a large number of wind turbines made in 2009 is approaching, China’s wind farm O & M market size will surge to USD3.512 billion by 2018.
At present, players in the Chinese wind farm O&M market can be divided into three main types: wind turbine manufacturers, wind farm developers and third-party O&M companies. In 2015, wind farm developers enjoy the lion’s share --74.6%, followed by wind turbine manufacturers with 14.8%. Third-party O&M companies have a relatively small scale owing to technical barriers.
Concord New Energy is a major wind farm developer in China. Its wind farm O & M business is operated by its subsidiary Beijing Concord O & M Wind Power Technology Co., Ltd. with five maintenance bases. In the first half of 2015, the company completed 39 wind farm O & M projects, signed 11 scheduled inspection service contracts and 10 preventive service contracts.
Goldwind as China's largest wind turbine manufacturer assigns its subsidiary China Tianyuan New Energy Technology to conduct wind farm O & M business. As of the end of August 2015, it had provided O & M services and technical support for 17,000 wind turbines and more than 500 wind farms.
East Environment Energy, a key third-party O&M company, has set up an intelligent energy O & M service center to monitor wind farms in real time. In the first half of 2015, the company’s wind farm O & M revenue amounted to RMB37.358 million, up 3% year on year.
Global and China Wind Farm O&M Industry Report, 2015-2018 by ResearchInChina focuses on the followings:
 Global wind power installed capacity and distribution; China's wind power installed capacity, regional structure, offshore wind power development and corporate structure;
Global wind farm O & M market size and geographical distribution; development of European wind farm O & M market;
Chinese wind farm O & M market size, cost analysis and competitive landscape;
Operation and development in China of 5 major global wind farm O & M companies;
Operation and development strategies of 11 major Chinese wind farm O & M companies.
1. Overview of Wind Farm O&M
1.1 Definition
1.2 Classification
2. Global and Chinese Wind Power Market
2.1 Global Wind Power Market
2.1.1 Wind Power Installed Capacity and Distribution
2.1.2 Germany
2.1.3 Spain
2.1.4 USA
2.2 Chinese Wind Power Market
2.2.1 Overview
2.2.2 Installed Capacity and Grid Connection
2.2.3 Offshore Wind Power
2.2.4 Feed-In Tariff
2.2.5 Pattern of Wind Turbine Manufacturers
2.2.6 Pattern of Wind Farm Developers
3. Global Wind Farm O&M Market
3.1 Market Size
3.2 Regional Structure
3.3 Cost Analysis
3.4 European Market
3.4.1 Market Size
3.4.2 Competitive Landscape
4. Chinese Wind Farm O&M Market
4.1 Development
4.2 Market Size
4.3 Cost Analysis
4.4 Competitive Landscape
5. Major Global Wind Farm O&M Companies
5.1 Vestas
5.1.1 Profile
5.1.2 Operation
5.1.3 Revenue Structure
5.1.4 Business in China
5.1.5 Wind Farm O&M Business
5.2 Gamesa
5.2.1 Profile
5.2.2 Operation
5.2.3 Revenue Structure
5.2.4 Business in China
5.2.5 Wind Farm O&M Business
5.3 Suzlon
5.3.1 Profile
5.3.2 Operation
5.3.3 Revenue Structure
5.3.4 Business in China
5.3.5 Wind Farm O&M Business
5.4 GE
5.4.1 Profile
5.4.2 Operation
5.4.3 Revenue Structure
5.4.4 Business in China
5.4.5 Wind Farm O&M Business
5.5 Siemens
5.5.1 Profile
5.5.2 Operation
5.5.3 Revenue Structure
5.5.4 Business in China
5.5.5 Wind Farm O&M Business
6. Chinese Wind Farm O&M Companies
6.1 Longyuan Power
6.1.1 Profile
6.1.2 Operation
6.1.3 Revenue Structure
6.1.4 Gross Margin
6.1.5 Wind Farm O&M Business
6.1.6 Development Prospect
6.2 Goldwind
6.2.1 Profile
6.2.2 Operation
6.2.3 Revenue Structure
6.2.4 Gross Margin
6.2.5 Customers and Suppliers
6.2.6 Wind Farm O&M Business
6.2.7 Development Prospect
6.3 Ming Yang Wind Power
6.3.1 Profile
6.3.2 Operation
6.3.3 Revenue Structure
6.3.4 Customers and Suppliers
6.3.5 Wind Farm O&M Business
6.3.6 Development Prospect
6.4 Concord New Energy
6.4.1 Profile
6.4.2 Operation
6.4.3 Revenue Structure
6.4.4 Customers and Suppliers
6.4.5 Wind Farm O&M Business
6.4.6 Development Prospect
6.5 United Power
6.5.1 Profile
6.5.2 Operation
6.5.3 Wind Farm O&M Business
6.6 EULIKIND
6.6.1 Profile
6.6.2 Wind Farm O&M Business
6.7 Xinjiang Jindaban Clean Energy
6.7.1 Profile
6.7.2 Wind Farm O&M Business
6.8 Gideon
6.8.1 Profile
6.8.2 Wind Farm O&M Business
6.9 Sharpower
6.9.1 Profile
6.9.2 Wind Farm O&M Business
6.10 East Environment Energy
6.10.1 Profile
6.10.2 Operation
6.10.3 Revenue Structure
6.10.4 Wind Farm O&M Business
6.11 EUM Wind Power Technologies Service (Beijing)
7. Summary and Forecast
7.1 Summary
7.2 Forecast
Major Business Sectors in Wind Power Service Industry
Structure of Global Wind Farm O&M Market by Type of Service, 2013 vs 2018E
Global Newly-installed Wind Power Capacity, 2008-2018E
Global Cumulative Installed Wind Power Capacity, 2008-2018E
Global Wind Power Installed Capacity (by Region), 2014
Global Offshore Wind Power Installed Capacity, 2011-2014
Newly-installed and Cumulative Wind Power Capacity in Germany, 1992-2014
Installed Wind Power Capacity in Germany (by Region), 2014
Wind Farms in Operation, Under Construction and Planned in Germany, 2015
Cumulative Installed Wind Power Capacity in Spain, 2005-2014
Cumulative Installed Wind Power Capacity in USA, 2004-2014
Cumulative Installed Wind Power Capacity in USA (by Region), 2014
Offshore Wind Power Distribution in USA, 2015
Development Course of Chinese Wind Turbine Generators, 1980-2015
Installed Wind Power Capacity in China, 2007-2015
Grid-connected Installed Wind Power Capacity in China, 2009-2015
Newly-installed and Cumulative Offshore Wind Capacity in China, 2007-2015
China’s First Franchise Offshore Wind Projects
Offshore Wind Power Installed Capacity of Chinese Wind Power Manufacturers, by the end of 2014
Benchmark Feed-In Tariff for Wind Power in China, 2015
Newly-installed Capacity and Market Share of Chinese Wind Turbine Manufacturers, 2014
Cumulative Installed Capacity and Market Share of Chinese Wind Turbine Manufacturers, 2014
Cumulative Wind Power Installed Capacity and Market Share of Chinese Wind Farm Developers, 2014
Global Wind Farm O&M Market Size, 2008-2018E
Global Wind Farm O&M Service Revenue and Wind Turbine Revenue, 2008-2015
Global Wind Farm O&M Market Size Structure (by Region), 2014 vs 2018E
Cost Growth Trend of Wind Farm O&M
Cost Structure of Wind Power Service, 2014
European Wind Farm O&M Market Size, 2005-2020E
European Wind Farm O&M Market Size (by Country), 2005-2020E
Newly-added Installed Wind Power Capacity Coming into O&M in Europe (by Country), 2012-2020E
Share of European Wind Farm O&M Market (by Type of Farm), 2011&2020E
Share of European Wind Farm O&M Market (by Country and Type of Service Provider), 2014
Number of Wind Turbines Out of Warranty, 2011-2020E
Chinese Wind Farm O&M Market Size, 2008-2015
Annual Operating Costs of A 50MW Wind Farm
Operating Costs Structure of Onshore Wind Power in China
Operating Costs Structure of Offshore Wind Power in China
Wind Farm O&M Market Share (by Type of Companies) in China, 2015
SWOT Analysis of Three Types of Competitors in Chinese Wind Farm O&M Market
Wind Farm O&M Business of Major Wind Power Companies in China, 2015
Revenue and Net Income of Vestas, 2009-2015
Revenue Structure of Vestas (by Business), 2012-2015
Wind Turbine Shipment of Vestas (by Region), 2014-2015
Wind Turbine Shipment of Vestas in China, 2008-2015
Subsidiaries of Vestas in China, 2015
Vestas’ Wind Farm O&M Order Backlog, 2009-2015
Vestas’ Revenue from Wind Farm O&M Business, 2010-2014
Vestas’ Wind Farm O&M Order, 2013-2015
Wind Turbine Capacity Served by Vestas (by Region), 2014
Revenue and Net Income of Gamesa, 2009-2015
Orders of Gamesa, 2014-2015
Revenue Structure of Gamesa (by Product), 2013-2015
Revenue and Structure of Gamesa (by Region), 2013-2014
Wind Turbine Sales Volume Structure of Gamesa (by Region), 2012-2015
Operation of Gamesa in China, 2014
Gamesa’s Revenue in China, 2008-2014
Share of Gamesa by Wind Turbine Sales Volume in China, 2012-2015
Gamesa’s Revenue from Wind Farm O&M Business, 2010-2015
Revenue and Net Income of Suzlon, FY2010-FY2016
Operation of Suzlon, H1 FY2016
Revenue Structure of Suzlon (by Region), FY2014-FY2015
Revenue of Suzlon in China, FY2014-FY2015
OMS Revenue of Suzlon, FY2009- FY2013
Revenue and Net Income of GE, 2009-2015
Operating Revenue Structure of GE (by Business), 2010-2015
Operating Revenue Structure of GE (by Region), 2011-2014
GE’s Flexible Wind Power Service Solutions
Revenue and Net Income of Siemens, FY2010-FY2015
Operation of Siemens in China, 2015
Siemens’ Revenue in China, FY2009-FY2015
Strategy of Siemens in China
Siemens’ Revenue from Wind Power Division, FY2011-FY2015
Order Backlog of Siemens’ Wind Power Division, FY2011-FY2015
Wind Farm O&M System of Siemens
Revenue and Net Income of Longyuan Power, 2009-2015
Revenue Structure of Longyuan Power (by Business), 2013-2015
Gross Margin of Longyuan Power (by Business), 2012-2015
Six Wind Power Bases of Longyuan Power
Revenue and Net Income of Longyuan Power, 2013-2018E
Revenue and Net Income of Goldwind, 2009-2015
Wind Turbine Sales Volume of Goldwind (by Type), 2011-2015
Operating Revenue Structure of Goldwind (by Product), 2014-2015
Operating Revenue Structure of Goldwind (by Region), 2015H1
Gross Margin of Goldwind (by Product), 2011-2015
Goldwind’s Procurement from Top 5 Suppliers and % of Total Procurement, 2008-2014
Goldwind’s Revenue from Top 5 Customers and % of Total Revenue, 2008-2014
Goldwind’s Revenue from Wind Power Service Business, 2010-2015
Revenue and Net Income of China Tianyuan New Energy Technology, 2010-2015
Revenue and Net Income of Goldwind, 2013-2018E
Main Production Bases and Capacity of Ming Yang Wind Power, end of 2014
Revenue and Net Income of Ming Yang Wind Power, 2009-2015
Wind Turbine Shipment of Ming Yang Wind Power, 2008-2014
New Orders and Backlog of Ming Yang Wind Power, 2014-2015
Revenue Structure of Ming Yang Wind Power (by Business), 2012-2014
Revenue Structure of Ming Yang Wind Power (by Region), 2012-2013
Ming Yang Wind Power’s Procurement from Top 5 Suppliers and % of Total Procurement, 2009-2014
Ming Yang Wind Power’s Revenue from Top 5 Customers and % of Total Revenue, 2008-2014
Ming Yang Wind Power’s Wind Farm O&M Business System
Ming Yang Wind Power’s Revenue from Wind Farm O&M Business, 2009-2014
Revenue and Net Income of Ming Yang Wind Power, 2013-2018E
Revenue and Net Income of Concord New Energy, 2009-2015
Revenue Structure of Concord New Energy (by Business), 2013-2015
Revenue Structure of Concord New Energy (by Region), 2013-2015
Concord New Energy’s Procurement from Top 5 Suppliers and % of Total Procurement, 2010-2014
Concord New Energy’s Revenue from Top 5 Customers and % of Total Revenue, 2010-2014
Wind Farm O&M Revenue of Concord New Energy, 2013-2015
Revenue and Net Income of Concord New Energy, 2013-2018E
Revenue and Net Income of United Power, 2012-2014
Wind Turbine Sales Volume of United Power, 2011-2014
Construction Procedures for Wind Farm EPC of United Power
Development of EULIKIND’s Wind Farm O&M Business, 2006-2015
Development of Xinjiang Jindaban Clean Energy’s Wind Farm O&M Business, 2005-2010
Major Wind Farm O&M Projects of Gideon, 2006-2015
Revenue and Net Income of East Environment Energy, 2012-2015
Operating Revenue Structure of East Environment Energy (by Business), 2012-2015
Wind Farm O&M System of East Environment Energy
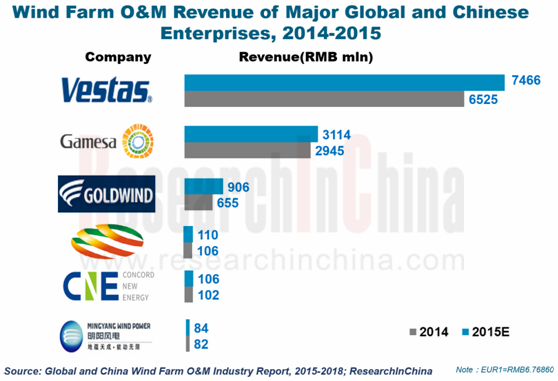
Wind Farm O&M Revenue of Major Global and Chinese Enterprises, 2014-2015
Global Wind Farm O&M Market Size, 2014-2018E
Chinese Wind Farm O&M Market Size, 2014-2018E
Global and China Wind Farm O&M Industry Report, 2017-2021
As the wind power installed capacity grows and the warranty period of a large number of wind turbines is coming to an end, wind farm O & M has become the focus of the industry. In 2016, the global...
Global and China Electrical Energy Storage (EES) Industry Report, 2016-2020
Energy storage finds widespread application in power system, involving power generation, transmission, distribution, and end users. Global cumulative installed capacity of electrical energy storage (E...
Global and China Wind Farm Operation and Maintenance Industry Report, 2015-2018
In 2014, the global wind farm O & M market size hit USD9.25 billion, representing a year-on-year growth rate of 25.8%; by 2018, the market size is expected to reach USD13.78 billion. The mainstrea...
China Energy Storage for Grid System Industry Report, 2015-2018
Energy storage finds wide application in electric power system, involving all aspects of power generation, transmission, distribution and end user. Technically, energy storage for grid system can be d...
China Energy Conservation Service Industry Report, 2015
Energy conservation service industry provides service and support for enterprises and projects in terms of energy conservation and emission reduction. An Energy Service Company, more commonly referred...
China Natural Gas Fueling Station Equipment Industry Report, 2015-2018
According to different fuels used by natural gas stations, gas station equipment can be divided into compressed natural gas (CNG) station equipment and liquefied natural gas (LNG) station equipment. T...
China Filling Station and Gas Station Industry Report,2015-2018
Filling Stations By the end of 2014, China had run a total of 99,000 filling stations, each of which served 1,456 civilian cars; Shandong, Hebei, Henan, Guangdong and Jiangsu ranked top five by the nu...
China Biodiesel Industry Report, 2014-2017
Biodiesel refers to a renewable diesel fuel made from oil crops, animal fats, food waste oil that can substitute petroleum diesel and has environmental protection, safety, renewability and other advan...
China Filling Station And Refueling Station Industry Report,2013-2016
By the end of 2012, China has had a total of 96,313 filling stations, an increase of 875 or up 0.92% compared to 2011, including 51,854 SOE filling stations (53.8% of the total), 42,425 private fillin...