Global and China Electrical Energy Storage (EES) Industry Report, 2016-2020
-
Aug.2016
- Hard Copy
- USD
$2,800
-
- Pages:143
- Single User License
(PDF Unprintable)
- USD
$2,600
-
- Code:
HK074
- Enterprise-wide License
(PDF Printable & Editable)
- USD
$4,100
-
- Hard Copy + Single User License
- USD
$3,000
-
Energy storage finds widespread application in power system, involving power generation, transmission, distribution, and end users. Global cumulative installed capacity of electrical energy storage (EES) (excluding pumped hydro storage, compressed air energy storage and thermal storage) has grown at a CAGR of 18% over the past five years, hitting 946.8MW in 2015. The United States and Japan are leaders by installed capacity of EES, together holding 78% shares.
In 2015, lithium-ion battery and sodium-sulfur battery dominate the world’s installed capacity of EES, making up 38% and 36%, respectively; renewable energy grid integration and frequency regulation auxiliary services are two main applications, accounting for 43% and 22%, respectively.
Asia, particularly South Korea and Japan, is the home to the enterprises with larger installed capacity of EES. In 2015, the world’s top5 enterprises (by installed capacity of EES) were LG Chem, NEC, NGK, Toshiba, and Samsung SDI.
Global Top10 EES Enterprises (by Installed Capacity), 2015
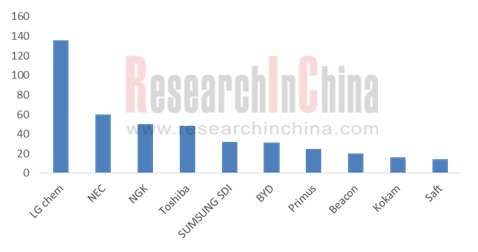
Source: ResearchInChina
In 2015, China’s installed capacity of EES (excluding pumped hydro storage, compressed air energy storage, and thermal storage) accounted for about 11% of the world’s total, at a CAGR of 110% over the past five years. Unlike foreign countries, China attaches great importance to lithium-ion battery technology which shares 66% of China’s total installed capacity of EES. Two major applications are distributed generation μgrid (56%) and renewable energy grid integration (35%).
In 2015, most of top10 Chinese enterprises with the largest installed capacity of EES employed lithium-ion battery technology. The first five enterprises were BYD, Dalian Rongke Power, Wanxiang, Zhejiang Narada Power Source, and China Aviation Lithium Battery, seizing a combined 63% share.
BYD: No.1 in China and No. 6 in the world by installed capacity of EES and a representative of lithium-ion battery roadmap. LiFePo4 battery technology for energy storage stations presents clear cost and service life advantages. Customers in energy storage field include State Grid Corporation of China, China Southern Power Grid Co., Ltd, China General Nuclear Power Group, etc.
Dalian Rongke Power: a world-leading supplier of vanadium redox batty (VRB) energy storage system and has the largest installed capacity among Chinese flow battery companies.
Zhejiang Narada Power Source: the largest installed capacity among lead storage battery companies; industry-leading lead-carbon battery storage technology already applied to renewable energy storage, distributed generation μgrid, residential energy storage, etc.
Global and China Electrical Energy Storage(EES) Industry Report, 2016-2020 highlights the followings:
 Global installed capacity of EES (scale and forecast, technology roadmap, application, competitive landscape, etc.);
China’s installed capacity of EES (scale and forecast, technology roadmap, application, competitive landscape, etc.);
Global and Chinese market segments (pumped storage, lithium battery, flywheel energy storage, flow battery, supercapacitor, etc.);
Global and Chinese application markets (wind power, PV, distributed generation, microgrid, etc.) and demand for energy storage;
21 major global and Chinese companies (operation, EES business, etc.)
1 Overview of EES
1.1 Overview
1.2 Application
1.3 Technology
1.4 Industrial Chain
2 Global EES Industry
2.1 Policy
2.2 Scale of Energy Storage
2.3 Application
2.4 Financing
2.5 Competitive Landscape
3 EES Industry in China
3.1 Policy Environment
3.2 Technology Environment
3.3 Scale of Energy Storage
3.4 Application
3.5 Competitive Landscape
3.6 Development Trend
4 Market Segments of EES
4.1 Pumped Hydro Storage
4.1.1 Global
4.1.2 China
4.2 Lithium Battery
4.2.1 Global
4.2.2 China
4.3 Flywheel Energy Storage
4.4 Flow Battery Energy Storage
4.4.1 Global
4.4.2 China
4.5 Compressed Air Energy Storage
4.6 Sodium-sulfur Battery
4.7 Supercapacitor
4.7.1 Global
4.7.2 China
5 Upstream Raw Materials of EES
5.1 Energy Storage Converter
5.2 Battery Management System
6 Applications of EES
6.1 Wind Power Generation
6.1.1 Global
6.1.2 China
6.2 PV Power Generation
6.2.1 Global
6.2.2 China
6.3 Distributed Generation and Microgrid
6.4 Peak Shaving
7 Major Global Energy Storage Enterprises
7.1 LG Chem
7.1.1 Operation
7.1.2 Energy Storage Business
7.2 Axion Power
7.2.1 Profile
7.2.2 Energy Storage Business
7.3 Beacon power
7.3.1 Profile
7.3.2 Energy Storage Business
7.4 GE
7.4.1 Profile
7.4.2 Operation
7.4.3 Energy Storage Business
7.5 Maxwell Technologies
7.5.1 Profile
7.5.2 Operation
7.5.3 Energy Storage Business
7.6 Altairnano Technologies
7.6.1 Profile
7.6.2 Energy Storage Business
7.7 Brief Summary
8 Major Chinese Energy Storage Enterprises
8.1 Shandong Sacred Sun Power Source Co., Ltd.
8.1.1 Profile
8.1.2 Operation
8.1.3 Revenue Structure
8.1.4 Gross Margin
8.1.5 Energy Storage Business
8.1.6 Prospects and Forecast
8.2 Zhejiang Narada Power Source Co., Ltd.
8.2.1 Profile
8.2.2 Operation
8.2.3 Revenue Structure
8.2.4 Gross Margin
8.2.5 Energy Storage Business
8.2.6 Prospects and Forecast
8.3 Shenzhen Inovance Technology Co., Ltd.
8.3.1 Profile
8.3.2 Operation
8.3.3 Energy Storage Business
8.4 Zhongtian Technology Co., Ltd.
8.4.1 Profile
8.4.2 Operation
8.4.3 Energy Storage Business
8.5 Fengfan Co., Ltd.
8.5.1 Profile
8.5.2 Operation
8.5.3 Revenue Structure
8.5.4 Gross Margin
8.5.5 Energy Storage Business
8.5.6Prospects and Forecast
8.6 BYD
8.6.1 Profile
8.6.2 Operation
8.6.3 Revenue Structure
8.6.4 Gross Margin
8.6.5 Energy Storage Business
8.6.6 Prospects and Forecast
8.7 Sungrow Power Supply Co., Ltd.
8.7.1 Profile
8.7.2 Operation
8.7.3 Revenue Structure
8.7.4 Gross Margin
8.7.5 Energy Storage Business
8.7.6 Prospects and Forecast
8.8 Shanghai Electric Co., Ltd
8.8.1 Profile
8.8.2 Operation
8.8.3 Energy Storage Business
8.9 Sunwoda Electronic Co., Ltd.
8.9.1 Profile
8.9.2 Operation
8.9.3 Revenue Structure
8.9.4 Gross Margin
8.9.5 Energy Storage Business
8.9.6 Prospects and Forecast
8.10 Shenzhen Clou Electronics Co., Ltd.
8.10.1 Profile
8.10.2 Operation
8.10.3 Revenue Structure
8.10.4 Gross Margin
8.10.5 Energy Storage Business
8.10.6 Prospects and Forecast
8.11 Prudent Energy
8.11.1 Profile
8.11.2 Energy Storage Business
8.12 RAY Power
8.12.1 Profile
8.12.2 Energy Storage Business
8.13 Dalian Rongke Power Co., Ltd.
8.13.1 Profile
8.13.2 Energy Storage Business
8.14 Shandong Realforce Enterprises Co., Ltd.
8.14.1 Profile
8.14.2 Energy Storage Business
8.15 China Aviation Lithium Battery Co., Ltd.
8.15.1 Profile
8.15.2 Energy Storage Business
9 Summary and Forecast
9.1 Summary
9.1.1 Installed Capacity
9.1.2 Technology Roadmap
9.1.3 Application
Applications of Energy Storage
Application of Energy Storage in Smart Grid
Application of Energy Storage in Electric Power System
Classification of Energy Storage Technologies
Technical Indicators of Currently Mainstream Electrical Energy Storage (I)
Technical Indicators of Currently Mainstream Electrical Energy Storage (II)
Comparison in Maturity of Major Energy Storage Technologies
Comparison in Costs of Various Energy Storage Technologies
Trends in Costs of Various Energy Storage Technologies
Energy Storage Industry Chain
Major Incentive Policies on Energy Storage in Major Countries
Cumulative Installed Capacity of Electrical Energy Storage Worldwide, 2010-2015
Global Electrical Energy Storage Market Structure by Region, 2015
Proportion of Electrical Energy Storage Technologies Worldwide by Application, 2015
Installed Capacity of Global Proposed/Ongoing Electrical Energy Storage Projects by Technology Roadmap, 2015
Percentage of Installed Energy Storage Projects Worldwide by Type, 2015
Global Top 5 Electrical Energy Storage Enterprises by Financing and Their Financing Amount, 2015
Global Distribution of Energy Storage Technology Suppliers by Country, 2015
Global TOP 10 Energy Storage Enterprises, 2015
China’s Policies on Energy Storage Industry, 2011-2016
Installed Capacity of Electrical Energy Storage in China, 2000-2015
Proportion of Electrical Energy Storage Technologies in China by Application, 2015
Distribution of Energy Storage Projects in China by Region
Percentage of Installed Energy Storage Projects in China by Type, 2015
TOP10 Energy Storage Enterprises in China by Installed Capacity, 2015
Leading Energy Storage Enterprises and Technology Roadmaps in China
Innovative Technology Roadmap for Advanced Energy Storage Technologies in China
Installed Capacity of Major Pumped Storage Power Stations Worldwide, 2015
Installed Capacity of Pumped Storage in China, 2010-2015
Shipments of Power Lithium Batteries in China, 2011-2015
Proportion of Automotive Power Lithium Battery Manufacturers in China by Shipment, 2015
Installed Capacity (by Application) and Project Proportion of Flywheel Energy Storage Worldwide, 2015
Installed Capacity of Major Flywheel Energy Storage Enterprises Worldwide, 2015
Development History of All-vanadium Redox Flow Battery
Chinese Vanadium Battery Enterprises and Their Business Scope
Major Chinese Energy Storage Converter Manufacturers and Their Products
Classification of Battery Management System Manufacturers in China and Typical Enterprises
Major Global and Chinese Battery Management System Manufacturers, 2015
New Installed Capacity of Wind Power Worldwide, 2001-2016
Cumulative Installed Capacity of Wind Power Worldwide, 2001-2016
Global Wind Power Installed Capacity by Region, 2014-2015
TOP 10 Countries Worldwide by New Wind Power Installed Capacity and Their Proportion, 2015
TOP 10 Countries Worldwide by Cumulative Wind Power Installed Capacity and Their Proportion, 2015
Policies on Wind Power in China, 2012-2016
New and Cumulative Wind Power Installed Capacity in China, 2005-2020E
New Wind Power Installed Capacity in China by Province, 2015
Cumulative Installed Capacity of Wind Power in China by Province, 2015
New Wind Power Installed Capacity of Major Enterprises in China, 2015
Cumulative Wind Power Installed Capacity of Major Enterprises in China as of the end of 2015
Demand for Wind Power Storage, 2009-2016
Annually Added Installed Capacity and Growth Rate of Grid-Connected PV Worldwide, 2009-2016
Cumulative PV Installed Capacity Worldwide by Region, 2015
Output of Solar Cells Worldwide by Region, 2009-2015
New and Cumulative PV Installed Capacity in China, 2009-2020E
PV Installed Capacity in China by Province, 2015
Energy Storage Demand of PV Power Generation in China, 2009-2015
Revenue and Net Income of LG Chem, 2011-2015
Revenue and Net Income of GE, 2011-2015
Maxwell’s Industrial Layout
Major Energy Storage Companies Worldwide
Revenue and Net Income of Sacred Sun, 2011-2015
Revenue Breakdown of Sacred Sun (by Product), 2013-2015
Revenue Structure of Sacred Sun (by Product), 2013-2015
Revenue Breakdown of Sacred Sun (by Region), 2013-2015
Revenue Structure of Sacred Sun (by Region), 2013-2015
Gross Margin of Sacred Sun (by Product), 2013-2015
Key Energy Storage Projects of Sacred Sun, 2013-2015
Revenue and Net Income of Sacred Sun, 2015-2020E
Revenue and Net Income of Zhejiang Narada Power Source, 2011-2015
Revenue Breakdown of Zhejiang Narada Power Source (by Sector), 2013-2015
Revenue Structure of Zhejiang Narada Power Source (by Sector), 2013-2015
Revenue Breakdown of Zhejiang Narada Power Source (by Product), 2013-2015
Revenue Structure of Zhejiang Narada Power Source (by Product), 2013-2015
Revenue Breakdown of Zhejiang Narada Power Source (by Region), 2012-2015
Revenue Structure of Zhejiang Narada Power Source (by Region), 2012-2015
Gross Margin of Zhejiang Narada Power Source (by Sector), 2013-2015
Gross Margin of Zhejiang Narada Power Source (by Product), 2013-2015
Some Energy Storage Projects Won with Lead Carbon Battery Technology Roadmap of Zhejiang Narada Power Source
Revenue and Net Income of Zhejiang Narada Power Source, 2015-2020E
Revenue and Net Income of Shenzhen Inovance Technology, 2011-2015
Revenue and Net Income of Zhongtian Technology, 2011-2015
Revenue and Net Income of ZTT Energy Storage Technology, 2013-2015
Revenue and Net Income of Fengfan Co.,2011-2015
Revenue Breakdown of Fengfan Co. (by Product), 2013-2015
Revenue Structure of Fengfan Co. (by Product), 2013-2015
Revenue Breakdown of Fengfan Co. (by Region), 2013-2015
Revenue Structure of Fengfan Co. (by Region), 2013-2015
Gross Margin of Fengfan Co.(by Product), 2013-2015
Revenue and Net Income of BYD, 2011-2015
Revenue Breakdown of BYD (by Product), 2013-2015
Revenue Structure of BYD (by Product), 2013-2015
Revenue Breakdown of BYD (by Region), 2013-2015
Revenue Structure of BYD (by Region), 2013-2015
Gross Margin of BYD’s Main Products, 2012-2015
Revenue and Net Income of BYD, 2014-2020E
Revenue and Net Income of Sungrow Power Supply, 2011-2015
Revenue Breakdown of Sungrow Power Supply (by Product), 2013-2015
Revenue Structure of Sungrow Power Supply (by Product), 2013-2015
Revenue Breakdown of Sungrow Power Supply (by Region), 2013-2015
Revenue Structure of Sungrow Power Supply (by Region), 2013-2015
Gross Margin of Sungrow Power Supply (by Product), 2013-2015
Revenue and Net Income of Sungrow Power Supply, 2015-2020E
Revenue and Net Income of Shanghai Electric, 2011-2015
Revenue and Net Income of Sunwoda Electronic, 2011-2015
Revenue Breakdown of Sunwoda Electronic (by Product), 2013-2015
Revenue Structure of Sunwoda Electronic (by Product), 2013-2015
Revenue Breakdown of Sunwoda Electronic (by Region), 2013-2015
Revenue Structure of Sunwoda Electronic (by Region), 2013-2015
Gross Margin of Sunwoda Electronic (by Product), 2013-2015
Revenue and Net Income of Sunwoda Electronic, 2015-2020E
Revenue and Net Income of Shenzhen Clou Electronics, 2011-2015
Revenue Breakdown of Shenzhen Clou Electronics (by Product), 2013-2015
Revenue Structure of Shenzhen Clou Electronics (by Product), 2013-2015
Revenue Breakdown of Shenzhen Clou Electronics (by Region), 2013-2015
Revenue Structure of Shenzhen Clou Electronics (by Region), 2013-2015
Gross Margin of Shenzhen Clou Electronics (by Product), 2013-2015
Revenue and Net Income of Shenzhen Clou Electronics, 2015-2020E
KW-level VRB Energy Storage System Application Projects of Prudent Energy
MW-level VRB Energy Storage System Application Projects of Prudent Energy
Key Energy Storage Projects of Rongke Power
Global and Chinese Electrical Energy Storage Installed Capacity, 2010-2015
Installed Capacity Structure of Global and Chinese Electrical Energy Storage by Energy Storage Technology, 2015
Installed Capacity Structure of Global and Chinese Electrical Energy Storage by Application, 2015
Top10 Global and Chinese Electrical Energy Storage Enterprises by Installed Capacity and Their Percentage, 2015
Cumulative Installed Capacity of Global and Chinese Electrical Energy Storage, 2015-2020E
Global and China Wind Farm O&M Industry Report, 2017-2021
As the wind power installed capacity grows and the warranty period of a large number of wind turbines is coming to an end, wind farm O & M has become the focus of the industry. In 2016, the global...
Global and China Electrical Energy Storage (EES) Industry Report, 2016-2020
Energy storage finds widespread application in power system, involving power generation, transmission, distribution, and end users. Global cumulative installed capacity of electrical energy storage (E...
Global and China Wind Farm Operation and Maintenance Industry Report, 2015-2018
In 2014, the global wind farm O & M market size hit USD9.25 billion, representing a year-on-year growth rate of 25.8%; by 2018, the market size is expected to reach USD13.78 billion. The mainstrea...
China Energy Storage for Grid System Industry Report, 2015-2018
Energy storage finds wide application in electric power system, involving all aspects of power generation, transmission, distribution and end user. Technically, energy storage for grid system can be d...
China Energy Conservation Service Industry Report, 2015
Energy conservation service industry provides service and support for enterprises and projects in terms of energy conservation and emission reduction. An Energy Service Company, more commonly referred...
China Natural Gas Fueling Station Equipment Industry Report, 2015-2018
According to different fuels used by natural gas stations, gas station equipment can be divided into compressed natural gas (CNG) station equipment and liquefied natural gas (LNG) station equipment. T...
China Filling Station and Gas Station Industry Report,2015-2018
Filling Stations By the end of 2014, China had run a total of 99,000 filling stations, each of which served 1,456 civilian cars; Shandong, Hebei, Henan, Guangdong and Jiangsu ranked top five by the nu...
China Biodiesel Industry Report, 2014-2017
Biodiesel refers to a renewable diesel fuel made from oil crops, animal fats, food waste oil that can substitute petroleum diesel and has environmental protection, safety, renewability and other advan...
China Filling Station And Refueling Station Industry Report,2013-2016
By the end of 2012, China has had a total of 96,313 filling stations, an increase of 875 or up 0.92% compared to 2011, including 51,854 SOE filling stations (53.8% of the total), 42,425 private fillin...