China Bus Industry Report, 2017-2021
-
Aug.2017
- Hard Copy
- USD
$2,700
-
- Pages:115
- Single User License
(PDF Unprintable)
- USD
$2,500
-
- Code:
ZJF107
- Enterprise-wide License
(PDF Printable & Editable)
- USD
$3,900
-
- Hard Copy + Single User License
- USD
$2,900
-
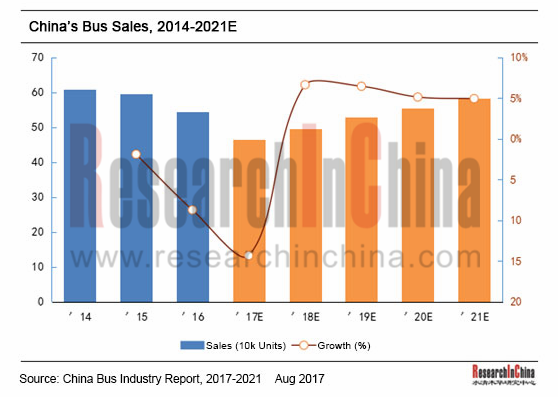
China bus industry has entered a period of adjustment in recent years following a phase of rapid growth with bus output and sales presenting downward trends (a year-on-year fall of 7.4% and 8.7% in 2016 and 15.3% and 14.0% in the first half of 2017, respectively). Over the next couple of years, the bus market may well decline due to smaller new energy vehicle subsidies, higher technical barriers and competition from high-speed rail; however, urban bus network and alternative demand from new energy vehicles can still provide some impetus to the bus industry. Hence, the country’s output and sales of bus are expected to reach 572,400 units and 582,700 units in 2021, representing a CAGR of 0.9% and 1.4% over 2016, respectively.
?
Market structure: Large and medium-sized buses grew rapidly while light bus fell at a faster rate in 2016. The output and sales of large bus were 90,200 units and 90,400 units, up 5.23% and 6.91% year on year, respectively; for medium-sized bus, 99,000 units were produced and 99,400 units sold, a 26.60% and 26.07% rise over the previous year separately; regarding light bus, 357,700 units were produced and 353,600 units sold, down 16.22% and 18.14% from a year ago individually. The bus market slid across the board in the first half of 2017 with the output and sales of large bus going down 18.26% and 17.38% to 28,500 units and 27,900 units respectively, of medium-sized bus down 37.54% and 36.36% to both 26,000 units, and of light bus down 9.71% and 8.32% to 164,200 units and 166,500 units separately, all on year-on-year basis.
Competitive landscape: relatively stable but highly concentrated. In 2016, top10 bus makers seized a combined market share of 71.47% and top5 ones 49.58%. With complete product lines (large, medium-sized and light buses), Yutong Bus and Xiamen King Long Motor Group retained the top spots, while JMC, Shenyang Jinbei Automotive and Beiqi Foton Motor, by virtue of their numerical advantage of light bus, joined the top5 positions.
China Bus Industry Report, 2017-2021 highlights the following:
 Overview of the bus industry (definition & classification, development trends, industry policies, etc.);
Overview of the bus industry in China (output & sales, ownership, etc.);
Bus market segments (large, medium-sized and light buses) (output & sales, competitive landscape, etc.);
Chinese new energy bus market (output & sales, competitive landscape, industry policies, etc.);
Bus industry chain in China (raw material markets, application markets, etc.);
16 makers including Yutong Bus, Zhongtong Bus, Xiamen King Long Motor Group, Dongfeng Automobile, Beiqi Foton Motor, JMCG and JAC (profile, financial position, output & sales, hit products, production bases, latest developments, etc.).
1 Industry Overview
1.1 Introduction to Product
1.2 Product Classification
1.3 Policies
1.4 Active Safety and Connected Car
1.4.1 Policy and Planning
1.4.2 Technical Standards
1.4.3 Enterprises’ Layout
2 Chinese Bus Market
2.1 Market Size
2.2 Market Structure
2.3 Competitive Landscape
2.3.1 Market Share
2.3.2 Performance Comparison
2.4 Market Segments
2.4.1 Coach
2.4.2 Public Bus
2.4.3 School Bus
2.5 Natural-gas Bus
3 Chinese Bus Market Segments
3.1 Large Bus
3.1.1 Market Size
3.1.2 Competitive Landscape
3.2 Medium-sized Bus
3.2.1 Market Size
3.2.2 Competitive Landscape
3.3 Light Bus
3.3.1 Market Size
3.3.2 Competitive Landscape
4 New Energy Bus Market
4.1 Market Size
4.2 Competitive Landscape
4.3 Industry Policies
4.3.1 Policies on Fiscal Subsidies
4.3.2 Policy of Cutting Subsidies for Diesel Oil and Increasing Subsidies for Electric Bus
4.3.3 Promotion and Assessment Methods
4.4 Technical Routes
4.5 Fuel-cell Bus
5 Bus Market Industry Chain
5.1 Upstream Raw Material Market
5.2 Key Components
5.2.1 Transmission
5.2.2 Wheel
5.2.3 New Energy Battery
5.3 Downstream Demand Market
5.3.1 Passenger Transport
5.3.2 High-speed Rail
5.3.3 Tourism
6 Major Enterprises
6.1 Zhengzhou Yutong Bus Co., Ltd.
6.1.1 Profile
6.1.2 Financial Position
6.1.3 Operating Revenue Structure
6.1.4 Output and Sales
6.1.5 New Energy Bus
6.1.6 Production Capacity
6.1.7 R&D Costs
6.1.8 Cost Structure
6.1.9 Components & Parts
6.1.10 Developments
6.1.11 Operational Prospects
6.2 Xiamen King Long Motor Group
6.2.1 Profile
6.2.2 Financial Position
6.2.3 Operating Revenue Structure
6.2.4 Operation of Major Subsidiaries
6.2.5 Output and Sales
6.2.6 New Energy Bus
6.2.7 Production Capacity
6.2.8 R&D Costs
6.2.9 Cost Structure
6.2.10 Developments
6.2.11 Operational Prospects
6.3 Zhongtong Bus and Holding Co., Ltd.
6.3.1 Profile
6.3.2 Financial Position
6.3.3 Operating Revenue Structure
6.3.4 Output and Sales
6.3.5 New Energy Bus
6.3.6 R&D Costs
6.3.7 Cost Structure
6.3.8 Developments
6.3.9 Operational Prospects
6.4 Beiqi Foton Motor Co., Ltd.
6.4.1 Profile
6.4.2 Financial Position
6.4.3 Operating Revenue Structure
6.4.4 Output and Sales
6.4.5 New Energy Bus
6.4.6 Production Capacity
6.4.7 R&D Costs
6.4.8 Operational Prospects
6.5 Anhui Ankai Automobile Co., Ltd.
6.5.1 Profile
6.5.2 Financial Position
6.5.3 Operating Revenue Structure
6.5.4 Output and Sales
6.5.5 New Energy Bus
6.5.6 Production Capacity
6.5.7 R&D Costs
6.5.8 Cost Structure
6.6 Liaoning SG Automotive Group Co., Ltd.
6.6.1 Profile
6.6.2 Financial Position
6.6.3 Operating Revenue Structure
6.6.4 Output and Sales
6.6.5 New Energy Business
6.6.6 Cost Structure
6.7 Yangzhou Asiastar Bus Co., Ltd.
6.7.1 Profile
6.7.2 Financial Position
6.7.3 Operating Revenue Structure
6.7.4 Output and Sales
6.7.5 New Energy Bus
6.7.6 R&D Costs
6.7.7 Cost Structure
6.8 BYD
6.8.1 Profile
6.8.2 Financial Position
6.8.3 Operating Revenue Structure
6.8.4 Output and Sales
6.8.5 New Energy Bus
6.8.6 Developments
6.9 Anhui Jianghuai Automobile Co., Ltd.
6.9.1 Profile
6.9.2 Financial Position
6.9.3 Operating Revenue Structure
6.9.4 Output and Sales
6.9.5 R&D Costs
6.9.6 Cost Structure
6.9.7 Operational Prospects
6.10 Shenyang Jinbei Automotive Co., Ltd.
6.10.1 Profile
6.10.2 Financial Position
6.10.3 Operating Revenue Structure
6.10.4 Output and Sales
6.10.5 R&D Costs
6.10.6 Cost Structure
6.10.7 Operational Prospects
6.11 Jiangling Motors Co., Ltd.
6.11.1 Profile
6.11.2 Financial Position
6.11.3 Operating Revenue Structure
6.11.4 Output and Sales
6.11.5 R&D Costs
6.11.6 Operational Prospects
6.12 Dongfeng Motor Corporation
6.12.1 Profile
6.12.2 Financial Position
6.12.3 Operating Revenue Structure
6.12.4 Output and Sales
6.12.5 R&D Costs
6.12.6 Cost Structure
6.12.7 Operational Prospects
Intelligent Operational Systems of Major Bus Enterprises in China
China’s Bus Output and Sales, 2005-2021E
Chinese Bus Market Structure, 2005-2021E
Top10 Bus Enterprises in China, 2014
Top10 Bus Enterprises in China, 2015
Top10 Bus Enterprises in China, 2016
Top10 Bus Enterprises in China, 2017
Revenue of Major Bus Enterprises in China, 2014-2017
Net Income of Major Bus Enterprises in China, 2014-2017
Gross Margin of Major Bus Enterprises in China, 2014-2017
Bus Sales in China by Application, 2014-2016
Chinese Large and Medium-sized Coach Market Structure by Application, 2016
Public Bus Sales in China, 2014-2016
School Bus Sales in China, 2009-2016
Natural-gas Bus Sales in China, 2014-2017
Large Bus and Chassis Output in China, 2005-2021E
Large Bus and Chassis Sales in China, 2005-2021E
Top10 Large Bus Makers in China, 2014
Market Share of Large Bus Chassis Enterprises in China, 2014
Top10 Large Bus Makers in China, 2015
Market Share of Large Bus Chassis Enterprises in China, 2015
Top10 Large Bus Makers in China, 2016
Market Share of Large Bus Chassis Enterprises in China, 2016
Top10 Large Bus Makers in China, 2017
Market Share of Large Bus Chassis Enterprises in China, 2017
Medium-sized Bus and Chassis Output in China, 2005-2021E
Medium-sized Bus and Chassis Sales in China, 2005-2021E
Top10 Medium-sized Bus Makers in China, 2014
Market Share of Medium-sized Bus Chassis Enterprises in China, 2014
Top10 Medium-sized Bus Makers in China, 2015
Market Share of Medium-sized Bus Chassis Enterprises in China, 2015
Top10 Medium-sized Bus Makers in China, 2016
Market Share of Medium-sized Bus Chassis Enterprises in China, 2016
Top10 Medium-sized Bus Makers in China, 2017
Market Share of Medium-sized Bus Chassis Enterprises in China, 2017
Light Bus and Chassis Output in China, 2005-2021E
Light Bus and Chassis Sales in China, 2005-2021E
Top10 Light Bus Makers in China, 2014
Market Share of Light Bus Chassis Enterprises in China, 2014
Top10 Light Bus Makers in China, 2015
Market Share of Light Bus Chassis Enterprises in China, 2015
Top10 Light Bus Makers in China, 2016
Market Share of Light Bus Chassis Enterprises in China, 2016
Top10 Light Bus Makers in China, 2017
Market Share of Light Bus Chassis Enterprises in China, 2017
New Energy Bus Output in China, 2016-2017
Top20 New Energy Bus Makers in China by Output, 2016-2017
Top20 Battery Electric Bus Makers in China by Output, 2016-2017
Top20 Plug-in Hybrid Bus Makers in China by Output, 2016-2017
Subsidy Standards for Electric Bus, 2017
Raw Material Costs of Major Bus Makers in China, 2014-2016
Market Share of Major Commercial Vehicle Transmission Producers in China
Major Suppliers of Commercial Vehicle Transmission in China
Wheel Hub Suppliers of Major Bus Makers in China
Highway Passenger Transportation in China, 2004-2017
High-speed Rail Mileage in China, 2013-2016
Total Tourism Revenue in China, 2001-2016
Number of Tourists during the Chinese Golden Week Holiday, 2008-2017
Main Financial Indicators of Yutong Bus, 2012-2017
Operating Revenue Structure of Yutong Bus by Business, 2013-2016
Operating Revenue Structure of Yutong Bus by Region, 2013-2016
Output and Sales of Yutong Bus by Product, 2012-2017
Sales Structure of Yutong Bus, 2015-2016
New Energy Bus Output of Yutong Bus, 2014-2017
New Energy Bus Sales of Yutong Bus, 2012-2016
New Energy Bus Sales of Yutong Bus by Type, 2015-2016
R&D Costs of Yutong Bus, 2009-2016
Product Cost Structure of Yutong Bus, 2014-2016
Revenue, Net Income, and Gross Margin of Yutong Bus, 2015-2021E
Main Financial Indicators of Xiamen King Long Motor Group, 2012-2017
Operating Revenue and Gross Margin of Xiamen King Long Motor Group's Major Products, 2015-2016
Operating Revenue Structure of Xiamen King Long Motor Group by Region, 2013-2016
Revenue and Net Income of Major Subsidiaries of Xiamen King Long Motor Group, 2014-2016
Bus Output of Subsidiaries of Xiamen King Long Motor Group, 2012-2017
Bus Sales of Subsidiaries of Xiamen King Long Motor Group, 2012-2017
Truck Output and Sales of Xiamen King Long Motor Group, 2012-2017
New Energy Bus Output of Xiamen King Long Motor Group, 2014-2017
New Energy Bus Sales of Xiamen King Long Motor Group by Length, 2015-2016
New Energy Bus Sales of Xiamen King Long Motor Group by Application, 2015-2016
Percentage of Key Parts Purchased by Xiamen King Long Motor Group for New Energy Bus
R&D Costs of Xiamen King Long Motor Group, 2010-2016
Cost Structure of Xiamen King Long Motor Group, 2013-2016
Revenue, Net Income, and Gross Margin of Xiamen King Long Motor Group, 2015-2021E
Main Financial Indicators of Zhongtong Bus, 2012-2017
Operating Revenue Structure of Zhongtong Bus by Business, 2013-2016
Operating Revenue Structure of Zhongtong Bus by Region, 2013-2016
Output and Sales of Zhongtong Bus, 2012-2017
New Energy Bus Output of Zhongtong Bus, 2014-2017
R&D Costs of Zhongtong Bus, 2012-2016
Cost Structure of Zhongtong Bus, 2013-2016
Revenue, Net Income, and Gross Margin of Zhongtong Bus, 2015-2021E
Main Financial Indicators of Beiqi Foton Motor, 2010-2017
Operating Revenue Structure of Beiqi Foton Motor by Business, 2014-2016
Operating Revenue Structure of Beiqi Foton Motor by Region, 2013-2016
Bus Output and Sales of Beiqi Foton Motor by Type, 2012-2017
New Energy Bus Output of Beiqi Foton Motor, 2014-2017
New Energy Bus Sales of FOTON AUV, 2013-2016
R&D Costs of Beiqi Foton Motor, 2010-2016
Revenue, Net Income, and Gross Margin of Beiqi Foton Motor, 2015-2021E
Financial Indicators of Anhui Ankai Automobile, 2012-2017
Operating Revenue Structure of Anhui Ankai Automobile by Business, 2015-2016
Operating Revenue Structure of Anhui Ankai Automobile by Region, 2013-2016
Output and Sales of Anhui Ankai Automobile, 2012-2017
New Energy Bus Output of Anhui Ankai Automobile, 2014-2017
R&D Costs of Anhui Ankai Automobile, 2010-2016
Cost Structure of Anhui Ankai Automobile, 2015-2016
Financial Indicators of SG Automotive Group, 2012-2017
Operating Revenue Structure of SG Automotive Group by Business, 2013-2016
Operating Revenue Structure of SG Automotive Group by Region, 2013-2016
Huanghai Bus Output and Sales Volume of SG Automotive Group, 2012-2017
Huanghai New Energy Bus Output of SG Automotive Group, 2014-2017
Cost Structure of SG Automotive Group, 2014-2016
Financial Indicators of Asiastar Bus, 2012-2017
Operating Revenue Structure of Asiastar Bus by Business, 2013-2016
Operating Revenue Structure of Asiastar Bus by Region, 2013-2015
Output and Sales of Asiastar, 2012-2017
New Energy Bus Sales Volume of Asiastar, 2014-2016
Asiastar’s Income from New Energy Bus Subsidies, 2015-2016
R&D Costs of Asiastar, 2010-2016
Cost Structure of Asiastar, 2014-2016
Financial Indicators of BYD, 2012-2017
Operating Revenue Structure of BYD by Business, 2013-2016
Operating Revenue Structure of BYD by Region, 2015-2016
Bus Output and Sales Volume of BYD, 2012-2017
Main New Energy Buses of BYD
Capacity and Output of BYD’s Major New Energy Bus Bases, 2016
Key Orders of BYD, 2016
Financial Indicators of JAC, 2012-2017
Operating Revenue Structure of JAC by Business, 2015-2016
Operating Revenue Structure of JAC by Region, 2013-2016
Bus Output and Sales of JAC, 2012-2017
R&D Costs of JAC, 2010-2016
Cost Structure of JAC, 2016
Revenue, Net Income, and Gross Margin of JAC, 2014-2021E
Financial Indicators of Jinbei Auto, 2012-2017
Operating Revenue Structure of Jinbei Auto by Business, 2013-2016
Operating Revenue Structure of Jinbei Auto by Region, 2013-2016
Commercial Vehicle Output and Sales of Jinbei Auto, 2012-2017
R&D Costs of Jinbei Auto, 2012-2016
Cost Structure of Jinbei Auto, 2014-2016
Revenue, Net Income, and Gross Margin of Jinbei Auto, 2015-2021E
Financial Indicators of JMC, 2012-2017
Operating Revenue Structure of JMC by Business, 2013-2016
Bus Output and Sales of JMC, 2012-2017
R&D Costs of JMC, 2010-2016
Revenue, Net Income, and Gross Margin of JMC, 2015-2021E
Financial Indicators of Dongfeng Motor, 2012-2017
Operating Revenue Structure of Dongfeng Motor by Business, 2013-2016
Operating Revenue Structure of Dongfeng Motor by Region, 2013-2016
Bus Output and Sales of Dongfeng Motor, 2012-2017
R&D Costs of Dongfeng Motor, 2010-2016
Cost Structure of Dongfeng Motor, 2014-2016
Revenue, Net Income, and Gross Margin of Dongfeng Motor, 2015-2021E
Bus Output and Sales of SAIC MAXUS, 2012-2017
Capacity of SAIC MAXUS (including New Energy), 2016
Ongoing Projects of SAIC MAXUS, 2016
New Energy Vehicle Output, Sales Volume, and Revenue of SAIC MAXUS, 2015-2016
OEMs and Tier1s’ Intelligent Cockpit Platform (Hardware and Software) Innovation Strategy Research Report, 2026
Intelligent Cockpit Platform Research: multi-dimensional cockpit system architecture reconstruction for multi-agent collaboration and proactive intelligent services
The intelligent cockpit software s...
Automotive AIOS Research Report, 2026
Automotive AIOS Research: Mass Production Solutions Are Implemented
Mass Production Solutions Are Implemented on A Small Scale.
In 2026, AIOS starts small-scale implementation, helping to improve v...
Automotive Telematics Service Provider (TSP) Research Report, 2026
TSP Research: Leading providers collectively turn to AI agents to provide all-scenario active services
Telematics Service Providers (TSPs) are the core hub of the telematics industry chain, connectin...
Automotive Smart Interior Research Report, 2026
Smart Interior Research: As Technologies like Interactive Starlight Headliner, Hidden Display and Surface Projection Are Launched, Automotive Interiors Become Ever More Intelligent
The Automotive Sma...
Research Report on AI Applications in Cockpits, 2026
AI Application in Cockpits: AI Services Become More Comprehensive, Convenient, and Refined.
In the first half of 2026, cockpit AI functions underwent initial upgrades across multiple dimensions, inc...
Software-Defined Vehicles in 2026: OEM Software Development and Supply Chain Deployment Strategy Research Report
Research on OEMs’ Software Strategies: R&D Focus, Development Strategies and Supplier Building Models of 30 OEMs
In this paper, we adopt a research framework covering 13 subsystems and 48 sub-di...
Passenger Car Chassis Domain Control and Chassis Cross-Domain Integration Research Report, 2026
Chassis Control Research: Mass Production of Full Chassis-by-Wire Solutions Starts
1. A Cluster of Full Chassis-by-Wire Solutions Make Their Debut, and EMB Enters Mass Production and Adoption for the...
Central Domain Control (Powertrain, Chassis, Body) and Motion Controller Research Report, 2026
Central Domain Control and Motion Control Research: XYZ Coordinated Control and Full X-by-Wire Actuation System
With the gradual penetration of L3+ autonomous driving, the chassis control system is ...
48V Low-voltage Power Distribution Network (PDN) Architecture and Supply Chain Panorama Research Report, 2026
Research on 48V Low-Voltage Power Distribution Network (PDN): An Active 48V Supply Chain, with Priority Deployment in High-Power Scenarios Such as Steer-by-Wire Chassis
The automotive 48V low-voltage...
AI-Defined Vehicle (AIDV) OEMs' Deployment Strategies Research Report, 2026
AIDV Research: Deployment Strategies of 22 OEMs
The AI-Defined Vehicle (AIDV) OEMs' Deployment Strategies Research Report, 2026, released by ResearchInChina, analyzes the AI deployment strategies of ...
OEMs’ Passenger Car Model Planning Research Report, 2026
Vehicle Model Planning Research: Chinese OEMs Launch Sub-Brands Intensively, While Multinational OEMs Apply the Brakes to Electrification Strategies
ResearchInChina released the OEMs’ Passenger Car M...
Autonomous Driving Simulation and World Model Research Report, 2026
Autonomous driving simulation research: "Simulation test + world model"-driven test system has become R&D infrastructure.
The "Autonomous Driving Simulation and World Model Research Report, 2026"...
Cockpit-Driving Integration Central Domain Controller SoC and AI Supercomputing Architecture Research Report, 2026
Cockpit-Driving integration and AI supercomputing research: The One Chip solution is rapidly installed in vehicles, and AI supercomputing architectures are moving towards full-domain integration.
AI ...
Intelligent Driving End-to-End Large Model Research Report, 2026
Research on Intelligent Driving Large Models: A Critical Period for Technological Competition and Paradigm Integration
As autonomous driving technology rapidly iterates from L2 to L3?L4, intelligent...
Automotive Digital Key Industry Trend Report, 2026
Digital Key Research: Automotive BLE, UWB and SLE Hardware Layout
The Automotive Digital Key Industry Trend Report, 2026, released by ResearchInChina, analyzes and predicts the digital key market, co...
Monthly Report on Automotive New Technology (May 2026)
UHD gaze technology, full-color LiDAR, UWB, etc. promote the upgrade of intelligent driving perception capabilities
This report is published once a month and is available for annual subscription.The...
In-Cabin Monitoring Systems (DMS, OMS, etc.) Research Report, 2026
In-Cabin Monitoring System Research: DMS to Become Mandatory in 2027, Expected to be Installed in Over 14 Million Vehicles
ResearchInChina released the In-Cabin Monitoring Systems (DMS, OMS, etc.) Re...
Automotive Service-Oriented Architecture (SOA) and Cross-Domain Middleware Industry Report, 2026
Research on automotive SOA and cross-domain middleware: The era of AI atomic services and AI cross-domain fusion agents is coming.
Automotive SOA evolves towards AI + full SOA servitization Driv...