Global and China Aluminum Heat Transfer Material Industry Report, 2013-2016
-
Mar./2014
- Hard Copy
- USD
$2,300
-
- Pages:93
- Single User License
(PDF Unprintable)
- USD
$2,200
-
- Code:
CYH023
- Enterprise-wide License
(PDF Printable & Editable)
- USD
$3,400
-
- Hard Copy + Single User License
- USD
$2,500
-
Aluminum heat transfer composites are mainly used in heat exchange systems of automobiles, home appliances, machinery and equipment as well as air-cooling systems of thermal power stations. In 2013, the global output of aluminum heat transfer composites reached about 1.34 million tons, representing a year-on-year increase of 7.2%. Affected by the global economic downturn and China's economic slowdown, the downstream demand for machinery, equipment, power stations, home appliances, etc. declined, resulting in the sluggish demand for aluminum heat transfer composites, with a growth rate of only 6.9% in 2013.
China is a major consumer of aluminum heat transfer composites in the world. In 2013, the rapid growth of Chinese automobile market effectively boosted the demand for aluminum heat transfer composites to 510,600 tons. Driven by Chinese automotive light-weighting, machinery and equipment, household appliances and other industries, China’s demand for aluminum heat transfer composites will continue to grow in the coming years.
The report focuses on the following aspects:
 Market supply and demand, market competition and development trends of the global aluminum heat transfer composites industry;
Supply and demand, market competition patterns and development trends of China aluminum heat transfer composites industry;
Demand of major Chinese aluminum heat transfer composites downstream industries;
Operation and Chinese business of 7 global aluminum heat transfer composites manufacturing enterprises;
Operation and development of 14 Chinese aluminum heat transfer composites manufacturing enterprises.
Capacity of Major Aluminum Heat Transfer Composites Enterprises in China, 2013
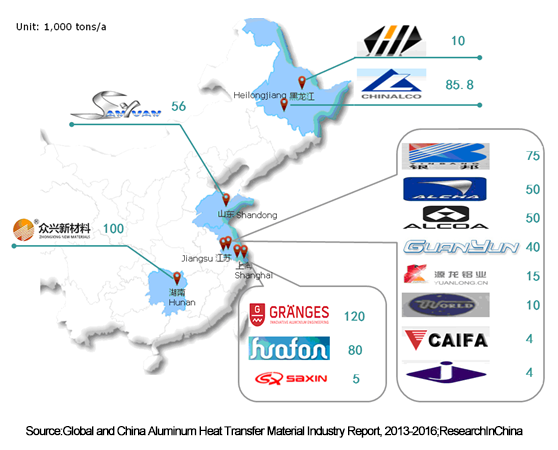
Note: The capacity of foreign-funded companies refers to the capacity of their subsidiaries in Chinese provinces.
On a global basis, the aluminum heat transfer composites market is monopolized by several large corporations from the United States, Europe, Japan, Canada, etc. With the rapid development of China automobile industry, foreign enterprises have set up factories in China. Subject to technical constraints and other reasons, Chinese companies started late, only a few companies such as Yinbang, Huafon Group and Northeast Light Alloy develop stably.
Sapa is the world's largest producer of aluminum profiles, and also one of major manufacturers of automotive aluminum heat transfer composites (sheets, strips, foils) in the world. Impacted by business mergers and acquisitions, Sapa established a wholly owned subsidiary - Granges specializing in aluminum heat transfer composites. Thus, Sapa’s Chinese subsidiary was renamed Granges Aluminum Heat Transfer (Shanghai) Co., Ltd. which is still engaged in the production of automotive heat transfer materials. In recent years, the subsidiary has continuously expanded its capacity; as of 2013, its capacity hit 120 kt/a.
Yinbang, as one of Chinese leaders in aluminum heat transfer composites, has increased investment in scientific research in recent years and successfully developed high-value-added products such as aluminum alloy composites and aluminum steel composite strips. In 2012, the company went public on A-share stock exchange and used the raised funds to build a laminated metal composites expansion project which is expected to go into operation in 2016 when the company’s total aluminum heat transfer composites capacity may hit 200 kt/a.
Huafon Nikkei Aluminium Corporation produces aluminum alloy heat transfer composites (sheets, strips, foils). The company was formerly know as Huafon Aluminum Co., Ltd whose shares were bought by Nippon Light Metal Co., Ltd. in November 2012. Currently, the company is constructing Civil Air Conditioner Aluminum Alloy Composites Project Phase II with annual capacity of 50,000 tons; upon completion, the company’s aluminum heat transfer composites capacity will attain 130 kt/a.
1 Overview of Aluminum Heat Transfer Composites
1.1 Definition
1.2 Classification
1.3 Industry Chain
1.4 Production Process
2 Status Quo of Global Aluminum Heat Transfer Composites Industry
2.1 Overview
2.2 Supply
2.3 Demand
3 Status Quo of China Aluminum Heat Transfer Composites Industry
3.1 Policy
3.2 Industrial Environment
3.3 Supply
3.4 Demand
4 Demand of Major Chinese Aluminum Heat Transfer Composites Downstream Industries
4.1 Automotive Industry
4.2 Machinery and Equipment
4.3 Air Cooling Systems of Power Plants
4.4 Household Appliances
5 Global Aluminum Heat Transfer Composites Manufacturers
5.1 ALCOA
5.1.1 Profile
5.1.2 Operation
5.1.3 Revenue Structure
5.1.4 R & D
5.1.5 Aluminum Rolling Business
5.1.6 Business in China
5.1.7 Alcoa Kunshan Aluminum Products Co., Ltd
5.2 Wickeder
5.2.1 Profile
5.2.2 Aluminum Heat Transfer Composites Business
5.2.3 Business in China
5.3 Granges (Sapa Heat Transfer)
5.3.1 Profile
5.3.2 Operation
5.3.3 Revenue Structure
5.3.4 Business in China
5.3.5 Granges Aluminum Heat Transfer (Shanghai) Co., Ltd. (formerly known as Sapa Heat Transfer (Shanghai) Ltd)
5.4 Norsk Hydro
5.4.1 Profile
5.4.2 Operation
5.4.3 Revenue Structure
5.4.4 R & D
5.4.5 Aluminum Heat Transfer Composites Business (Rolled Products)
5.4.6 Business in China
5.5 Aleris
5.5.1 Profile
5.5.2 Operation
5.5.3 Revenue Structure
5.5.4 Aluminum Heat Transfer Composites Business
5.5.5 Business in China
5.6 Novelis
5.6.1 Profile
5.6.2 Operation
5.6.3 Aluminum Heat Transfer Composites Business
5.7 Kobe Steel
5.7.1 Profile
5.7.2 Operation
5.7.3 Aluminum Heat Transfer Composites Business
5.7.4 Business in China
6 Chinese Aluminum Heat Transfer Composites Manufacturers
6.1 Yinbang (300337)
6.1.1 Profile
6.1.2 Operation
6.1.3 Revenue Structure
6.1.4 Gross Margin
6.1.5 Output and Sales Volume
6.1.6 Customers and Suppliers
6.1.7 R & D and Investment
6.1.8 Business Expansion
6.1.9 Development Prospect
6.2 Jiangsu ALCHA Aluminium Co., Ltd (002160)
6.2.1 Profile
6.2.2 Operation
6.2.3 Revenue Structure
6.2.4 Investment
6.2.5 Development Prospect
6.3 Northeast Light Alloy Co., Ltd
6.3.1 Profile
6.3.2 Operation
6.3.3 Revenue Structure
6.3.4 Gross Margin
6.3.5 Aluminum Alloy Output and Sales Volume
6.3.6 Investment
6.3.7 Development Prospect
6.4 Southwest Aluminum (Group) Co., Ltd
6.4.1 Profile
6.4.2 Operation
6.5 Huafon Nikkei Aluminium Corporation
6.5.1 Profile
6.5.2 Operation
6.6 Nantong Hua Te Aluminum Heat Transfer Co., Ltd
6.6.1 Profile
6.6.2 Capacity
6.6.3 R & D
6.7 Weifang Sanyuan Aluminum Co., Ltd
6.8 Nantong Hengxiu Aluminum Heat Transfer Material Co., Ltd
6.8.1 Profile
6.8.2 Operation
6.9 Harbin Song Run Metal Products Co., Ltd
6.9.1 Profile
6.9.2 Aluminum Heat Transfer Composites Business
6.10 Changsha Zhongxing Aluminum Co., Ltd
6.11 Others
6.11.1 Shanghai Saxin Aluminum Co., Ltd
6.11.2 Wuxi Guanyun Aluminum Co., Ltd
6.11.3 Xuzhou Caifa Aluminum Heat Transfer Co., Ltd
6.11.4 Zhenjiang Yuanlong Aluminum Co., Ltd
7 Conclusion and Forecast
7.1 Conclusion
7.2 Forecast
7.2.1 Global Market
7.2.2 Chinese Market
Structure and Properties of Aluminum Alloy Composites
Structure of Aluminum-based Multi-metal Composites
Industrial Chain of Aluminum-based Layered Metal Composites
Global Output of Aluminum Heat Transfer Composites, 2006-2013
Global Demand for Aluminum Heat Transfer Composites, 2006-2013
Policies Related with Aluminum Heat Transfer Composites in China, 2006-2013
China's Aluminum Output and YoY Growth, 2006-2013
China's Aluminum Alloy Output and YoY Growth, 2006-2013
China's Aluminum Heat Transfer Composites Capacity, 2006-2013
China’s Aluminum Heat Transfer Composites Capacity (by Product), 2006-2013
China’s Demand for Aluminum Heat Transfer Composites, 2006-2013
China’s Demand for Aluminum Heat Transfer Composites (by Product), 2006-2013
Quantity of Aluminum Heat Transfer Composites Used in Automotive Parts
Automobile Output & Ownership and Demand for Aluminum Alloy Composites in China, 2000-2016E
Machinery & Equipment Output and Demand for Aluminum Heat Transfer Composites in China, 2010-2016E
Newly Installed Capacity and Demand of Chinese Thermal Power Stations for Aluminum Heat Transfer Composites, 2011-2016E
China’s Air-conditioner Output and Demand for Aluminum Heat Transfer Composites, 2011-2016E
Alcoa’s Revenue and Net Income, 2007-2013
Alcoa’s Revenue Percentage (by Business), 2012
Alcoa’s Revenue Breakdown and Percentage (by Country/Region), 2010-2012
Alcoa’s R&D Costs and % of Total Revenue, 2007-2013
Alcoa’s Revenue and Profit of Rolled Products, 2009-2012
Alcoa’s Aluminum Rolled Product Subsidiaries and Products (by Country/Region), 2013
Alcoa’s Revenue in China and % of Total Revenue, 2009-2012
Main Products and Applications of Wickeder's EMS Division, 2013
Development History of Gr?nges, 1896-2013
Geographical Distribution of Granges
Sapa’s Heat Transfer Revenue and Operating Income, 2010-2013
Revenue Percentage of Granges (formerly Sapa’s Heat Transfer Business) (by Region), 2010-2012
Sapa’s Heat Exchanger Material Capacity, 1999-2013
Revenue and Net Income of Norsk Hydro, 2009-2013
Revenue Breakdown and Percentage of Norsk Hydro (by Business), 2011-2013
Revenue Breakdown and Percentage of Norsk Hydro (by Country/Region), 2010-2012
Rolling Products and Capacity of Norsk Hydro (by Factory), 2013
Distribution of Aluminum Heat Transfer Business of Norsk Hydro, 2013
Rolled Product Revenue and Profit of Norsk Hydro, 2010-2013
Rolled Product Sales Volume (by Downstream) of Norsk Hydro, 2011-2013
Rolled Product Output of Norsk Hydro for External Markets (by Factory), 2011-2012
Aleris’ Revenue and Net Income, 2008-2013
Aleris’ Revenue Breakdown and Percentage (by Business), 2010-2013
Aleris’ Revenue Breakdown and Percentage (by Region), 2010-2012
Aleris’ Aluminum Rolled Product Revenue (Business), 2010-2013
Aleris’ Aluminum Rolled Product Sales Volume (by Business), 2010-2013
Aleris’ Subsidiaries in China, 2013
Revenue and Net Income of Novelis, FY2008-FY2014
Business Structure of Kobe Steel, 2013
Sales and Net Income of Kobe Steel, FY2007-FY2014
Yinbang’s Revenue and Net Income, 2008-2013
Yinbang’s Revenue (by Business), 2008-2013
Yinbang’s Revenue (by Region), 2008-2013
Yinbang’s Gross Margin (by Business), 2008-2013
Yinbang’s Output, Sales Volume and Sales/Output Ratio (by Product), 2009-2011
Name List and Revenue Contribution of Yinbang’s Top 5 Clients, 2013H1
Yinbang’s R&D Costs and % of Total Revenue, 2009-2013
Yinbang’s Main Projects under Construction, 2013
Yinbang’s Revenue and Net Income, 2012-2016E
ALCHA’s Revenue and Net Income, 2008-2013
ALCHA’s Revenue (by Product), 2008-2013
ALCHA’s Revenue (by Region), 2008-2013
ALCHA’s Revenue and Net Income, 2012-2016E
Subsidiaries and Their Businesses of Northeast Light Alloy, 2013
Revenue and Net Income of Northeast Light Alloy, 2010-2013
Production Lines of Northeast Light Alloy, as of the end of Sep. 2013
Aluminum Alloy Revenue Breakdown and Percentage of Northeast Light Alloy (by Product), 2010-2013
Gross Margin of Northeast Light Alloy (by Product), 2010-2013
Aluminum Alloy Capacity and Output of Northeast Light Alloy (by Product), 2010-2013
Aluminum Alloy Sales Volume, Sales/Output Ratio and Price of Northeast Light Alloy (by Product), 2010-2013
Projects of Northeast Light Alloy under Construction, as of the end of Sep. 2013
Revenue and Net Income of Northeast Light Alloy, 2012-2016E
Revenue and Net Income of Southwest Aluminum, 2012-2013
Revenue Percentage of Southwest Aluminum (by Product)
Huafon’s Key Aluminum Heat Transfer Composites Projects, 2010-2013
Capacity of Aluminum Heat Transfer Composites of Nantong Hua Te, 2005-2013
Sanyuan’s Key Projects, 2011-2013
Major Clients of Nantong Hengxiu
Major Products and Applications of Guanyun Aluminum, 2013
Capacity of Aluminum Heat Transfer Products of Guanyun Aluminum, 2013
Revenue of Main Global and Chinese Aluminum Heat Transfer Composites Manufacturers, 2012-2013
Capacity of Major Aluminum Heat Transfer Composites Enterprises in China, 2013
Global Aluminum Heat Transfer Composites Output and Demand, 2011-2016E
China’s Aluminum Heat Transfer Composites Capacity and Demand, 2011-2016E
Global and China Photoresist Industry Report, 2021-2026
Since its invention in 1959, photoresist has been the most crucial process material for the semiconductor industry. Photoresist was improved as a key material used in the manufacturing process of prin...
Global and China Needle Coke Industry Report, 2021-2026
Needle coke is an important carbon material, featuring a low thermal expansion coefficient, a low electrical resistivity, and strong thermal shock resistance and oxidation resistance. It is suitable f...
Global and China 3D Glass Industry Report, 2021-2026
3D curved glass is light and thin, transparent and clean, anti-fingerprint, anti-glare, hard and scratch-resistant, and performs well in weather resistance. It is applicable to terminals such as high-...
Global and China Graphene Industry Report, 2020-2026
Graphene, a kind of 2D carbon nanomaterial, features excellent properties such as mechanical property and super electrical conductivity and thermal conductivity. Its downstream application ranges from...
Global and China 3D Glass Industry Report, 2020-2026
Global 3D glass market has been enlarging over the recent years amid demetallization of smartphone back covers and popularity of smart wearables, to approximately $2.86 billion in 2019 and to an estim...
Global and China Photoresist Industry Report, 2020-2026
In 2019, global photoresist market was valued at $8.3 billion, growing at a compound annual rate of 5.1% or so since 2010, and it will outnumber $12.7 billion in 2026 with advances in electronic techn...
Global and China Synthetic Diamond Industry Report, 2020-2026
While its mechanical property is given full play in fields like grinding and cutting, diamond with acoustic, optical, magnetic, thermal and other special properties, as superconducting material, intel...
Global and China Needle Coke Industry Report, 2020-2026
With the merits like small resistivity, excellent resistance to impact and good anti-oxidation property, needle coke has been widely used in ultra-high power graphite electrodes, nuclear reactor decel...
Global and China Optical Fiber Preform Industry Report, 2019-2025
Optical fiber preform, playing an important role in the optical fiber and cable industry chain, seizes about 70% profits of optical fiber. Global demand for optical fiber preform stood at 16.2kt in 20...
China Silicon Carbide Industry Report, 2019-2025
Silicon carbide (SiC) is the most mature and the most widely used among third-generation wide band gap semiconductor materials. Over the past two years, global SiC market capacity, however, hovered ar...
Global and China Photoresist Industry Report, 2019-2025
Photoresist, a sort of material indispensable to PCB, flat panel display, optoelectronic devices, among others, keeps expanding in market size amid the robust demand from downstream sectors. In 2018, ...
Global and China Graphene Industry Report, 2019-2025
Graphene is featured with excellent performance and enjoys a rosy prospect. The global graphene market was worth more than $100 million in 2018, with an anticipated CAGR of virtually 45% between 2019 ...
Global and China 3D Glass Industry Chain Report, 2019-2025
The evolution of AMOLED conduces to the steady development of 3D curved glass market. In 2018, the global 3D glass market expanded 37.7% on an annualized basis and reached $1.9 billion, a figure proje...
China Wood Flooring Industry Report, 2019-2025
With the better standard of living and the people’s desire for an elegant life, wood flooring sees a rising share in the flooring industry of China, up from 33.9% in 2009 to 38.9% in 2018, just behind...
Global and China Photovoltaic Glass Industry Report, 2019-2025
In China, PV installed capacity has ramped up since the issuance of photovoltaic (PV) subsidy policies, reaching 53GW in 2017, or over 50% of global total. However, the domestic PV demand was hit by t...
Global and China ITO Targets Industry Chain Report, 2019-2025
Featured by good electrical conductivity and transparency, ITO targets are widely applied to fields of LCD, flat-panel display, plasma display, touch screen, electronic paper, OLED, solar cell, antist...
Global and China MO Source Industry Report, 2019-2025
MO source is a key raw material for metal-organic chemical vapor deposition (MOCVD) process. Global MO source output ranged at 102.6 tons in 2018, a rise of roughly 4.6% from a year earlier, a figure ...
Global and China Bi-Metal Band Saw Blade Industry Report, 2018-2023
Chinese manufacturing rebounded in the wake of a pick-up in infrastructure construction between 2016 and 2018, so did the bi-metal band saw blade as a key integral of metal processing industry. In 201...