Global and China IC Advanced Packaging Equipment Industry Report, 2013-2014
-
Aug.2014
- Hard Copy
- USD
$2,500
-
- Pages:120
- Single User License
(PDF Unprintable)
- USD
$2,300
-
- Code:
ZYW181
- Enterprise-wide License
(PDF Printable & Editable)
- USD
$3,600
-
- Hard Copy + Single User License
- USD
$2,700
-
Global and China IC Advanced Packaging Equipment Industry Report, 2013-2014 mainly deals with the followings:
1. Overview of semiconductor industry
2. Status quo of memory and wafer foundry industry
3. Downstream market of semiconductor industry
4. Trend in emerging advanced packaging technology
5. Packaging equipment industry analysis and ranking
6. 15 major advanced packaging equipment vendors
Packaging equipment can fall into two categories: wafer level and die level. And the former is typically included in wafer equipment as it is used in the manufacturing of wafer. Wafer level packaging is primarily used in the following 5 fields, namely, Analog & Mixed Signal (including IPD, PA, PMU, Local Power, IC Driver, and Audio & Video), Wireless Connectivity (including Bluetooth+FM+WLAN Combo and GPS Single Chip), Optoelectronic (including CIS, AL Sensor), MEMS & Sensor (including Accelerometers, Gyroscope, RF-MEMS, Pressure Sensor, and Fingerprint Sensor), as well as Misc Logic and Memory (covering Logic gate and EEPROMs). And these applications mostly adopt the Fan-in design, with the number of Pin usually less than 20.
In future, WLCSP will be required to follow the Fan-out design to expand its applications. However, the current Fan-out design, which is not mature, restricts the application of wafer level packaging, leaving an untapped market potential for now. But if the Fan-out design is mature, WLCSP will embark on a new development stage.
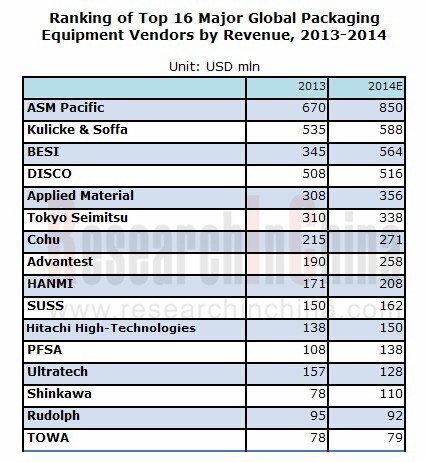
Wafer level packaging equipment consists of Process Tool (mainly including CVD and PVD, Etching, Sputtering), Packaging Lithography, Contact Probers, and Packaging Inspection. Among them, the main vendors of Process Tool are Applied Material (including the acquired NEXX) and ULVAC; the major companies in Packaging Lithography field are Ultratech, SUSS, and EV Group; the companies involved in Contact Probers are represented by Tokyo Seimitsu and Tokyo Electron(already acquired by Applied Material); the companies engaging in Packaging Inspection principally include Rudolph, Camtek, and KLA-TENCOR. In 2014, the market size of wafer packaging level equipment will be very likely to reach approximately USD1.3 billion.
Die packaging level equipment mainly involves Wire Bonder (main vendors are Kulicke & Soffa, ASM Pacific, and Shinkawa), Die Bonder (represented by ASM Pacific, Hitachi High Technologies, BESI, and Canon), Flip chip Bonder (typical vendors cover PFSA, BESI, ASM Pacific, Toray Engineering, and Hanmi), Test Handler (Delta Design, Advantest, Epson, and Tesec serve as the major players), Wafer Dicing Saws (players include DISCO and Tokyo Seimitsu), Molding/Encapsulation (Towa, BESI, Dai-ichi Seiko are the typical vendors), and Package singulation (Hanmi, ASM Pacific, and DISCO play the main role).
With obvious periodicity, semiconductor devices saw a rise during 2001-2007 but a slump in 2008-2009, while fiercely surged by 100% in 2011, then declined for 3 consecutive years from 2011. And in 2014, they will witness an explosive growth, with the estimated market size of die packaging level equipment rising significantly by 20% to USD4.1 billion. And this figure is projected to climb to USD4.3 billion in 2015 and then begin to fall in 2016. The major growth engine would be Die Bonder, Flip-chip Bonder, and Test Handler.
1. Global Semiconductor Industry
1.1 Overview
1.2 Supply Chain
1.3 Semiconductor Packaging Introduction
2. Upstream & Downstream of IC Packaging Industry
2.1 Semiconductor Industry by Location
2.2 Semiconductor Industry Capital Spending Trend
2.3 DRAM memory Industry
2.3.1 Status Quo
2.3.2 Market Share of DRAM memory Vendors
2.3.3 Market Share of Mobile DRAM memory Vendors
2.4 NAND Flash
2.5 Wafer Foundry Industry
2.6 Wafer Foundry Competition
2.7 Ranking in Wafer Foundry Industry
2.8 Mobile Phone Market
2.9 PC Market
2.10 Tablet PC Market
2.11 FPGA and CPLD Market
3. Packaging & Testing Technology Trend
3.1 Wide IO/HMC Memory
3.2 Embedded Component Substrate
3.3 Embedded Trace Substrate
3.4 IC Packaging for Handset
3.4.1 Status Quo
3.4.2 PoP Packaging
3.4.3 FOWLP
3.5 SIP Packaging
3.5.1 Murata
3.5.2 USI (Taiwan)
3.6 2.5D Packaging (SI/GLASS/ORGANIC INTERPOSER)
3.6.1 Introduction
3.6.2 Application
3.6.3 2.5D Interposer Market Size
3.6.4 Suppliers
3.7 TSV (3D) Packaging
3.7.1 Equipment
4. Packaging Equipment Industry
4.1 Market Size of Packaging &Testing Industry
4.2 Middle-end Packaging &Testing Industry
4.3 Market Size of Packaging Equipment
4.4 Market Share of Packaging Equipment
4.5 Ranking of Packaging Equipment Vendors
5. Packaging Equipment Vendors
5.1 ASM PACIFIC
5.2 KULICKE & SOFFA
5.3 BESI
5.4 ADVANTEST
5.5 HITACHI HIGH-TECHNOLOGIES
5.6 TERADYNE
5.7 DISCO
5.8 TOWA
5.9 HANMI
5.10 PFSA
5.11 SUSS MICROTEC
5.12 GROUP
5.13 SHINKAWA
5.14 TOKYO SEIMITSU
5.15 ULTRATECH
Semiconductor Industry Growth versus Worldwide GDP Growth, 1990-2014
Quarterly Revenue of Global Semiconductor Industry, 2012-2014
Breakdown of Global Semiconductor Market by Product, 2012-2018E
Semiconductor Outsourced Supply Chain
Semiconductor Company Systems
Semiconductor Outsourced Supply Chain Example
Top 25 Semiconductor Sales Leaders, 1Q2014
Worldwide IC Sales by Company Headquarters Location, 1990-2013
Fabless IC Sales Market Share by Company Headquarters Location (77.9B), 2013
Top 10 IC Manufacturers in China, 2008-2013
Top 10 Spenders Capital Spending Outlook, 2011-2014F
Top 5 Share of Total Semiconductor Capital Spending, 1994-2013
Worldwide Semiconductor Capital Spending Share of Full Year Budget, 1Q2014
Market Size of Global DRAM and NAND, 2008-2016E
DRAM Supply/Demand, 1Q2012-4Q2014
CAPEX of DRAM Industry, 2005-2015E
ASP of 4Gb DDR3, 2012-2014
ASP of 32Gb MLC NAND, 2012-2014
Ranking of Branded DRAM Vendors by Revenue, 2Q2013-1Q2014
Market Share of DRAM, Q12007-Q12014
Market Share of Mobile DRAM, 2009-2011
Market Share of Mobile DRAM, 2012
Ranking of Branded Mobile DRAM Vendors by Revenue, 2Q2013-1Q2014
Market Share of Branded NAND Flash Vendors, 2012
Market Share of Branded NAND Flash Vendors, 2014Q1
NAND Supply/Demand, 1Q2012-4Q2014
NAND Tech Migration Roadmap
Market Size of Global Foundry, 2008-2017E
Foundry Revenue of Advanced Nodes, 2012-2017E
Global Foundry Capacity by Node, 2012-2018E
Global Foundry Revenue by Node, 2012-2018E
Global Ranking by Foundry
Average IC Costs of Each Mobile Phone, 2008-2016E
Shipments of Global Mobile Phones, 2007-2015E
Worldwide Smartphone Sales to End Users by Vendor in 2013
Worldwide Smartphone Sales to End Users by Operating System, 2013
Worldwide Mobile Phone Sales to End Users by Vendor, 2013
Shipments of Global CPU and Discrete GPU for PC, 2008-2015E
Shipments of NB PC, 2008-2015E
Shipments of Global NB PC ODM Vendors, 2010-2013
Shipments of Global Tablet PC, 2011-2016E
Market Share of Major Tablet PC Brands, 2013
Output of Global Tablet PC Vendors, 2012-2013
MFPGA and CPLD Markets by Application and by Region, 2011
Market Share of Major FPGA Vendors, 1999-2013
Mobile DRAM Trend
Strengths of WIDE IO
SK Hynix WIDE IO2 Roadmap
HMC Architecture
HMC BENEFITS
Advantages of Embedded Passive/Active Substrate
Embedded Component Substrate Process
Comparison of Embedded Active & Passive Components
Roadmap of Embedded Passive Substrate
Structure Roadmap of Embedded Active Substrate
FOWLP and PLP Process Comparison
WHY Embedded Trace?
Embedded Trace Package Features
Embedded Trace Package Sweet Spot (for Wire Bonding)
Embedded Trace Package Sweet Spot (for FLIP CHIP)
Apple iPad 4 LTE A1459 IC Package Type List
Trend in PoP Packaging
Market Share of Major SiP Packaging Vendors, 2014
Sales and Operation Margin of Murata, FY 2009-FY 2014
Sales of Murata by Region, FY 2009-FY 2014
Revenue, New Orders and Backlog of Murata, 2011Q1-2014Q2
Operating Income and Net Income of Murata, 2011Q1-2014Q2
Order of Murata by Product, 2011Q1-2014Q2
Sales of Murata by Product, FY 2010-FY 2014
Murata Sales by Application, FY 2010-FY 2014
Revenue and Gross Margin of USI (Taiwan), 2008-2014
Quarterly Revenue and Gross Margin of USI (Taiwan), 2013Q1-2014Q2
Quarterly Revenue Breakdown of USI (Taiwan) by Product, 2013Q1-2014Q2
Revenue and Operating Income of USI (Shanghai), 2008-2014
Revenue Breakdown of USI (Shanghai) by Downstream, 2011-2013
Output of Various Products of USI (Shanghai), 2011-2013
2.5D Interposer Manufacturing Revenue
Breakdown by Interposer Bulk Material, 2010-2017E
TSV Downstream Application
TSV Equipment Suppliers
TSV Packaging Equipment Distribution, 2012-2017E
OSAT Market Size, 2006-2015E
Share of IC Package Added Value, 1990-2020E
Global IC Packaging Shipment by Type, 2011\2016E
Middle-End Packaging & Testing Process
Market Size of Die Level Packaging Equipment, 2007-2016E
Semi Equipment Book-to-bill, 2010Q1-2014Q2
Breakdown of Die Packaging Level Equipment by Product, 2013-2014
Wire Bonder Vendor Market Share, 2014
Flip-chip Bonder Vendor Market Share, 2014
Die Bonder Vendor Market Share, 2014
Test Handler Vendor Market Share, 2014
Branches of ASM
Product Line of ASM Pacific
Revenue and EBT of ASM Pacific, 2009-2014
Assets and Liabilities of ASM Pacific, 2009-2013
Revenue Breakdown of ASM Pacific by Business, 2012-2013
Quarterly sales trend by Business of ASM Pacific, 2007-2014E
EBIT Breakdown of ASM Pacific by Business, 2012-2013
Book-to-bill of ASM Pacific, 2007-2014
Revenue Breakdown of ASM Pacific by Region, 2012-2013
Revenue Breakdown of ASM Pacific by Product, 2011-2013
Capex/Sales of ASM Pacific, 1993-2015E
Revenue and Operating Margin of Kulicke & Soffa, FY 2007-FY 2014
Top 10 Clients of Kulicke & Soffa, FY 2011-FY 2013
Global Distribution of Kulicke & Soffa
Revenue of Kulicke & Soffa, 2011Q2-2014Q2
Operating Margin of Kulicke & Soffa, 2011Q2-2014Q2
R&D Costs of Kulicke & Soffa, 2011Q2-2014Q2
Wire Bonder Equipment Market, 2009-2018E
Copper Bonder Unit, 2012-2018E
BESI Organization
Revenue and Orders of BESI, 2009-2014
Revenue \Operation Margin\Net Margin of BESI, 2009-2014
Quarterly Revenue and Orders of BESI, 1Q2012-2Q2014
Quarterly Revenue and Net Margin of BESI, 1Q2012-2Q2014
Milestone of BESI
Quarterly Expense of BESI, 1Q12-2Q14
Quarterly Headcount of BESI, 1Q12-2Q14
Quarterly Cash and Debt of BESI, 1Q12-2Q14
Market Share of BESI, 2013
Revenue Breakdown of BESI by Product, 2013
BESI’s Product Position
BESI’s Products
BESI’s Global Operation
Revenue and Gross Margin of Advantest, 2Q12-2Q14
New Orders of Advantest, 2Q12-2Q14
Advantest Order by Business, FY 2013-Q1/FY 2015
Advantest Order by Region, FY 2013-Q1/FY 2015
Sales of Advantest by Business, FY 2013-Q1/FY 2015
Sales of Advantest by Region, FY 2013-Q1/FY 2015
Assets and Liabilities of Advantest, 2013Q3-2014Q2
Revenue and Operation Margin of Hitachi High-Technologies, FY 2007-FY 2015
Revenue Breakdown of Hitachi High-Technologies by Segment, FY 2011-FY 2015
Operation Margin Breakdown of Hitachi High-Technologies by Segment, FY 2011-FY 2014
Revenue Breakdown of Hitachi High-Technologies’ Electronic Device Systems by Business, FY 2013-FY 2015
Front-end Revenue Breakdown of Hitachi High-Technologies’ Electronic Device Systems by Field, FY 2014-FY 2015
Revenue and Operating Income of Teradyne, 2006-2014
Net Revenue of Teradyne by Country and % of Total Revenue, 2011-2013
Revenue Breakdown of Teradyne by Product, 2011-2014
Organization Chart of DISCO
Revenue and Operating Income of DISCO, FY 2010-FY 2015
Quarterly Consolidated Financial Results of DISCO, Q1/FY 2005-Q4/FY 2013
Quarterly Sales/Orders of DISCO, Q1/FY 2005-Q4/FY 2013
Quarterly Sales Breakdown of DISCO by Product, Q1/FY 2010-Q4/FY 2013
Product and Equipment Sales Breakdown, Q4/FY 2013
Equipment, Non-consolidated Cutting and Dicing Saws Sales Breakdown of DISCO by Application, FY 2012-FY 2013
Equipment, Non-consolidated Grinders and Polishers Sales Breakdown of DISCO by Application, FY 2012-FY 2013
Consolidated Sales Breakdown of DISCO by Region, FY 2012-FY 2013
Consolidated R&D/CAPEX Forecast of DISCO, FY 2000-FY 2014
Organization Chart of Towa
Revenue and Operating Income of TOWA, FY 2010-FY 2015
Revenue Breakdown of TOWA by Product, FY 2011-FY 2014
Orders Breakdown of TOWA by Product, FY 2011-FY 2014
Revenue Breakdown of TOWA by Region, FY 2011-FY 2014
Revenue and Operating Margin of Hanmi, 2010-2014
Revenue Breakdown of Hanmi by Product, 2007-2015E
Sales and EBITDA Margin of SUSS MicroTec, 2008-2014
Orders of SUSS MicroTec, 2008-2014
Sales and Orders of SUSS by Segment, 2014H1
Sales and Orders of SUSS by Region, 2014H1
Revenue and Operating Margin of Cohu, 2008-2014
Revenue Breakdown of Cohu by Product, 2008-2014
Revenue Breakdown of Cohu Semiconductor Equipment by Product, 2011-2013
Revenue and Operating Income of Shinkawa, FY 2009-FY 2015
Revenue Breakdown of Shinkawa by Product, FY 2011-FY 2014
Revenue Breakdown of Shinkawa by Region, FY 2011-FY 2014
Revenue and Operating Income of Tokyo Seimitsu, FY 2009-FY 2015
Revenue Breakdown of Tokyo Seimitsu by Product, FY 2012-FY 2015
Quarterly Sales of Tokyo Seimitsu’s Semiconductor Equipment, Q1/FY 2010-Q1/FY 2015
Quarterly Order of Tokyo Seimitsu’s Semiconductor Equipment, Q1/FY 2010-Q1/FY 2015
Revenue and Operating Margin of Ultratech, 2009-2014
Revenue Breakdown of Ultratech by Product, 2011-2013
Global and China PCB Industry Chain Panorama (Copper Clad Laminate, Copper Foil, Electronic Resin, Electronic Fabric, Special Equipment) Industry Research Report, 2026
PCB: The Core "Skeleton" and "Nerve Center" of Electronic Devices
Printed Circuit Board (PCB) refers to a circuit board that forms copper circuit patterns on a copper-clad laminate according to a pre...
Global and China CMOS Camera Module (CCM) Industry Report, 2020-2026
The global CCM market has been ballooning thanks to expeditious penetration of multi-camera phones and advances in automotive ADAS, being worth $22.723 billion with a year-on-year spike of 16.6% in 20...
Global and China Multi-Layer Ceramic Capacitor (MLCC) Industry Report, 2020-2025
Electronic components like MLCC enjoy a rosy prospect alongside the burgeoning electronic manufacturing, the thriving internet and the prevalence of smart hardware.
MLCC was much sought after and it...
Global and China Voice Coil Motor (VCM) Industry Report, 2019-2025
VCM (voice circle motor or voice coil actuator), a part for smartphone camera, shares around 6% of smartphone camera industry chain value.
Globally, popularity of smartphones such as those with mult...
Global and China Aluminum Electrolytic Capacitor Industry Report, 2019-2025
Chinese aluminum electrolytic capacitor market has been expanding amid a transfer of its downstream industries to China like home appliance illumination, cellphones and computers as well as automatic ...
Global and China Flexible Printed Circuit (FPC) Industry Report, 2019-2025
Flexible printed circuit (FPC) products make their way into consumer electronics like smartphone and tablet PC, in the form of modules for display, touch control, fingerprint recognition, etc. The vol...
Global and China GaAs Industry Report, 2019-2025
Gallium arsenide (GaAs), one of the most mature compound semiconductors, is an integral part of smartphone power amplifier (PA). In 2018, GaAs-based radio frequency (RF) seized over half of the GaAs w...
Global and China Advanced Packaging Industry Report, 2019-2025
The global semiconductor packaging and testing market is enlarging with the prevalence of consumer electronics, automotive semiconductors and the Internet of Things (IoT), with its size edging up 2.5%...
Global and China MLCC Electronic Ceramics Industry Report, 2019-2025
MLCC is mainly used in audio and video equipment, mobile phones, computers and automobiles. The prospective boom of MLCC formula powder hinges on demand: 1) The accelerated renewal of consumer electro...
Global and China OLED Industry Report, 2019-2025
OLED, a new-generation display technology, features simple display structure, green consumables and flexibility and can be rolled up, which makes it easier to transport and install without considering...
Global and China Camera Module Industry Report, 2019-2025
Affected by factors like the maturity of mobile phone markets worldwide and the prolonged replacement of mobile phone by users, the mobile phone market has undergone a slowdown in growth rate. From Q4...
Global and China Multi-Layer Ceramic Capacitor (MLCC) Industry Report, 2018-2023
MLCC finds most application in consumer electronics, automobile and industrial fields and gets beefed up remarkably with the approaching 5G era of cellphones and tablet PCs, the advances in automotive...
Global and China Aluminum Electrolytic Capacitor Industry Report, 2018-2023
Aluminum electrolytic capacitor, a core electronic component, is widely used in consumer electronics, computers and peripherals, industry, electric power, lighting and automobiles.
Global aluminum e...
Global and China CMOS Camera System Industry Report, 2017-2021
Global CCM (CMOS Camera Module) market was worth USD16.611 billion in 2015, a year-on-year rise of 3.8% from 2014, the slowest rate since 2010. Global market fell modestly in 2016 due to a drop in shi...
Global and China Organic Light-Emitting Diode (OLED) Industry Report, 2017-2021
Global OLED market size approximated USD15.7 billion in 2016, a 20.8% rise from a year earlier. Stimulated by reports that Apple will adopt OLED screen for multiple iPhone models in 2017-2018, OLED sc...
Global and China CMOS Camera System Industry Report, 2016-2020
Global and China CMOS Camera System Industry Report, 2016-2020 covers the following:1. Analysis of CMOS Image Sensor (CIS) Industry and Market, with 7 vendors involved.2. Analysis of CMOS Camera Lens ...
Global and China Multi-layer Ceramic Capacitor (MLCC) Industry Report, 2017-2020
The rapid development of consumer electronics and industrial intelligentization has greatly promoted the booming of passive components including multi-layer ceramic capacitor (MLCC). In 2015, China’s ...
Global PCB Industry Report, 2015-2020
Global PCB Industry Report, 2015-2020 highlights the followings:1. Global PCB Market and Status Quo of the Industry2. Global Downstream Markets of PCB3. Mobile Phone PCB Trends4. Tablet PC/Laptop Comp...