Global and China Gypsum Board Industry Report, 2014-2016
-
Sep.2014
- Hard Copy
- USD
$1,800
-
- Pages:78
- Single User License
(PDF Unprintable)
- USD
$1,700
-
- Code:
LT023
- Enterprise-wide License
(PDF Printable & Editable)
- USD
$2,700
-
- Hard Copy + Single User License
- USD
$2,000
-
Global gypsum board capacity was 12.2 billion square meters in 2013, up 8% from a year earlier, and North America was still the region with the largest capacity, accounting for 34%. However, Asia saw rapid expansion in gypsum board capacity in recent years, lagging only 2 percentage points behind North America in 2013. And, it is expected that Asia will surpass North America to be the world’s largest gypsum board production base.
China’s gypsum board output has been growing quickly during 2006-2013, at an average annual growth rate of 20.9%, and reached 2.7 billion square meters in 2013, a year-on-year jump of 27.3%. In 2013, 39.4% of China’s total gypsum board output was produced in East China, the largest producing region in the country. Demand for gypsum board in 2013 was 2.57 billion square meters, predominantly contributed by nonresidential public decoration.
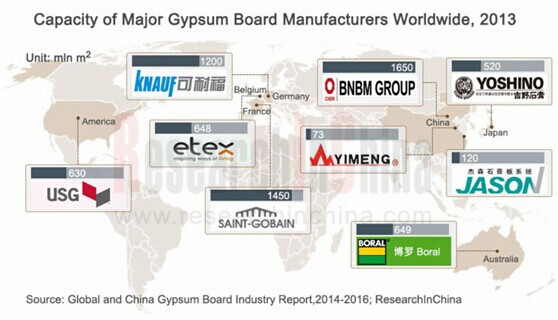
Beijing New Building Materials Public Limited Company is the largest gypsum board manufacturer around the world with the capacity of 1.65 billion square meters in 2013, occupying 47% of the Chinese gypsum board market. But most of local Chinese gypsum board producers are generally small in production scale and lack of market competitiveness. The companies that can compete with BNBM include mainly German Knauf, Australian BORAL, French Saint-Gobain and other foreign companies, with the former three companies taking up about 12% of the Chinese gypsum board market in 2013.
A glimpse of development trends of global gypsum board industry will enable us to find that the industry is shifting from North America to Asia, where most new gypsum board capacity will come. Over the next 2-3 years, hit by the national ban that the construction of buildings (including office building, conference building, auditorium, hostel, exhibition hall, memorial hall, club, sanatorium for army officer, nursing home and cadres dormitory and ward with high-grade decoration) be further restricted, the demand from governments will continue to decline, but favorable factors like steady rise in urbanization rate and renovation of shanty towns will prop up the growth of China gypsum board industry.
Global and China Gypsum Board Industry Report, 2014-2016 by ResearchInChina focuses on the following:
 Development of global gypsum board industry (overview and market supply & demand);
Development of gypsum board industry in major countries (including the United States, Britain, Russia, Japan and four countries in Southeast Asia);
Gypsum board supply and demand in China, forecast for next three years, and competitive landscape (regional competition and competition among enterprises);
Operation and gypsum board business of 8 global major gypsum board manufactures (including Saint-Gobain, USG, Etex, BORAL, etc.)
Operation and gypsum board business of 7 Chinese gypsum board manufacturers (including BNBM, Jason and King Coconut, etc.)
1. Overview of Gypsum Products
1.1 Overview of Gypsum Mine and Its Application
1.1.1 Mineral Overview
1.1.2 Grading of Mineral and Application
1.2 Classification of Gypsum Products
2. Development of Global Gypsum Board Industry
2.1 Supply
2.2 Demand
2.3 Development of Gypsum Board Industry in Major Countries
2.3.1 United States
2.3.2 Japan
2.3.3 Britain
2.3.4 Russia
2.3.5 Southeast Asia (Indonesia, Thailand, Vietnam, Malaysia)
3. Development of China Gypsum Board Industry
3.1 Gypsum Reserves and Distribution
3.2 Supply and Demand
3.3 Market Landscape
3.3.1 Regional Landscape
3.3.2 Competitive Landscape among Enterprises
3.4 Demand
3.4.1 Downstream Real Estate
3.4.2 Demand Structure
3.4.3 Demand Scale
4. Major Foreign Gypsum Board Companies
4.1 Saint-Gobain
4.1.1 Profile
4.1.2 Operation
4.1.3 Revenue Structure
4.1.4 Gross Margin
4.1.5 Gypsum Board Business
4.1.6 Gypsum Board Business in China
4.2 Knauf
4.2.1 Profile
4.2.2 Gypsum Board Business
4.2.3 Gypsum Board Business in China
4.3 BORAL
4.3.1 Profile
4.3.2 Operation
4.3.3 Revenue Structure
4.3.4 Gypsum Board Business
4.3.5 Gypsum Board Business in China
4.4 Lafarge
4.4.1 Profile
4.4.2 Operation
4.4.3 Revenue Structure
4.4.4 Gypsum Board Business
4.4.5 Gypsum Board Business in China
4.5 Etex
4.5.1 Profile
4.5.2 Operation
4.5.3 Revenue Structure
4.5.4 Gypsum Board Business
4.6 USG
4.6.1 Profile
4.6.2 Operation
4.6.3 Revenue Structure
4.6.4 Gypsum Board Business
4.7 National Gypsum (NGC)
4.8 Yoshino Gypsum
4.8.1 Profile
4.8.2 Gypsum Board Business
5. Major Chinese Gypsum Board Manufacturers
5.1 Beijing New Building Material
5.1.1 Profile
5.1.2 Operation
5.1.3 Revenue Structure
5.1.4 Gross Margin
5.1.5 Gypsum Board Business
5.1.6 Development Prospect
5.2 Pingyi Zhongxing Paper-faced Plasterboard
5.3 Jason
5.4 Baier Group
5.5 Dehua TB New Decoration Material
5.5.1 Profile
5.5.2 Operation
5.5.3 Revenue Structure
5.5.4 Gross Margin
5.5.5 Gypsum Board Business
5.6 Hangzhou King Coconut Holding Group
5.7 Hunan Xuefeng Building Material
6. Summary and Forecast
6.1 Summary
6.2 Forecast
Gypsum’s Grading and Application
Classification of Gypsum Products
Global Gypsum Output (by Region), 2011-2013
Global Gypsum Board Capacity, 2004-2014
Global Gypsum Board Capacity Distribution (by Region), 2013
Per Capita Consumption of Gypsum Board Worldwide, 2013
Gypsum Supply in the United States, 2009-2013
Gypsum Board Sales Volume in the United States, 2009-2013
Gypsum Board Sales Volume in the United States (by End Market), 2004-2013
Gypsum Board Capacity and Utilization Rate in the United States, 2006-2013
Major Gypsum Board Manufacturers in the United States
Market Share of Gypsum Board in the United States (by Manufacturer), 2013
Gypsum Board Output and Sales Volume in Japan, 2002-2014
Gypsum Board Sales Volume Percentage in Japan (by Region), 2004-2013
Gypsum Board Output Percentage in Japan (by Thickness), 2004-2013
Major Gypsum Board Manufacturers in Britain and Their Capacities, 2014
Distribution of Britain’s Gypsum Board Factories, 2014
Major Gypsum Board Manufacturers in Russia and Their Capacities, 2014
Distribution of Russia’s Gypsum Board Factories, 2014
Gypsum Output in India, Thailand and Vietnam, 2000-2012
Distribution and Capacities of Gypsum Board Factories in Indonesia, Vietnam, Thailand and Malaysia, 2014
Major Gypsum Board Manufacturers in Indonesia and Their Capacities, 2014
Major Gypsum Board Manufacturers in Malaysia and Their Capacities, 2014
Major Gypsum Board Manufacturers in Thailand and Their Capacities, 2014
Major Gypsum Board Manufacturers in Vietnam and Their Capacities, 2014
Used Gypsum Resource Reserves in China (by Region), 2013
Gypsum Consumption Structure in China, 2013
Gypsum Board Output in China, 2006-2014
Gypsum Board Output in China (by Region), 2012-2013
Market Share of Gypsum Board in China (by Manufacturer), 2013
Market Presence of Major Gypsum Board Manufacturers in China, 2013
Capacities of Three Major Foreign Gypsum Board Manufacturers in China, 2013
Gypsum Board Market Structure in China (by Product Grade), 2013
Real Estate Development Investment and Growth Rate in China, 2006-2014
Floor Space of Building Completed and Growth Rate in China, 2006-2014
Floor Space of Newly-started Building and Growth Rate in China, 2006-2014
Floor Space of Residence Completed and Growth Rate in China, 2006-2014
Floor Space of Newly-started Residence and Growth Rate in China, 2006-2014
Floor Space of Office Buildings Completed and Growth Rate in China, 2006-2014
Floor Space of Newly-started Office Buildings and Growth Rate in China, 2006-2014
Gypsum Board Consumer Demand Structure in China, 2013
Gypsum Board Demand in China, 2010-2013
Revenue and Net Income of Saint-Gobain, 2007-2014
Revenue Breakdown of Saint-Gobain (by Product), 2008-2013
Revenue Breakdown of Saint-Gobain (by Region), 2008-2013
Gross Margin of Saint-Gobain (by Product), 2008-2013
Overview of Saint-Gobain’s Gypsum Building Material Business
Main Financial Indices of Saint-Gobain’s Construction Products Sector, 2008-2013
Sales and Operating Income Percentage of Saint-Gobain’s Construction Products Sector, 2008-2013
Revenue of Saint-Gobain in China, 2002-2013
Revenue and Total Profit of Subsidiaries under Saint-Gobain Gypsum Building Material (China), 2007-2009
Revenue and Total Profit of Main Subsidiaries under Knauf China, 2007-2009
Revenue, Net Income and Gross Margin of Boral, FY2007-FY2013
Revenue Breakdown of Boral by Segment, 2009-2013
Revenue Breakdown of Boral by Region, 2009-2013
Revenue, Net Income and Gross Margin of Lafarge, 2008-2013
Revenue Breakdown of Lafarge (by Segment), 2008-2013
Revenue Breakdown of Lafarge (by Region), 2008-2013
Revenue and Net Income of Etex, 2009-2013
Revenue Breakdown of Etex (by Segment), 2009-2013
Revenue Structure of Etex (by Region), 2013
Revenue Breakdown of Etex (by Region), 2009-2013
Gypsum Building Material Subsidiaries Purchased by Etex, 2011
Revenue, Net Income and Gross Margin of USG, 2009-2013
Revenue Breakdown of USG (by Segment), 2008-2013
Revenue Breakdown of USG (by Region), 2008-2013
Gypsum Board Shipments and Average Price of USG, 2007-2013
Revenue and Operating Income of USG, 2009-2013
Revenue and Operating Income of CGC, 2009-2013
Revenue and Operating Income of USG Mexico, 2009-2013
Gypsum Mines & Gypsum Board Plants of NGC in the U.S.
Distribution of Yoshino Gypsum’s Factories
Yoshino Gypsum’s Gypsum Board Sales Volume, FY2009-FY2012
Gypsum Board Industrial Layout of BNBM
Revenue and Net Income of BNBM, 2007-2014
Revenue Breakdown of BNBM (by Product), 2009-2014
Revenue Breakdown of BNBM (by Region), 2009-2014
Gross Margin of BNBM (by Product), 2009-2014
Gypsum Board Capacity of BNBM, 2008-2015E
Gypsum Board Investment Projects Proposed and Under Construction of BNBM, 2014
Gypsum Board Sales Volume of BNBM (by Product), 2005-2013
Revenue and Net Income of BNBM, 2013-2016E
Revenue and Total Profit of Shandong Baier Building Materials, 2007-2009
Revenue and Net Income of DeHua TB New Decoration Material, 2009-2014
Revenue Breakdown of DeHua TB New Decoration Material (by Product), 2009-2014
Revenue Breakdown of DeHua TB New Decoration Material (by Region), 2009-2014
Gross Margin of DeHua TB New Decoration Material (by Product), 2009-2014
Global Gypsum Board Capacity, 2012-2016E
China’s Gypsum Board Output, 2012-2016E
Global and China Photoresist Industry Report, 2021-2026
Since its invention in 1959, photoresist has been the most crucial process material for the semiconductor industry. Photoresist was improved as a key material used in the manufacturing process of prin...
Global and China Needle Coke Industry Report, 2021-2026
Needle coke is an important carbon material, featuring a low thermal expansion coefficient, a low electrical resistivity, and strong thermal shock resistance and oxidation resistance. It is suitable f...
Global and China 3D Glass Industry Report, 2021-2026
3D curved glass is light and thin, transparent and clean, anti-fingerprint, anti-glare, hard and scratch-resistant, and performs well in weather resistance. It is applicable to terminals such as high-...
Global and China Graphene Industry Report, 2020-2026
Graphene, a kind of 2D carbon nanomaterial, features excellent properties such as mechanical property and super electrical conductivity and thermal conductivity. Its downstream application ranges from...
Global and China 3D Glass Industry Report, 2020-2026
Global 3D glass market has been enlarging over the recent years amid demetallization of smartphone back covers and popularity of smart wearables, to approximately $2.86 billion in 2019 and to an estim...
Global and China Photoresist Industry Report, 2020-2026
In 2019, global photoresist market was valued at $8.3 billion, growing at a compound annual rate of 5.1% or so since 2010, and it will outnumber $12.7 billion in 2026 with advances in electronic techn...
Global and China Synthetic Diamond Industry Report, 2020-2026
While its mechanical property is given full play in fields like grinding and cutting, diamond with acoustic, optical, magnetic, thermal and other special properties, as superconducting material, intel...
Global and China Needle Coke Industry Report, 2020-2026
With the merits like small resistivity, excellent resistance to impact and good anti-oxidation property, needle coke has been widely used in ultra-high power graphite electrodes, nuclear reactor decel...
Global and China Optical Fiber Preform Industry Report, 2019-2025
Optical fiber preform, playing an important role in the optical fiber and cable industry chain, seizes about 70% profits of optical fiber. Global demand for optical fiber preform stood at 16.2kt in 20...
China Silicon Carbide Industry Report, 2019-2025
Silicon carbide (SiC) is the most mature and the most widely used among third-generation wide band gap semiconductor materials. Over the past two years, global SiC market capacity, however, hovered ar...
Global and China Photoresist Industry Report, 2019-2025
Photoresist, a sort of material indispensable to PCB, flat panel display, optoelectronic devices, among others, keeps expanding in market size amid the robust demand from downstream sectors. In 2018, ...
Global and China Graphene Industry Report, 2019-2025
Graphene is featured with excellent performance and enjoys a rosy prospect. The global graphene market was worth more than $100 million in 2018, with an anticipated CAGR of virtually 45% between 2019 ...
Global and China 3D Glass Industry Chain Report, 2019-2025
The evolution of AMOLED conduces to the steady development of 3D curved glass market. In 2018, the global 3D glass market expanded 37.7% on an annualized basis and reached $1.9 billion, a figure proje...
China Wood Flooring Industry Report, 2019-2025
With the better standard of living and the people’s desire for an elegant life, wood flooring sees a rising share in the flooring industry of China, up from 33.9% in 2009 to 38.9% in 2018, just behind...
Global and China Photovoltaic Glass Industry Report, 2019-2025
In China, PV installed capacity has ramped up since the issuance of photovoltaic (PV) subsidy policies, reaching 53GW in 2017, or over 50% of global total. However, the domestic PV demand was hit by t...
Global and China ITO Targets Industry Chain Report, 2019-2025
Featured by good electrical conductivity and transparency, ITO targets are widely applied to fields of LCD, flat-panel display, plasma display, touch screen, electronic paper, OLED, solar cell, antist...
Global and China MO Source Industry Report, 2019-2025
MO source is a key raw material for metal-organic chemical vapor deposition (MOCVD) process. Global MO source output ranged at 102.6 tons in 2018, a rise of roughly 4.6% from a year earlier, a figure ...
Global and China Bi-Metal Band Saw Blade Industry Report, 2018-2023
Chinese manufacturing rebounded in the wake of a pick-up in infrastructure construction between 2016 and 2018, so did the bi-metal band saw blade as a key integral of metal processing industry. In 201...