Global and China Aluminum Profile Industry Report, 2014-2017
-
Dec.2014
- Hard Copy
- USD
$2,500
-
- Pages:145
- Single User License
(PDF Unprintable)
- USD
$2,300
-
- Code:
LMX060
- Enterprise-wide License
(PDF Printable & Editable)
- USD
$3,600
-
- Hard Copy + Single User License
- USD
$2,700
-
Since 2014, China aluminum profiles industry has been featured by the followings:
- China’s output and consumption of aluminum profiles kept growth but saw a slowdown in growth rate.
In 2014, China was still the world’s largest producer and consumer of aluminum profiles, accounting for 64.8%, 64.0% and 63.2% of global capacity, output and consumption, respectively. It is expected that output and consumption of aluminum profile in China will reach 18.43 million tons and 15 million tons in the year, up 13.98% and 7.45% from a year earlier, respectively, compared with year-on-year growth rate of 15.50% and 11.15% in 2013. A slowdown in industry growth was largely attributed to overall declining trend of aluminum prices and sluggish downstream demand since the financial crisis.
- Share of industrial aluminum profiles consumption in China increased year after year.
In 2013, China consumed 4.69 million tons of industrial aluminum profiles, only 33.6% of total aluminum profiles consumption in the country, while architectural aluminum profiles took up 66%. However, driven by light weight trend of communications and transportation, industrial aluminum profiles consumption has increased steadily, with its proportion to total consumption rising from 24.1% in 2001 to 33.6% in 2013.
- Major listed aluminum profiles companies performed differently in 2014.
China Zhongwang Holdings Limited, the world’s third largest, Asia's and China’s largest industrial aluminum profiles manufacturer focusing on light weight in communications and transportation field, ranked the first with revenue of RMB12.311 billion in the first three quarters of 2014, up 12.60% against the previous year.
Four of seven companies in the table underwent year-on-year decline in revenue, mainly due to a drop in domestic aluminum prices, increase in operating expenses owing to commissioning of some companies’ new projects, and depressed export demand. Besides China Zhongwang, Jiangsu Asia-Pacific Light Alloy Technology Co., Ltd. and Fujian Minfa Aluminium Co., Ltd. also saw year-on-year revenue growth, of which China Zhongwang and Jiangsu Asia-Pacific Light Alloy Technology primarily manufacture industrial aluminum profiles.
Revenue, YoY Changes and Aluminum Profiles Capacities of Major Listed Chinese Aluminum Profiles Companies, Q1-Q3 2014
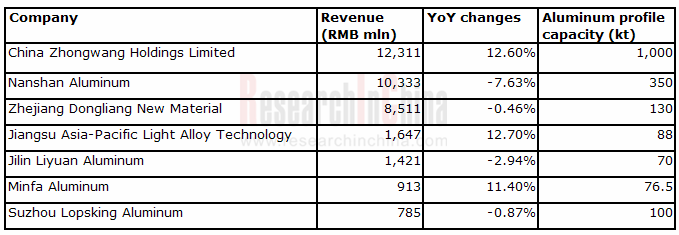
Source: Above Companies, ResearchInChina
Global and China Aluminum Profiles Industry Report, 2014-2017 focuses on the following:
 Development of China aluminum profiles industry, covering policy climate, global capacity and output, China’s capacity and output, consumption and structure, regional competition pattern and enterprises’ competitive landscape, import and export.
Market segments of China aluminum profiles industry, including architectural aluminum profiles consumption and main areas of consumption, industrial aluminum profiles consumption, consumption structure, main areas of consumption and projects under construction of major listed companies;
7 major global aluminum profiles companies, containing operation, aluminum profiles business, layout in China and development planning;
9 major listed Chinese aluminum profiles companies and 12 unlisted ones, including operation, revenue structure, aluminum profiles output and sales volume, development planning;
Summary of the Chinese aluminum profiles market in 2014 and forecast for its development over the next three years.
Preface
1. Overview of Aluminum Profiles Industry
1.1 Aluminum Resources
1.2 Aluminum Profiles
1.2.1 Definition
1.2.2 Classification
1.2.3 Industry Chain
2. Development of Chinese Aluminum Profiles Industry
2.1 Industry Policy
2.2 Capacity and Output
2.3 Consumption
2.3.1 Volume
2.3.2 Structure
2.4 Competition
2.4.1 Regional Competition
2.4.2 Competition among Manufacturers
2.5 Import and Export
2.5.1 Export
2.5.2 Import
3. Market Segments of China Aluminum Profiles Industry
3.1 Architectural Aluminum Profile
3.1.1 Consumption
3.1.2 Aluminum Profiles for Doors and Windows
3.1.3 Aluminum Profiles for Building Templates
3.2 Industrial Aluminum Profile
3.1.2 Consumption
3.1.2 Consumption Structure
3.1.3 Automotive Aluminum Profile
3.1.4 Aluminum Profile for Train and Urban Rail Transit
3.1.5 Aluminum Profile for PV
3.1.6 Aluminum Profile for LED
3.1.7 Aluminum Profile for Consumer Electronics
3.1.8 Projects
4. Key Companies Worldwide
4.1 Sapa AS
4.1.1 Profile
4.1.2 Development Course
4.1.3 Aluminum Profiles
4.1.4 Operation
4.1.5 Development in China
4.1.6 SapaChalco Aluminum Products
4.2 Alcoa
4.2.1 Profile
4.2.2 Aluminum Profiles
4.2.3 Operation
4.2.4 Development in China
4.3 Midas Holding Limited
4.3.1 Profile
4.3.2 Operation
4.3.3 Aluminum Profiles
4.3.4 Key Projects
4.3.5 Aluminum Profiles Orders
4.4 Aleris International Inc.
4.4.1 Profile
4.4.2 Aluminum Profiles
4.4.3 Operation
4.4.4 Revenue Structure
4.4.5 Dynamics
4.4.6 Development in China
4.5 YKK AP
4.5.1 Profile
4.5.2 Operation
4.5.3 Development in China
4.6 Press Metal
4.6.1 Profile
4.6.2 Development Course
4.6.3 Development in China
4.7 Nippon Light Metal
4.7.1 Profile
4.7.2 Development Course
4.7.3 Dynamics
4.7.4 Aluminum Profiles Business in China
5. Key Listed Companies in China
5.1 China Zhongwang
5.1.1 Profile
5.1.2 Development Course
5.1.3 Output and Sales Volume
5.1.4 Operation
5.1.5 Revenue Structure
5.1.6 Gross Margin
5.1.7 Projects
5.1.8 Strategy
5.1.9 Performance Forecast
5.2 Shandong Nanshan Aluminum
5.2.1 Profile
5.2.2 Output and Sales Volume
5.2.3 Operation
5.2.4 Revenue Structure
5.2.5 Gross Margin
5.2.6 Projects
5.2.7 Clients
5.2.8 Competitive Advantages
5.2.9 Performance Forecast
5.3 Asia-Pacific Light Alloy Technology
5.3.1 Profile
5.3.2 Output and Sales Volume
5.3.3 Operation
5.3.4 Revenue Structure
5.3.5 Gross Margin
5.3.6 Projects
5.3.7 Extention in Downstream Sectors
5.3.8 Performance Forecast
5.4 Jilin Liyuan Aluminum
5.4.1 Profile
5.4.2 Output and Sales Volume
5.4.3 Operation
5.4.4 Revenue Structure
5.4.5 Gross Margin
5.4.6 Projects
5.4.7 Competitive Advantages
5.4.8 Performance Forecast
5.5 Zhejiang Dongliang New Material
5.5.1 Profile
5.5.2 Output and Sales Volume
5.5.3 Operation
5.5.4 Revenue Structure
5.5.5 Gross Margin
5.5.6 Performance Forecast
5.6 Suzhou Lopsking Aluminum
5.6.1 Profile
5.6.2 Output and Sales Volume
5.6.3 Operation
5.6.4 Revenue Structure
5.6.5 Gross Margin
5.6.6 Projects
5.6.7 Performance Forecast
5.7 Guangdong XingfaAluminium
5.7.1 Profile
5.7.2 Output and Sales Volume
5.7.3 Operation
5.7.4 Revenue Structure
5.7.5 Gross Margin
5.7.6 Performance Forecast
5.8 Fujian Minfa Aluminium
5.8.1 Profile
5.8.2 Output and Sales Volume
5.8.3 Operation
5.8.4 Revenue Structure
5.8.5 Gross Margin
5.8.6 Projects
5.8.7 Performance Forecast
6. Non-Listed Companies in China
6.1 GuangDong HaoMei Aluminium
6.2 Guangdong Fenglu Aluminium
6.2.1 Profile
6.2.2 Dynamics
6.3 Fujian NanpingAluminium
6.3.1 Profile
6.3.2 Development Course
6.3.3 Dynamics
6.4 GuangyaAluminium
6.5 Guangdong JMA Aluminium Profile Factory (Group) Co., Ltd.
6.6 Guangdong Huachang Aluminum Factory
6.6.1 Profile
6.6.2 Development Course
6.7 Shandong Conglin Aluminum
6.8 Guangdong Weiye Aluminum Factory
6.9 Changsha Zhensheng Group
6.10 Qinghai Guoxin Aluminum Industry
6.11 TaishanKamkiuAluminiumExtrusion
6.12 AsiaAlum Group
7 Market Review and Development Forecast
7.1 Market Review
7.2 Development Forecast
7.2.1 Development Trend
7.2.2 Forecast of Output and Consumption
Aluminum Applications
Aluminum Consumption Structure Worldwide
Available Bauxite Reserves Worldwide
Classification of Aluminum Materials
Aluminum Profile Processing Flow
Applications of Aluminum Profiles
Industrial Chain of Aluminum Profile
Laws and Regulations on Aluminum Profile Industry in China, 2007-2013
Policies on Aluminum Profile Industry in China, 2006-2014
Capacity and Output of Aluminum Profiles in China and Worldwide, 2010-2014
Aluminum Profile Output and YoY Change in China, 2001-2014
Consumption of Aluminum Profiles in China and Worldwide, 2010-2012
Aluminum Profile Consumption and YoY Change in China, 2001-2014
Consumption Structure of Aluminum Profiles in China and North America in 2013
Contrasts between Architectural Aluminum Profile and Industrial Aluminum Profile
Consumption Structure of Aluminum Profiles in China, 2001-2014E
Distribution of Aluminum Profile Manufacturers in China
Comparison among Aluminum Profile Manufacturers in China (by Revenue and Production Advantages)
Major Listed Aluminum Profile Companies’ Revenue and YoY Change in China, Q1-Q3, 2014
Aluminum Profile Capacities of Major Chinese Listed Companies
Gross Margin Comparison among Alumina Profile Manufacturers (by Product), H1 2014
Export Volume and YoY Change of Aluminum Profile in China, 2008-2014
Export Value and YoY Change of Aluminum Profile in China, 2008-2014
Import Volume and YoY Change of Aluminum Profile in China, 2008-2014
Import Value and YoY Change of Aluminum Profile in China, 2008-2014
Consumption of Architectural Aluminum Profile in China, 2001-2014
Consumption of Industrial Aluminum Profile in China, 2001-2014
Consumption Structure of Industrial Aluminum Profile (by Applications) in China, Europe, North America, and Japan in 2013
Energy Saving Policies in Different Countries to Promote Aluminium Application in Automobile Industry
Quarterly Shipment of Apple Series Products, 2010-2014
Industrial Aluminum Profile Projects under Construction in China
Equity Structure of Sapa
Introduction to Sapa
Development Course of Sapa
Sapa’s Business Distribution
Sapa Operations in Brief
Production Process of Sapa
Selected Operating Indicators of Sapa
Introduction of Sapa Profiles China
Revenue Structure of Alcoa in 2013
Main Operating Indicators of Alcoa, 2013-2014
Main Operating Indicators of Engineered Products and Solutions Division of Alcoa, 2013-2014
Operating Indicators of Alcoa in China in 2013
Structure of Midas Holdings Ltd
Main Operating Indicators of Midas, 2009-2014
Total Revenue and Revenue from Aluminum Alloy Extruded Products of Midas, 2010-2014
Revenue Structure of Aluminium Alloy Extruded Products of Midas (by Applications), 2008-2014
Gross Margin of Aluminium Alloy Extruded Products of Midas, 2006-2014
Major Customers and Competitors of Extrusions Division of Aleris
Extrusions Business Distribution of Aleris
Revenue and Net Income of Aleris, 2007-2014
Revenue Structure of Aleris (by Business) in 2013
Revenue Structure of Aleris (by End-use) in 2013
Revenue Structure of Aleris (by Business) in 2014
Sales Volume of Aleris, 2013-2014
Introduction of YKK
Business Distribution of YKK Worldwide
Business Scope of YKK
Introduction to Architectural Products Division of YKK
Revenue and Operating Income of YKK, FY2011-FY2014
Revenue and Operating Income of YKK (by Business), FY2011-FY2014
Revenue Structure of YKK (by Regions), FY2014
Introduction of YKK in China
Development Course of YKK in China
Development Course of Building Materials Business of YKK in China
Business Distribution of Press Metal Worldwide
Main Operating Indicators of Press Metal
Development Course of Press Metal
Introduction of Nippon Light Metal
Production Bases of Nippon Light Metal in Japan
Development Course of Nippon Light Metal
Overview of Nippon Light Metal’s Electrolytic Aluminum Smelting Business
Aluminum Profile Business of Nippon Light Metal in China
Development Course of Nonfemet International (China-Canada-Japan) Aluminium Co., Ltd
Development Course of China Zhongwang
Aluminum Profile Capacity of China Zhongwang, 1996-2013
Business Distribution of China Zhongwang
Sales Volume of China Zhongwang (by Products), 2006-2014
Average Price of Products of China Zhongwang, 2012-2014
Revenue and Gross Profit of China Zhongwang, 2008-2014
Revenue Structure of China Zhongwang (by Business), 2008-2014
Revenue Structure of China Zhongwang (by Regions), 2009-2014
Gross Margin of China Zhongwang (by Products), 2006-2014
Revenue and Gross Profit of China Zhongwang, 2014E-2017E
Introduction of Aluminum Extrusion and Surface Treatment Equipment of Shandong Nanshan Aluminum
Revenue and Net Income of Shandong Nanshan Aluminum, 2009-2014
Revenue Structure of Shandong Nanshan Aluminum (by Products), 2011-2014
Revenue Structure of Shandong Nanshan Aluminum (by Regions), 2009-2014
Gross Margin of Aluminium and Aluminum Profiles of Shandong Nanshan Aluminum, 2007-2014
Projects of Nanshan Aluminum(as of June 2014)
Shandong Nanshan Aluminum’s Revenue from Top 5 Clients and % of Total Revenue, 2014H1
Production Capacity of Shandong Nanshan Aluminum
Revenue and Net Income of Shandong Nanshan Aluminum, 2014E-2017E
Capacity and Output of Asia-Pacific Light Alloy Technology, 2009-2013
Output, Sales Volume and Inventory of Asia-Pacific Light Alloy Technology, 2011-2014
Product Applications of Asia-Pacific Light Alloy Technology
Revenue and Net Income of Asia-Pacific Light Alloy Technology, 2007-2014
Revenue Structure of Asia-Pacific Light Alloy Technology (by Products), 2009-2014
Major Customers of Asia-Pacific Light Alloy Technology
Revenue Structure of Asia-Pacific Light Alloy Technology (by Regions), 2007-2014
Gross Margin of Asia-Pacific Light Alloy Technology, 2009-2014
Main Projects of Asia-Pacific Light Alloy Technology
Revenue and Net Income of Asia-Pacific Light Alloy Technology, 2014E-2017E
Output, Sales Volume and Inventory of Jilin Liyuan Aluminum, 2011-2012
Revenue and Net Income of Jilin Liyuan Aluminum, 2007-2014
Revenue Structure of Jilin Liyuan Aluminum (by Products), 2007-2014
Revenue Structure of Jilin Liyuan Aluminum (by Regions), 2010-2014
Gross Margin of Jilin Liyuan Aluminum (by Products), 2010-2014
Projects of Liyuan Aluminum
Construction Projects with Additional Stock Issuance of Jilin Liyuan Aluminum
Sales Volume and Treatment Charge of Jilin Liyuan Aluminum, 2014E-2015E
Revenue and Net Income of Jilin Liyuan Aluminum, 2014E-2017E
Output, Sales Volume and Inventory of Zhejiang Dongliang New Material, 2011-2013
Revenue and Net Income of Zhejiang Dongliang New Material, 2006-2014
Revenue Structure of Zhejiang Dongliang New Material by Products, 2008-2014
Gross Margin of Zhejiang Dongliang New Material by Products, 2009-2014
Revenue and Net Income of Zhejiang Dongliang New Material, 2014E-2017E
Output, Sales Volume and Inventory of Lopsking Aluminum, 2011-2013
Revenue and Net Income of Lopsking Aluminum, 2006-2014
Revenue Structure of Lopsking Aluminum (by Products), 2010-2014
Domestic Revenue Structure of Lopsking Aluminum (by Regions), 2010-2013
Revenue Structure of Lopsking Aluminum (by Regions), 2010-2014
Gross Margin of Lopsking Aluminum (by Products), 2009-2014
Projects of Lopsking Aluminum
Revenue and Net Income of Lopsking Aluminum, 2014E-2017E
Sales Volume of XingfaAluminium, 2007-2014
Average Selling Price of Products of Guangdong XingfaAluminium, 2011-2013
Revenue and Net Income of Guangdong XingfaAluminium, 2005-2014
Revenue Structure of Guangdong XingfaAluminium (by Products), 2009-2014
Revenue Breakdown of Guangdong XingfaAluminium (by Regions), 2012-2013
Gross Margin of Guangdong XingfaAluminium (by Products), 2006-2014
Revenue and Net Income of Guangdong XingfaAluminium, 2014E-2017E
Capacity of Fujian MinfaAluminium, 2011-2014
Output, Sales Volume and Inventory of Fujian MinfaAluminium, 2011-2013
Revenue and Net Income of Fujian MinfaAluminium, 2008-2014
Revenue Breakdown of Fujian MinfaAluminium (by Products), 2011-2014
Revenue structure of Fujian MinfaAluminium (by Regions), 2010-2014
Gross Margin of Fujian MinfaAluminium (by Products), 2012-2014
Revenue and Net Income of Fujian MinfaAluminium, 2014E-2017E
Production Process of GuangDongHaoMeiAluminium
Global Marketing Network of Guangdong HaoMeiAluminium
Development Course of Fujian NanpingAluminium
Aluminum Profile Production Bases of Jianmei
Sales Networking of Guangdong JianmeiAluminium Profile Factory
Branch Companies and Capacities of Guangdong Huachang Aluminum Factory
Development Course of Guangdong Huachang Aluminum Factory
Production Lines of Guangdong Weiye Aluminum Factory
Main Operating Data in Aluminum Profile Industry, 2013-2014
Urbanization Rates in China, 1949-2013
Urbanization Rates Contrast in the World
Demand Increase in Chinese Industrial Aluminum Profile Industry in 2014
Aluminum Profile Output in China, 2015E-2017E
Aluminum Profile Consumption in China, 2015E-2017E
Consumption Structure of Aluminum Profile in China, 2014E-2017E
Global and China Photoresist Industry Report, 2021-2026
Since its invention in 1959, photoresist has been the most crucial process material for the semiconductor industry. Photoresist was improved as a key material used in the manufacturing process of prin...
Global and China Needle Coke Industry Report, 2021-2026
Needle coke is an important carbon material, featuring a low thermal expansion coefficient, a low electrical resistivity, and strong thermal shock resistance and oxidation resistance. It is suitable f...
Global and China 3D Glass Industry Report, 2021-2026
3D curved glass is light and thin, transparent and clean, anti-fingerprint, anti-glare, hard and scratch-resistant, and performs well in weather resistance. It is applicable to terminals such as high-...
Global and China Graphene Industry Report, 2020-2026
Graphene, a kind of 2D carbon nanomaterial, features excellent properties such as mechanical property and super electrical conductivity and thermal conductivity. Its downstream application ranges from...
Global and China 3D Glass Industry Report, 2020-2026
Global 3D glass market has been enlarging over the recent years amid demetallization of smartphone back covers and popularity of smart wearables, to approximately $2.86 billion in 2019 and to an estim...
Global and China Photoresist Industry Report, 2020-2026
In 2019, global photoresist market was valued at $8.3 billion, growing at a compound annual rate of 5.1% or so since 2010, and it will outnumber $12.7 billion in 2026 with advances in electronic techn...
Global and China Synthetic Diamond Industry Report, 2020-2026
While its mechanical property is given full play in fields like grinding and cutting, diamond with acoustic, optical, magnetic, thermal and other special properties, as superconducting material, intel...
Global and China Needle Coke Industry Report, 2020-2026
With the merits like small resistivity, excellent resistance to impact and good anti-oxidation property, needle coke has been widely used in ultra-high power graphite electrodes, nuclear reactor decel...
Global and China Optical Fiber Preform Industry Report, 2019-2025
Optical fiber preform, playing an important role in the optical fiber and cable industry chain, seizes about 70% profits of optical fiber. Global demand for optical fiber preform stood at 16.2kt in 20...
China Silicon Carbide Industry Report, 2019-2025
Silicon carbide (SiC) is the most mature and the most widely used among third-generation wide band gap semiconductor materials. Over the past two years, global SiC market capacity, however, hovered ar...
Global and China Photoresist Industry Report, 2019-2025
Photoresist, a sort of material indispensable to PCB, flat panel display, optoelectronic devices, among others, keeps expanding in market size amid the robust demand from downstream sectors. In 2018, ...
Global and China Graphene Industry Report, 2019-2025
Graphene is featured with excellent performance and enjoys a rosy prospect. The global graphene market was worth more than $100 million in 2018, with an anticipated CAGR of virtually 45% between 2019 ...
Global and China 3D Glass Industry Chain Report, 2019-2025
The evolution of AMOLED conduces to the steady development of 3D curved glass market. In 2018, the global 3D glass market expanded 37.7% on an annualized basis and reached $1.9 billion, a figure proje...
China Wood Flooring Industry Report, 2019-2025
With the better standard of living and the people’s desire for an elegant life, wood flooring sees a rising share in the flooring industry of China, up from 33.9% in 2009 to 38.9% in 2018, just behind...
Global and China Photovoltaic Glass Industry Report, 2019-2025
In China, PV installed capacity has ramped up since the issuance of photovoltaic (PV) subsidy policies, reaching 53GW in 2017, or over 50% of global total. However, the domestic PV demand was hit by t...
Global and China ITO Targets Industry Chain Report, 2019-2025
Featured by good electrical conductivity and transparency, ITO targets are widely applied to fields of LCD, flat-panel display, plasma display, touch screen, electronic paper, OLED, solar cell, antist...
Global and China MO Source Industry Report, 2019-2025
MO source is a key raw material for metal-organic chemical vapor deposition (MOCVD) process. Global MO source output ranged at 102.6 tons in 2018, a rise of roughly 4.6% from a year earlier, a figure ...
Global and China Bi-Metal Band Saw Blade Industry Report, 2018-2023
Chinese manufacturing rebounded in the wake of a pick-up in infrastructure construction between 2016 and 2018, so did the bi-metal band saw blade as a key integral of metal processing industry. In 201...