Global and China Lithium Battery Anode Materials Industry Report, 2014-2017
-
Feb.2015
- Hard Copy
- USD
$2,450
-
- Pages:102
- Single User License
(PDF Unprintable)
- USD
$2,300
-
- Code:
HK055
- Enterprise-wide License
(PDF Printable & Editable)
- USD
$3,600
-
- Hard Copy + Single User License
- USD
$2,650
-
Lithium battery is composed mainly of cathode materials, anode materials, separator, and electrolyte, of which anode materials make up 5%-15% of lithium-ion battery costs, being one of important raw materials for lithium battery. Global lithium battery anode materials are now still dominated by natural graphite and artificial graphite, together accounting for roughly 85% in 2014. However, novel materials like mesocarbon microbeads (MCMB), lithium titanate (or lithium titanium oxide, LTO), and other anode materials see rapid growth in output.
In 2014, global lithium battery anode materials output totaled around 70,000 tons, concentrated in China and Japan, which together constituted over 95% of global anode materials sales volume. Rapid growth in global new energy vehicle market and accelerated application of lithium battery in communications and energy storage fields in the wake of the advent of 4G era will drive global demand for anode materials grow at a rate of more than 15% over the next three years.
Global anode materials industry is highly concentrated, with major manufacturers including Hitachi Chemical, JFE Chemical, Mitsubishi Chemical, BTR, and Ningbo Shanshan, which held a combined market share of over 80% in 2014, with Hitachi Chemical and Ningbo Shanshan specializing in artificial graphite anode materials, BTR and Mitsubishi Chemical in natural graphite anode materials, and JFE Chemical and Ningbo Shanshan in MCMB anode materials.
China abounds in graphite mineral resources, endowing the country with significant advantage in production costs of anode materials, and occupied 70% or so of global anode materials output in 2014. As anode materials production technologies of the Chinese companies become increasingly mature, home-made anode materials will gain more market shares.
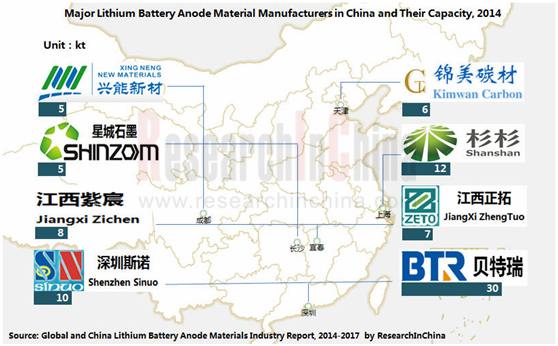
As of the end of 2014, there were more than 50 producers of lithium battery anode materials in China, and most of them entered the field after 2010. In 2014, the top five lithium battery anode materials producers (by capacity) were BTR, Ningbo Shanshan, Shenzhen Sinuo Industrial Development, Jiangxi Zichen Technology, and Jiangxi Zhengtuo New Energy Technology, with their capacities totaling 67,000 tons, and BTR and Ningbo Shanshan taking approximately 60% of the Chinese market.
In recent years, due to falling cell price and fiercer competition in anode materials market in China, the prices and profits of anode materials in China continued to slide, and the trend is expected to last for the next three years. This will have small- and medium- sized enterprises lacking funds and technological innovation capabilities caught in deep waters, and even taken over or eliminated for some companies.
Global and China Lithium Battery Anode Materials Industry Report, 2014-2017 by ResearchInChina focuses on the following:
 Market size and competitive landscape of global lithium battery anode materials industry;
Market size, competitive landscape, price trend and development forecast of China lithium battery anode materials industry;
Supply & demand, competitive landscape, supporting relationship between upstream and downstream, development forecast of global and China lithium battery industry;
Operation, anode materials business, and development forecast of 15 global and Chinese anode materials producers.
1. Overview of Lithium Battery Anode Materials
1.1 Definition
1.2 Industrial Chain
1.3 Industrial Policy
2. Lithium Battery Anode Materials Market
2.1 Global
2.1.1 Market Size
2.1.2 Competitive Landscape
2.2 China
2.2.1 Market Size
2.2.2 Competitive Landscape
2.2.3 Price Trend
2.3 Supply Relationship
2.4 Other Anode Materials
2.4.1 Lithium Titanate
2.4.2 Hard Carbon
2.4.3 Si/C Composites
3. Lithium Batter Industry
3.1 Global Demand for Lithium Battery
3.1.1 Demand for Common 3C Lithium Battery
3.1.2 Demand for Power Lithium Battery
3.1.3 Lithium Battery Shipments
3.1.4 Lithium Battery Market Size
3.2 China’s Demand for Lithium Battery
3.2.1 Demand for Common 3C Lithium Battery
3.2.2 Demand for Power Lithium Battery
3.2.3 Lithium Battery Shipments
3.2.4 Lithium Battery Market Size
3.3 Competitive Landscape
3.3.1 Market Share
3.3.2 Power Battery Manufacturers
3.3.3 Supporting Relationship
4. Major Global Companies
4.1 Hitachi Chemical Co., Ltd.
4.1.1 Profile
4.1.2 Operation
4.1.3 Anode Materials Business
4.1.4 Business in China
4.2 JFE Chemical
4.3 Mitsubishi Chemical Holdings
4.3.1 Profile
4.3.2 Operation
4.3.3 Anode Materials Business
4.4 KUREHA
4.4.1 Profile
4.4.2 Operation
4.4.3 Operation of Advanced Materials Segment
4.4.4 Anode Materials Business
5. Major Chinese Companies
5.1 China Baoan Group Co., Ltd.
5.1.1 Profile
5.1.2 Operation
5.1.3 Revenue Structure
5.1.4 Gross Margin
5.1.5 R&D
5.1.6 Customers and Suppliers
5.1.7 Anode Materials Business
5.1.8 Forecast and Outlook
5.2 Ningbo Shanshan Co., Ltd.
5.2.1 Profile
5.2.2 Operation
5.2.3 Revenue Structure
5.2.4 Gross Margin
5.2.5 R&D
5.2.6 Anode Materials Business
5.2.7 Forecast and Outlook
5.3 Beijing Easpring Material Technology Co., Ltd.
5.3.1 Profile
5.3.2 Operation
5.3.3 Hunan Shinzoom Graphite Technology Co., Ltd.
5.4 China-Kinwa High Technology Co., Ltd.
5.4.1 Profile
5.4.2 Operation
5.4.3 Revenue Structure
5.4.4 Gross Margin
5.4.5 R&D
5.4.6 Huzhou Chuangya Power Battery Materials Co., Ltd.
5.5 Jiangxi Zhengtuo New Energy Technology Co., Ltd.
5.5.1 Profile
5.5.2 Operation
5.5.3 Revenue Structure
5.5.4 Gross Margin
5.5.5 R&D
5.5.6 Customers and Suppliers
5.5.7 Selling Price
5.6 Other Companies
5.6.1 Jiangxi Zichen Technology Co., Ltd.
5.6.2 Shenzhen Sinuo Industrial Development Co., Ltd.
5.6.3 Morgan AM&T Hairong Co., Ltd.
5.6.4 Chengdu Xingneng New Materials Co., Ltd.
5.6.5 Tianjin Kimwan Carbon Technology and Development Co., Ltd.
5.6.6 Dalian Hongguang Lithium Industry Co., Ltd.
6. Summary and Forecast
6.1 Summary
6.2 Development Forecast
Cost Structure of Lithium Battery
Classification of Lithium Battery Anode Materials
Value Chain of Power Lithium Battery
Production Procedures of Power Lithium Battery
Policies on Lithium Battery Industry in China
Global Anode Materials Output Structure, 2013
Major Global Suppliers and Buyers of Anode Materials by Product
Market Shares of Global Anode Materials Producers, 2013
Sales Volume and Growth Rate of Lithium Battery Anode Materials in China, 2010-2014
Major Lithium Battery Anode Materials Companies and Their Capacities, 2014
Shipments and Revenue of Lithium Battery Anode Materials Companies in China, 2013
Customers of Major Lithium Battery Anode Materials Companies in China, 2014
Average Selling Prices of Anode Materials in China, 2010-2014
Critical Materials Supply System of Global Power Battery Manufacturers, 2013
Critical Materials Supply System of Power Battery Manufacturers in China, 2013
Comparison of Several Anode Materials’ Technical Characteristics
Applications of Lithium-ion Battery
Global Notebook, Tablet PC, and Mobile Phone Shipments, 2012-2016E
Global Notebook, Tablet PC, and Mobile Phone Lithium Battery Shipments, 2012-2016E
Global Electric Vehicles Sales Volume, 2008-2016E
Battery Capacity of Global Major Electric Vehicles and Endurance
Battery Capacity of Single Electric Vehicle Globally, 2008-2016E
Global Demand for Power Battery from Electric Vehicles, 2008-2016E
Battery Pack Costs of Global Major Electric Vehicles, 2014
Global Power Lithium Battery Pack Price, 2008-2016E
Global Lithium Battery Shipments, 2008-2016E
Global Lithium Battery Shipments, 2008-2016E
Global Lithium Battery Demand Structure, 2012-2016E
Global Lithium Battery Shipments by Field, 2008-2016E
Global Lithium Battery Industry Scale, 2008-2016E
China’s Notebook, Tablet PC, and Mobile Phone Shipments, 2012-2016E
China’s Electric Vehicle Sales Volume, 2008-2016E
China’s Share of Global Electric Vehicles Sales Volume, 2008-2016E
China’s Demand for Automotive Batteries, 2011-2016E
Power Lithium Battery Pack Price in China, 2008-2016E
China’s Lithium Battery Shipments, 2008-2016E
China’s Share of Global Lithium Battery Shipments, 2008-2016E
China’s Lithium Battery Industry Scale, 2008-2016E
China’s Share of Global Lithium Battery Industry Scale, 2008-2016E
Power Lithium Battery Industry Scale and Percentage in China, 2010-2016E
Shares of Lithium Battery Shipments in China, Japan, and China, 2012-2013
Market Shares of Global Small Lithium Battery Companies, 2013
Market Shares of Global Power Lithium Battery Companies, 2013
Global Joint-venture Suppliers of Power Lithium Battery
Battery Technologies and Sales of Power Lithium Battery Companies in China, 2013
Power Lithium Battery Companies in Europe and America and Supported Models
Power Lithium Battery Companies in South Korea and Supported Models
Power Lithium Battery Companies in Japan and Supported Models
Power Lithium Battery Companies in China and Supported Models
Net Revenue and Net Income of Hitachi Chemical, FY2010-FY2014
Net Revenue Structure of Hitachi Chemical by Segment, FY2012-FY2014
Net Revenue Structure of Hitachi Chemical by Region, FY2011-FY2013
Main Business Segments and Businesses of Hitachi Chemical,
Net Revenue and Net Income of Hitachi Chemical’s Functional Materials Segment, FY2010-FY2014
Net Revenue Structure of Hitachi Chemical’s Functional Materials Segment by Product, FY2014H1
Net Revenue and Net Income of Mitsubishi Chemical Holdings, FY2010-FY2014
Fields of Operation and Operating Revenue Structure of Mitsubishi Chemical Holdings, FY2014H1
Net Revenue and Net Income of KUREHA, FY2010-FY2014
Revenue Structure of Kureha by Business, FY2012-FY2014
Revenue and Operating Profit of Kureha’s Advanced Materials Segment, FY2010-FY2014
Revenue from Main Products of Kureha’s Advanced Materials Segment, FY2011-FY2013
Revenue and Net Income of China Baoan Group, 2010-2014
Revenue Breakdown of China Baoan Group by Product, 2012-2014
Revenue Structure of China Baoan Group by Product, 2012-2014
Revenue Breakdown of China Baoan Group by Region, 2012-2014
Revenue Structure of China Baoan Group by Region, 2012-2014
Gross Margins of Main Products of China Baoan Group, 2012-2014
R&D Costs and % of Total Revenue of China Baoan Group, 2011-2013
China Baoan Group’s Revenue from Top5 Customers and % of Total Revenue, 2011-2013
Name List and Revenue Contribution of China Baoan Group’s Top 5 Customers, 2013
China Baoan Group’s Procurement from Top5 Suppliers and % of Total Procurement, 2011-2013
Name List and Procurement of China Baoan Group’s Top 5 Suppliers, 2013
Revenue and Net Income of BTR, 2012-2014
Subsidiaries of BTR, as of Jun. 30, 2014
BTR’s Progress of Research into Lithium Battery Materials, 2013-2014
Revenue and Net Income of China Baoan Group, 2013-2017E
Revenue and Net Income of Ningbo Shanshan, 2010-2014
Revenue Breakdown of Ningbo Shanshan by Product, 2012-2014
Revenue Structure of Ningbo Shanshan by Product, 2012-2014
Revenue Breakdown of Ningbo Shanshan by Region, 2012-2014
Revenue Structure of Ningbo Shanshan by Region, 2012-2014
Gross Margins of Main Products of Ningbo Shanshan, 2012-2014
R&D Costs and % of Total Revenue of Ningbo Shanshan, 2011-2013
Anode Materials Series of Ningbo Shanshan
Revenue and Net Income of Ningbo Shanshan’s Anode Materials Business, 2012-2014
Revenue and Net Income of Shanghai Shanshan, 2012-2014
Development of Lithium Battery Anode Materials of Ningbo Shanshan
Revenue and Net Income of Ningbo Shanshan, 2013-2017E
Revenue and Net Income of Hunan Shinzoom Graphite Technology, 2012-2014
Revenue Breakdown of Hunan Shinzoom Graphite Technology by Product, 2012-2013
Revenue Structure of Hunan Shinzoom Graphite Technology by Product, 2012-2013
Gross Margin of Main Products of Hunan Shinzoom Graphite Technology, 2012-2013
R&D Costs and % of Total Revenue of Hunan Shinzoom Graphite Technology, 2012-2013
Hunan Shinzoom Graphite Technology’s Revenue from Top5 Customers and % of Total Revenue, 2012-2013
Hunan Shinzoom Graphite Technology’s Procurement from Top5 Suppliers and % of Total Procurement, 2012-2013
Sales Volume of Main Products of Hunan Shinzoom Graphite Technology, 2012-2013
Selling Prices of Main Products of Hunan Shinzoom Graphite Technology, 2012-2013
Revenue and Net Income of China-Kinwa High Technology, 2010-2014
Revenue Breakdown of China-Kinwa High Technology by Product, 2012-2014
Revenue Structure of China-Kinwa High Technology by Product, 2012-2014
Revenue Breakdown of China-Kinwa High Technology by Region, 2012-2014
Revenue Structure of China-Kinwa High Technology by Region, 2012-2014
Gross Margins of Main Products of China-Kinwa High Technology, 2012-2014
R&D Costs and % of Total Revenue of China-Kinwa High Technology, 2011-2013
Revenue and Net Income of Huzhou Chuangya Power Battery Materials, 2012-2014
Revenue and Net Income of Jiangxi Zhengtuo New Energy Technology, 2012-2014
Revenue Breakdown of Jiangxi Zhengtuo New Energy Technology by Product, 2012-2014
Revenue Structure of Jiangxi Zhengtuo New Energy Technology by Product, 2012-2014
Revenue Breakdown of Jiangxi Zhengtuo New Energy Technology by Region, 2012-2014
Revenue Structure of Jiangxi Zhengtuo New Energy Technology by Region, 2012-2014
Gross Margins of Main Products of Jiangxi Zhengtuo New Energy Technology, 2012-2014
R&D Costs and % of Total Revenue of Jiangxi Zhengtuo New Energy Technology, 2012-2014
Jiangxi Zhengtuo New Energy Technology’s Revenue from Top5 Customers and % of Total Revenue, 2012-2014
Name List and Revenue Contribution of Jiangxi Zhengtuo New Energy Technology’s Top 5 Customers, 2014H1
Jiangxi Zhengtuo New Energy Technology’s Procurement from Top 5 Suppliers and % of Total Procurement, 2012-2014
Name List and Procurement of Jiangxi Zhengtuo New Energy Technology’s Top 5 Suppliers, 2014H1
Selling Prices of Main Products of Jiangxi Zhengtuo New Energy Technology, 2012-2014
Anode Materials Revenue of Major Global and Chinese Companies, 2013-2014
Sales Volume and Growth Rate of Lithium Battery Anode Materials in China, 2013-2017E
Average Selling Prices of Anode Materials in China, 2013-2017E
Global and China Photoresist Industry Report, 2021-2026
Since its invention in 1959, photoresist has been the most crucial process material for the semiconductor industry. Photoresist was improved as a key material used in the manufacturing process of prin...
Global and China Needle Coke Industry Report, 2021-2026
Needle coke is an important carbon material, featuring a low thermal expansion coefficient, a low electrical resistivity, and strong thermal shock resistance and oxidation resistance. It is suitable f...
Global and China 3D Glass Industry Report, 2021-2026
3D curved glass is light and thin, transparent and clean, anti-fingerprint, anti-glare, hard and scratch-resistant, and performs well in weather resistance. It is applicable to terminals such as high-...
Global and China Graphene Industry Report, 2020-2026
Graphene, a kind of 2D carbon nanomaterial, features excellent properties such as mechanical property and super electrical conductivity and thermal conductivity. Its downstream application ranges from...
Global and China 3D Glass Industry Report, 2020-2026
Global 3D glass market has been enlarging over the recent years amid demetallization of smartphone back covers and popularity of smart wearables, to approximately $2.86 billion in 2019 and to an estim...
Global and China Photoresist Industry Report, 2020-2026
In 2019, global photoresist market was valued at $8.3 billion, growing at a compound annual rate of 5.1% or so since 2010, and it will outnumber $12.7 billion in 2026 with advances in electronic techn...
Global and China Synthetic Diamond Industry Report, 2020-2026
While its mechanical property is given full play in fields like grinding and cutting, diamond with acoustic, optical, magnetic, thermal and other special properties, as superconducting material, intel...
Global and China Needle Coke Industry Report, 2020-2026
With the merits like small resistivity, excellent resistance to impact and good anti-oxidation property, needle coke has been widely used in ultra-high power graphite electrodes, nuclear reactor decel...
Global and China Optical Fiber Preform Industry Report, 2019-2025
Optical fiber preform, playing an important role in the optical fiber and cable industry chain, seizes about 70% profits of optical fiber. Global demand for optical fiber preform stood at 16.2kt in 20...
China Silicon Carbide Industry Report, 2019-2025
Silicon carbide (SiC) is the most mature and the most widely used among third-generation wide band gap semiconductor materials. Over the past two years, global SiC market capacity, however, hovered ar...
Global and China Photoresist Industry Report, 2019-2025
Photoresist, a sort of material indispensable to PCB, flat panel display, optoelectronic devices, among others, keeps expanding in market size amid the robust demand from downstream sectors. In 2018, ...
Global and China Graphene Industry Report, 2019-2025
Graphene is featured with excellent performance and enjoys a rosy prospect. The global graphene market was worth more than $100 million in 2018, with an anticipated CAGR of virtually 45% between 2019 ...
Global and China 3D Glass Industry Chain Report, 2019-2025
The evolution of AMOLED conduces to the steady development of 3D curved glass market. In 2018, the global 3D glass market expanded 37.7% on an annualized basis and reached $1.9 billion, a figure proje...
China Wood Flooring Industry Report, 2019-2025
With the better standard of living and the people’s desire for an elegant life, wood flooring sees a rising share in the flooring industry of China, up from 33.9% in 2009 to 38.9% in 2018, just behind...
Global and China Photovoltaic Glass Industry Report, 2019-2025
In China, PV installed capacity has ramped up since the issuance of photovoltaic (PV) subsidy policies, reaching 53GW in 2017, or over 50% of global total. However, the domestic PV demand was hit by t...
Global and China ITO Targets Industry Chain Report, 2019-2025
Featured by good electrical conductivity and transparency, ITO targets are widely applied to fields of LCD, flat-panel display, plasma display, touch screen, electronic paper, OLED, solar cell, antist...
Global and China MO Source Industry Report, 2019-2025
MO source is a key raw material for metal-organic chemical vapor deposition (MOCVD) process. Global MO source output ranged at 102.6 tons in 2018, a rise of roughly 4.6% from a year earlier, a figure ...
Global and China Bi-Metal Band Saw Blade Industry Report, 2018-2023
Chinese manufacturing rebounded in the wake of a pick-up in infrastructure construction between 2016 and 2018, so did the bi-metal band saw blade as a key integral of metal processing industry. In 201...