China Hydrogen Storage Materials Industry Report, 2014-2017
-
Mar.2015
- Hard Copy
- USD
$2,200
-
- Pages:90
- Single User License
(PDF Unprintable)
- USD
$2,100
-
- Code:
ZL021
- Enterprise-wide License
(PDF Printable & Editable)
- USD
$3,200
-
- Hard Copy + Single User License
- USD
$2,400
-
Traditionally, there are two methods of storing hydrogen. One is to store hydrogen gas by using high-pressure cylinders, and the other is to store liquid hydrogen. In recent years, a simple new method of hydrogen storage has been developed, namely through hydrogen storage alloy (a metal hydride) which principally consists of titanium-based hydrogen storage alloy, zirconium-based hydrogen storage alloy, iron-based hydrogen storage alloy, as well as rare earth hydrogen storage alloy, etc.
Since 2005, the output of hydrogen storage materials and NI-MH battery in China has exceeded Japan as the world's biggest producer, with hydrogen storage alloy output accounting for about 60% of global total. After 2006, China’s production of hydrogen storage alloy grew at a lower rate, with the capacity in 2014 reaching around 38,000 tons, reflecting that hydrogen storage material enterprises did not actively expand their capacity. This resulted mainly from factors below: firstly, fierce competition between enterprises due to domestic overcapacity; secondly, the prices of key raw materials such as nickel, cobalt, and rare earth fluctuated dramatically in recent years, leading to poorer corporate profitability than expected.
Now that the global NI-MH battery gradually gives way to lithium battery, China’s NI-MH battery output would shrink, thus affecting the development of hydrogen storage materials. China’s NI-MH battery output has declined for many years, with the output in 2014 amounting to 700 million units, a drop of 33.3% compared with 2010. However, with the advance in hydrogen fuel cell technologies, the growing demand for hydrogen fuel cells from new-energy vehicle is expected to drive the expansion of the hydrogen storage material market.
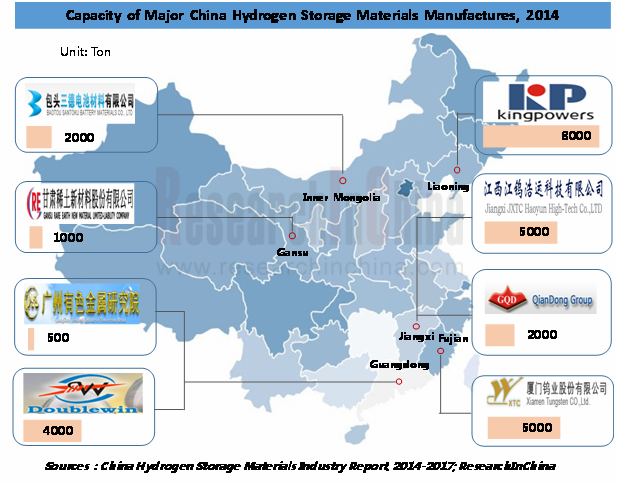
In the context of the integration of rare earth resources in China, China’s hydrogen storage material manufacturers are divided into two echelons: rare earth enterprises in Northern and Southern China. The former is represented by Liaoning Kingpowers and Baotou Steel Rare-Earth(Group) while the latter mainly includes Jiangxi Rare Earth and Rare Metals Tungsten Group Corporation and Xiamen Tungsten. In 2014, the enterprise with the largest hydrogen storage material capacity was Liaoning Kingpowers, with the annual capacity of 8,000 tons.
China Hydrogen Storage Materials Industry Report, 2014-2017 by ResearchInChina highlights the following:
 Status quo, competitive landscape, supply and demand, development prediction, etc. of China’s hydrogen storage material industry;
Current situation, development trends, etc. of upstream and downstream sectors of China’s hydrogen storage material industry;
Operation, hydrogen storage business, and growth prediction, etc. of 17 Chinese hydrogen storage material enterprises.
1 Overview of Hydrogen Storage Materials
1.1 Industry Background
1.2 Classification
1.3 Application
1.4 Industry Chain
1.5 Development Trend
2 Development of Hydrogen Storage Material Industry in China
2.1 Policy Environment
2.2 Technical Environment
2.3 Supply
2.4 Demand
2.5 Competitive Landscape
3 Upstream and Downstream Sectors of China's Hydrogen Storage Industry
3.1 Rare Earth
3.2 Nickel
3.3 Cobalt
3.4 NI-MH Battery
3.5 Fuel Cell
3.5.1 Technology
3.5.2 Scale
3.5.3 Costs
3.5 Planning
4 Main Hydrogen Storage Material Manufacturers in China
4.1 Xiamen Tungsten Co., Ltd.
4.1.1 Profile
4.1.2 Operation
4.1.3 Revenue Structure
4.1.4 Gross Margin
4.1.5 Hydrogen Storage Materials
4.1 6 Prospects and Forecast
4.2 AT&M
4.2.1 Profile
4.2.2 Operation
4.2.3 Revenue Structure
4.2.4 Gross Margin
4.2.5 Hydrogen Storage Materials
4.2 6 Prospects and Forecast
4.3 Sinoma Science & Technology Co., Ltd. (SSTCL)
4.3.1 Profile
4.3.2 Operation
4.3.3 Revenue Structure
4.3.4 Gross Margin
4.3.5 Hydrogen Storage Materials
4.3 6 Prospects and Forecast
4.4 Zhangjiagang Furui Special Equipment Co., Ltd.
4.4.1 Profile
4.4.2 Operation
4.4.3 Revenue Structure
4.4.4 Gross Margin
4.4.5 Hydrogen Storage Materials
4.4 6 Prospects and Forecast
4.5 China Northern Rare Earth (Group) High-Tech Co., Ltd.
4.5.1 Profile
4.5.2 Operation
4.5.3 Revenue Structure
4.5.4 Gross Margin
4.5.5 Hydrogen Storage Materials
4.5 6 Prospects and Forecast
4.6 Guangdong Rising Nonferrous Metals Group Co., Ltd.
4.6.1 Profile
4.6.2 Operation
4.6.3 Revenue Structure
4.6.4 Gross Margin
4.6.5 Hydrogen Storage Materials
4.6 6 Prospects and Forecast
4.7 Jiangmen Kanhoo Industry Co., Ltd.
4.7.1 Profile
4.7.2 Operation
4.7.3 Revenue Structure
4.7.4 Gross Margin
4.7.5 Hydrogen Storage Materials
4.7 6 Prospects and Forecast
4.8 Hunan Corun New Energy Co., Ltd.
4.8.1 Profile
4.8.2 Operation
4.8.3 Revenue Structure
4.8.4 Gross Margin
4.8.5 Hydrogen Storage Materials
4.8 6 Prospects and Forecast
4.9 Liaoning Kingpowers Group
4.10 Jiangxi Rare Earth and Rare Metals Tungsten Group Corporation
4.11 Sihui City Double Win Industry Co., Ltd.
4.12 Baotou Santoku Battery Materials Co., Ltd.
4.13 Others
4.13. 1 General Research Institute for Nonferrous Metals (GRINM)
4.13. 2 Jiangxi JXTC Haoyun High-Tech Co., Ltd.
4.13. 3 Gansu Rare Earth New Material Limited-Liability Company
4.13.4 Ganzhou Qiandong Rare Earth Group Co., Ltd. (GQD)
4.13. 5 Guangzhou Research Institute of Non-ferrous Metals
5 Summary and Forecast
5.1 Summary
5.2 Forecast
Hydrogen Storage Capacity of Hydrogen Storage Technologies
Classification of Hydrogen Storage Alloys
Classification of Rare Earth-based AB5 Hydrogen Storage Alloy Products
Hydrogen Storage Alloy Applications
Hydrogen Storage Material Industry Chain
Policies and Regulations on Hydrogen Storage Materials and New Energy in China
Number of Hydrogen Storage Material Patents Applied Globally, 1960-2012
Number of Chemical Hydrogen Storage Material Patents Applied, 1960-2012
Capacity of Hydrogen Storage Materials in China, 2004-2014
Output of Hydrogen Storage Materials in China, 2001-2014
Percentage of China’s Hydrogen Storage Material Output in Global Total, 2007-2014
Domestic Demand for Hydrogen Storage Materials in China, 2004-2014
Export Volume of Hydrogen Storage Materials in China,2007-2014
Distribution of Hydrogen Storage Material Patents Applied Globally by Country
Proportion of China’s Rare Earth Output in Global Total, 2007-2014
Capacity of Major Hydrogen Storage Material Manufacturers in China, 2014
Output of Rare Earth Ore in China, 2004-2014
Output of Rare Earth Products in China, 2004-2014
China’s Rare Earth Consumption, 2004-2014
Consumption of Rare Earth for Hydrogen Storage Materials in China, 2004-2014
Price for Lanthanum Oxide, 2013-2015
Price Trend of Praseodymium-Neodymium Oxide, 2003-2015
Global Nickel Supply and Demand, 2008-2015E
Price Trend of Electrolytic Nickel and Nickel-converted Nickel Ferrite in China, 2012-2014
LME’s Nickel Price and Inventory, 2008-2014
Distribution of Cobalt Reserves Worldwide
Cobalt Consumption Worldwide, 2006-2014
Structure of Cobalt Consumption Worldwide, 2013
Cobalt Consumption in China, 2006-2013
Cobalt Consumption Structure in China, 2013
Cobalt Price Trend, 2014
Global Battery Sales Volume, 2013-2014
NI-MH Battery Output in China, 2005-2014
NI-MH Battery Capacity in China, 2005-2014
Revenue and Total Profit of NI-MH Battery in China, 2012-2014
Import & Export Volume of NI-MH Battery in China,2003-2014
Import & Export Value of NI-MH Battery in China,2003-2014
Strength and Weakness of Various Automotive Technology Roadmaps
Comparison between Fuel Cell and Lithium Battery
Industry Chain of Fuel Cell Vehicles
Global Fuel Cell Shipments, 2008-2013
Sales Volume of Fuel Cells Globally, 2008-2013
Global Distribution of Hydrogen Filling Stations, 2014
Demand for Fuel Cell Vehicles as well as Number of Hydrogen Filling Stations and Relative Costs in the UK
Costs of Fuel Cell System, 2012-2017E
Economies of Scale for Proton Exchange Membrane Fuel Cell Costs
Construction Plans for Hydrogen Filling Stations in Major Countries
Japan’s Development Plan for Hydrogen Energy/Fuel Cells
Revenue and Net Income of Xiamen Tungsten, 2008-2014
Revenue of Xiamen Tungsten by Product, 2008-2014
Revenue of Xiamen Tungsten by Region, 2008-2014
Gross Margin of Xiamen Tungsten by Product, 2008-2014
Revenue and Net Income of Xiamen Tungsten, 2012-2017E
AT&M’s Revenue and Net Income, 2008-2014
AT&M’s Revenue by Product, 2008-2014
AT&M’s Revenue by Region, 2008-2014
AT&M’s Gross Margin by Product, 2008-2014
Revenue and Net Income of Beijing Harmofinery Technology, 2012-2014
AT&M’s Revenue and Net Income, 2012-2017E
SSTCL’s Revenue and Net Income, 2008-2014
SSTCL’s Revenue by Product, 2008-2014
SSTCL’s Revenue by Region, 2008-2014
SSTCL’s Gross Margin by Product, 2008-2014
Sinoma Suzhou’s Revenue and Net Income, 2012-2014
SSTCL’s Revenue and Net Income, 2012-2017E
Revenue and Net Income of Furui Special Equipment, 2008-2014
Revenue of Furui Special Equipment by Product, 2008-2014
Revenue of Furui Special Equipment by Region, 2008-2014
Gross Margin of Furui Special Equipment by Product, 2008-2014
Revenue and Net Income of Furui Special Equipment , 2012-2017E
Revenue and Net Income of China Northern Rare Earth (Group) High-Tech,2008-2014
Revenue of China Northern Rare Earth (Group) High-Tech by Product, 2009-2014
Revenue of China Northern Rare Earth (Group) High-Tech by Region,2008-2014
Gross Margin of China Northern Rare Earth (Group) High-Tech by Product,2008-2014
Hydrogen Storage Material Subsidiaries of China Northern Rare Earth (Group) High-Tech
Revenue and Net Income of China Northern Rare Earth (Group) High-Tech, 2012-2017E
Revenue and Net Income of Guangdong Rising Nonferrous Metals Group, 2008-2014
Revenue of Guangdong Rising Nonferrous Metals Group by Product, 2008-2014
Revenue of Guangdong Rising Nonferrous Metals Group by Region, 2008-2014
Gross Margin of Guangdong Rising Nonferrous Metals Group by Product, 2008-2014
Revenue and Net Income of Guangdong Rising Nonferrous Metals Group, 2012-2017E
Revenue and Net Income of Jiangmen Kanhoo Industry, 2008-2014
Revenue of Jiangmen Kanhoo Industry by Product, 2008-2014
Revenue of Jiangmen Kanhoo Industry by Region, 2008-2014
Gross Margin of Jiangmen Kanhoo Industry by Product, 2008-2014
Revenue and Net Income of Jiangmen Kanhoo Industry, 2008-2017E
Corun’s Revenue and Net Income, 2008-2014
Corun’s Revenue by Product, 2008-2014
Corun’s Revenue by Region, 2008-2014
Corun’s Gross Margin by Product, 2008-2014
Corun’s Revenue and Net Income, 2012-2017E
Liaoning Kingpowers’ Subsidiaries and Hydrogen Storage Alloy Capacity,
Capacity and Output of Hydrogen Storage Alloy in China, 2004-2014
Capacity and Output of NI-MH Battery in China, 2010-2017E
Global Fuel Cell Shipments, 2010-2017E
Global and China Photoresist Industry Report, 2021-2026
Since its invention in 1959, photoresist has been the most crucial process material for the semiconductor industry. Photoresist was improved as a key material used in the manufacturing process of prin...
Global and China Needle Coke Industry Report, 2021-2026
Needle coke is an important carbon material, featuring a low thermal expansion coefficient, a low electrical resistivity, and strong thermal shock resistance and oxidation resistance. It is suitable f...
Global and China 3D Glass Industry Report, 2021-2026
3D curved glass is light and thin, transparent and clean, anti-fingerprint, anti-glare, hard and scratch-resistant, and performs well in weather resistance. It is applicable to terminals such as high-...
Global and China Graphene Industry Report, 2020-2026
Graphene, a kind of 2D carbon nanomaterial, features excellent properties such as mechanical property and super electrical conductivity and thermal conductivity. Its downstream application ranges from...
Global and China 3D Glass Industry Report, 2020-2026
Global 3D glass market has been enlarging over the recent years amid demetallization of smartphone back covers and popularity of smart wearables, to approximately $2.86 billion in 2019 and to an estim...
Global and China Photoresist Industry Report, 2020-2026
In 2019, global photoresist market was valued at $8.3 billion, growing at a compound annual rate of 5.1% or so since 2010, and it will outnumber $12.7 billion in 2026 with advances in electronic techn...
Global and China Synthetic Diamond Industry Report, 2020-2026
While its mechanical property is given full play in fields like grinding and cutting, diamond with acoustic, optical, magnetic, thermal and other special properties, as superconducting material, intel...
Global and China Needle Coke Industry Report, 2020-2026
With the merits like small resistivity, excellent resistance to impact and good anti-oxidation property, needle coke has been widely used in ultra-high power graphite electrodes, nuclear reactor decel...
Global and China Optical Fiber Preform Industry Report, 2019-2025
Optical fiber preform, playing an important role in the optical fiber and cable industry chain, seizes about 70% profits of optical fiber. Global demand for optical fiber preform stood at 16.2kt in 20...
China Silicon Carbide Industry Report, 2019-2025
Silicon carbide (SiC) is the most mature and the most widely used among third-generation wide band gap semiconductor materials. Over the past two years, global SiC market capacity, however, hovered ar...
Global and China Photoresist Industry Report, 2019-2025
Photoresist, a sort of material indispensable to PCB, flat panel display, optoelectronic devices, among others, keeps expanding in market size amid the robust demand from downstream sectors. In 2018, ...
Global and China Graphene Industry Report, 2019-2025
Graphene is featured with excellent performance and enjoys a rosy prospect. The global graphene market was worth more than $100 million in 2018, with an anticipated CAGR of virtually 45% between 2019 ...
Global and China 3D Glass Industry Chain Report, 2019-2025
The evolution of AMOLED conduces to the steady development of 3D curved glass market. In 2018, the global 3D glass market expanded 37.7% on an annualized basis and reached $1.9 billion, a figure proje...
China Wood Flooring Industry Report, 2019-2025
With the better standard of living and the people’s desire for an elegant life, wood flooring sees a rising share in the flooring industry of China, up from 33.9% in 2009 to 38.9% in 2018, just behind...
Global and China Photovoltaic Glass Industry Report, 2019-2025
In China, PV installed capacity has ramped up since the issuance of photovoltaic (PV) subsidy policies, reaching 53GW in 2017, or over 50% of global total. However, the domestic PV demand was hit by t...
Global and China ITO Targets Industry Chain Report, 2019-2025
Featured by good electrical conductivity and transparency, ITO targets are widely applied to fields of LCD, flat-panel display, plasma display, touch screen, electronic paper, OLED, solar cell, antist...
Global and China MO Source Industry Report, 2019-2025
MO source is a key raw material for metal-organic chemical vapor deposition (MOCVD) process. Global MO source output ranged at 102.6 tons in 2018, a rise of roughly 4.6% from a year earlier, a figure ...
Global and China Bi-Metal Band Saw Blade Industry Report, 2018-2023
Chinese manufacturing rebounded in the wake of a pick-up in infrastructure construction between 2016 and 2018, so did the bi-metal band saw blade as a key integral of metal processing industry. In 201...