Global and China Solar Cell Paste Industry Report, 2014-2017
-
Mar.2015
- Hard Copy
- USD
$2,350
-
- Pages:92
- Single User License
(PDF Unprintable)
- USD
$2,200
-
- Code:
HK056
- Enterprise-wide License
(PDF Printable & Editable)
- USD
$3,400
-
- Hard Copy + Single User License
- USD
$2,550
-
Solar cell paste, an electronic paste for the production of crystalline silicon solar cell, consists of frontside Ag paste, backside Al paste, and backside Ag paste, and accounts for about 20% of solar cell costs, serving as key fundamental material in photovoltaic industry.
Being a kind of clean, stable and renewable energy, solar energy is one of the best approaches to solve energy shortage and environmental pollution. Against the background of global energy conservation and emission reduction, governments around the world have enacted a host of incentive policies to promote the development of PV industry, driving rapid growth in demand for solar cell. In 2014, global cumulative installed PV capacity approximated 184.6GW, registering a high CAGR of 45% over the past five years.
The consumption of solar cell paste in solar cell is relatively fixed, and growth in solar cell output directly spurs demand for solar cell paste. In 2014, global demand for solar cell paste reached around 18,000 tons, supplied mainly by U.S. DuPont, German Heraeus, and Taiwanese Giga Solar Materials, which took a combined market share of roughly 90%.
China is a nation with a large PV industry, with solar module output standing at about 30GW in 2014, making up more than 60% of the global total, creating theoretical solar cell paste demand of over 11,000 tons. However, as some companies directly imported solar cell or had Taiwanese firms manufacture solar cell, China’s actual demand for solar cell paste is lower than theoretical amount.
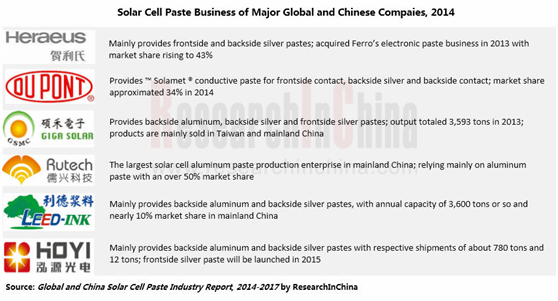
China started late in solar cell paste industry, technologically lagging far behind large international companies. At present, among all solar cell paste products in China, localization rate of Al paste is as high as 90%, with Guangzhou Ruxing Technology Development Co., Ltd occupying over 50% of the domestic market; Ag paste relies heavily on imports, with more than 80% market shares controlled by DuPont, Heraeus, and Giga Solar Materials.
However, thanks to multiple supportive policies introduced by the State, a number of local manufacturers have emerged in solar cell paste industry in China. In 2014, solar cell paste capacity of Hunan LEED Thick Film Paste Co., Ltd. totaled about 3,600 tons; Jiangsu Hoyi Technology Co., Ltd shipped around 780 tons of Al paste and 12 tons or so of Ag paste for back surfaces, and Ag for front surfaces will be sold from 2015.
?
Global and China Solar Cell Paste Industry Report, 2014-2017 by ResearchInChina focuses on the following:
 Global and China’s solar cell paste demand, competitive landscape, and development forecast;
Global installed PV capacity, supply & demand, competitive landscape, and development forecast;
China’s installed PV capacity, supply & demand, import & export, and development forecast;
Operation, solar cell paste business, and development forecast of 14 global and Chinese solar cell paste manufacturers.
1. Overview of Solar Cell Paste
1.1 Solar Cell Paste
1.2 Solar Cell
1.3 Industrial Chain
2. Solar Cell Paste Industry
2.1 Global
2.2 China
2.3 Competitive Landscape
2.3.1 Global
2.3.2 China
3. Solar Cell Industry
3.1 Global
3.1.1 Installed Capacity
3.1.2 Supply
3.1.3 Demand
3.2 China
3.2.1 Status Quo
3.2.2 Industrial Policy
3.2.3 Operation of Industry
3.2.4 Installed Capacity
3.2.5 Supply
3.2.6 Demand
3.2.7 Import & Export
3.3 Competitive Landscape
4. Major Foreign Companies
4.1 DuPont
4.1.1 Profile
4.1.2 Operation
4.1.3 Operation of Electronics & Communications Segment
4.1.4 Solar Cell Paste Business
4.1.5 Business in China
4.2 Heraeus
4.2.1 Profile
4.2.2 Operation
4.2.3 Solar Cell Paste Business
4.2.4 Business in China
4.3 Giga Solar Materials
4.3.1 Profile
4.3.2 Operation
4.3.3 Revenue Structure
4.3.4 R&D
4.3.5 Output and Sales
4.3.6 Development
5. Major Chinese Companies
5.1 Suzhou Good-Ark Electronics Co. Ltd.
5.1.1 Profile
5.1.2 Operation
5.1.3 Revenue Structure
5.1.4 Gross Margin
5.1.5 R&D
5.1.6 Solar Cell Paste Business
5.1.7 Forecast and Outlook
5.2 EGing Photovoltaic Technology Co., Ltd
5.2.1 Profile
5.2.2 Operation
5.2.3 Revenue Structure
5.2.4 Gross Margin
5.2.5 R&D
5.2.6 Solar Module Business
5.2.7 Forecast and Outlook
5.3 Jiangsu Hoyi Technology Co., Ltd
5.3.1 Profile
5.3.2 Operation
5.3.3 Revenue Structure
5.3.4 Gross Margin
5.3.5 R&D
5.3.6 Customers and Suppliers
5.3.7 Solar Cell Paste Business
5.3.8 Forecast and Outlook
5.4 Hunan LEED Thick Film Paste Co., Ltd.
5.4.1 Profile
5.4.2 Operation
5.4.3 Revenue Structure
5.4.4 Gross Margin
5.4.5 R&D
5.4.6 Customers and Suppliers
5.4.7 Solar Cell Paste Business
5.4.8 Forecast and Outlook
5.5 Xi'an Hongxing Electronic Paste Co., Ltd
5.5.1 Profile
5.5.2 Operation
5.6 Others
5.6.1 Guangzhou Ruxing Technology Development Co., Ltd
5.6.2 Wuhan Supernano Optoelec Technology Co., Ltd.
5.6.3 Shanghai Daejoo Electronic Materials Co., Ltd.
5.6.4 Shenzhen Full Power Technology Co., Ltd.
5.6.5 Hangzhou Rightsilver Electronic Materials Co., Ltd
5.6.6 Zhejiang Gonda Electronic Technology Co., Ltd
6. Summary and Forecast
6.1 Summary
6.2 Development Forecast
6.2.1 Global Market
6.2.2 Chinese Market
Classification and Function of Solar Cell Paste
Structure of Crystalline Silicon Solar Cell
Industrial Chain of Solar Cell Paste
Global Demand for Solar Cell Paste, 2009-2014
Global Demand for Solar Cell Paste by Product, 2009-2014
China’s Theoretical Demand for Solar Cell Paste, 2009-2014
China’s Theoretical Demand for Solar Cell Paste by Product, 2009-2014
Global Solar Cell Paste Competition Pattern, 2014
Global Solar Cell Paste Competition Pattern by Product, 2014
Major Solar Cell Paste Manufacturers in China, 2014
Solar Cell Paste Competition Pattern in China by Product, 2014
Global Installed PV Capacity and Growth Rate, 2009-2014
Main Regions’ Share of Global Installed PV Capacity, 2011-2013
Europe’s Installed PV Capacity and Growth Rate, 2009-2013
Major European Countries’ Share of Total Installed PV Capacity in Europe, 203
Germany’s Installed PV Capacity and Growth Rate, 2009-2013
Italy’s Installed PV Capacity and Growth Rate, 2009-2013
Japan’s Installed PV Capacity and Growth Rate, 2009-2013
U.S. Installed PV Capacity and Growth Rate, 2009-2013
Global Solar Module Output and Growth Rate, 2009-2014
Global Solar Module Output by Region, 2013
Global New PV Capacity and Growth Rate, 2010-2014
Geographical Distribution of Global New PV Capacity, 2013
Policies on PV Industry in China
Operating Revenue and Total Profits of China PV Industry, 2012-2014
Gross Margin of China PV Industry, 2012-2014
China’s Installed PV Capacity and Growth Rate, 2009-2014
Geographical Distribution of China’s Installed PV Capacity, 2014
China’s Solar Cell Output and Growth Rate, 2009-2014
China’s Solar Cell Output Structure by Region, 2014
China’s New PV Capacity and Growth Rate, 2010-2014
Geographical Distribution of China’s New PV Capacity, 2014
China’s Solar Cell Import and Export Volume, 2012-2014
China’s Solar Cell Import and Export Value, 2012-2014
Average Import and Export Prices of Solar Cell in China, 2012-2014
Sources of Imported Solar Cell in China by Import Value, 2014
Destinations of Exported Solar Cell from China by Export Value, 2014
Main Importing Regions of Solar Cell and Percentage in China by Import Value, 2014
Main Exporting Provinces of Solar Cell and Percentage in China by Export Value, 2014
Capacity and Percentage of Global Top10 Solar Module Companies, 2013
Output and Percentage of Global Top10 Solar Module Companies, 2013
Net Revenue and Net Income of DuPont, 2010-2014
Revenue Structure of DuPont by Segment, 2012-2014
Revenue Structure of DuPont by Region, 2012-2014
Revenue and Net Income of DuPont Electronics & Communications, 2012-2014
Revenue Structure of DuPont Electronics & Communications by Product, 2011-2013
Revenue Structure of DuPont Electronics & Communications by Downstream Market, 2011-2013
Revenue Structure of DuPont Electronics & Communications by Region, 2011-2013
Solar Cell Paste Products of DuPont
Development and Application of DuPont’s Solar Cell Paste
Revenue and Net Income of Heraeus, 2009-2013
Revenue Structure of Heraeus by Segment, 2011-2013
Revenue Structure of Heraeus by Region, 2013
Revenue and Net Income of Giga Solar Materials, 2010-2014
Revenue Breakdown of Giga Solar Materials by Product, 2012-2013
Revenue Structure of Giga Solar Materials by Product, 2012-2013
Revenue Breakdown of Giga Solar Materials by Region, 2011-2013
Revenue Structure of Giga Solar Materials by Region, 2011-2013
R&D Costs and % of Total Revenue of Giga Solar Materials, 2011-2013
Solar Conductive Paste Capacity and Output of Giga Solar Materials, 2011-2013
Output Value and Average Price of Solar Conductive Paste of Giga Solar Materials, 2011-2013
Solar Conductive Paste Sales Volume of Giga Solar Materials by Region, 2011-2013
Selling Price of Solar Conductive Paste of Giga Solar Materials by Region, 2011-2013
Revenue and Net Income of Suzhou Good-Ark Electronics
Revenue Breakdown of Suzhou Good-Ark Electronics by Product, 2012-2014
Revenue Structure of Suzhou Good-Ark Electronics by Product, 2012-2014
Revenue Breakdown of Suzhou Good-Ark Electronics by Region, 2012-2014
Revenue Structure of Suzhou Good-Ark Electronics by Region, 2012-2014
Gross Margins of Suzhou Good-Ark Electronics’ Main Products, 2012-2014
R&D Costs and % of Total Revenue of Suzhou Good-Ark Electronics, 2012-2014
Revenue and Net Income of Suzhou Isilver Materials, 2012-2014
Revenue and Net Income of Suzhou Good-Ark Electronics, 2013-2017E
Revenue and Net Income of EGing Photovoltaic Technology, 2010-2014
Revenue Breakdown of EGing Photovoltaic Technology by Product, 2012-2014
Revenue Structure of EGing Photovoltaic Technology by Product, 2012-2014
Revenue Breakdown of EGing Photovoltaic Technology by Region, 2012-2014
Revenue Structure of EGing Photovoltaic Technology by Region, 2012-2014
Gross Margins of EGing Photovoltaic Technology’s Main Products, 2012-2014
R&D Centers of EGing Photovoltaic Technology
R&D Costs and % of Total Revenue of EGing Photovoltaic Technology, 2012-2014
Solar Cell Sales Volume of EGing Photovoltaic Technology, 2011-2013
Solar Module Sales Volume of EGing Photovoltaic Technology, 2011-2013
Total Assets and Net Income of Changzhou EGing Solar Paste, 2012-2014
Revenue and Net Income of EGing Photovoltaic Technology, 2013-2017E
Revenue and Net Income of Jiangsu Hoyi Technology, 2011-2014
Revenue Breakdown of Jiangsu Hoyi Technology by Product, 2012-2014
Revenue Structure of Jiangsu Hoyi Technology by Product, 2012-2014
Revenue Breakdown of Jiangsu Hoyi Technology by Region, 2011-2013
Revenue Structure of Jiangsu Hoyi Technology by Region, 2011-2013
Gross Margins of Jiangsu Hoyi Technology’s Main Products, 2012-2014
R&D Costs and % of Total Revenue of Jiangsu Hoyi Technology, 2012-2014
Jiangsu Hoyi Technology’s Revenue from Top5 Customers and % of Total Revenue, 2012-2014
Name List and Revenue Contribution of Jiangsu Hoyi Technology’s Top5 Customers, 2014H1
Jiangsu Hoyi Technology’s Procurement from Top5 Suppliers and % of Total Procurement, 2011-2013
Name List and Procurement of Jiangsu Hoyi Technology’s Top 5 Suppliers, 2014H1
Revenue and Net Income of Jiangsu Hoyi Technology, 2013-2017E
Revenue and Net Income of Hunan LEED Thick Film Paste, 2012-2014
Revenue Breakdown of Hunan LEED Thick Film Paste by Product, 2012-2014
Revenue Structure of Hunan LEED Thick Film Paste by Product, 2012-2014
Gross Margins of Hunan LEED Thick Film Paste’s Main Products, 2012-2014
R&D Costs and % of Total Revenue of Hunan LEED Thick Film Paste, 2012-2014
Hunan LEED Thick Film Paste’s Revenue from Top5 Customers and % of Total Revenue, 2012-2014
Name List and Revenue Contribution of Hunan LEED Thick Film Paste’s Top5 Customers, Jan-May 2014
Hunan LEED Thick Film Paste’s Procurement from Top5 Suppliers and % of Total Procurement, 2012-2014
Name List and Procurement of Hunan LEED Thick Film Paste’s Top 5 Suppliers, 2014H1
Revenue and Net Income of Hunan LEED Thick Film Paste, 2013-2017E
Revenue and Net Income of Xi'an Hongxing Electronic Paste, 2013-2014
Solar Cell Paste Revenue of Major Global and Chinese Companies, 2013-2014
Global Installed PV Capacity, 2013-2017E
Global Solar Module Demand and Growth Rate, 2013-2017E
Global Solar Paste Demand, 2013-2017E
China’s Installed PV Capacity, 2013-2017E
China’s Solar Module Output and Growth Rate, 2013-2017E
China’s Theoretical Demand for Solar Cell Paste, 2013-2017E
Global and China Photoresist Industry Report, 2021-2026
Since its invention in 1959, photoresist has been the most crucial process material for the semiconductor industry. Photoresist was improved as a key material used in the manufacturing process of prin...
Global and China Needle Coke Industry Report, 2021-2026
Needle coke is an important carbon material, featuring a low thermal expansion coefficient, a low electrical resistivity, and strong thermal shock resistance and oxidation resistance. It is suitable f...
Global and China 3D Glass Industry Report, 2021-2026
3D curved glass is light and thin, transparent and clean, anti-fingerprint, anti-glare, hard and scratch-resistant, and performs well in weather resistance. It is applicable to terminals such as high-...
Global and China Graphene Industry Report, 2020-2026
Graphene, a kind of 2D carbon nanomaterial, features excellent properties such as mechanical property and super electrical conductivity and thermal conductivity. Its downstream application ranges from...
Global and China 3D Glass Industry Report, 2020-2026
Global 3D glass market has been enlarging over the recent years amid demetallization of smartphone back covers and popularity of smart wearables, to approximately $2.86 billion in 2019 and to an estim...
Global and China Photoresist Industry Report, 2020-2026
In 2019, global photoresist market was valued at $8.3 billion, growing at a compound annual rate of 5.1% or so since 2010, and it will outnumber $12.7 billion in 2026 with advances in electronic techn...
Global and China Synthetic Diamond Industry Report, 2020-2026
While its mechanical property is given full play in fields like grinding and cutting, diamond with acoustic, optical, magnetic, thermal and other special properties, as superconducting material, intel...
Global and China Needle Coke Industry Report, 2020-2026
With the merits like small resistivity, excellent resistance to impact and good anti-oxidation property, needle coke has been widely used in ultra-high power graphite electrodes, nuclear reactor decel...
Global and China Optical Fiber Preform Industry Report, 2019-2025
Optical fiber preform, playing an important role in the optical fiber and cable industry chain, seizes about 70% profits of optical fiber. Global demand for optical fiber preform stood at 16.2kt in 20...
China Silicon Carbide Industry Report, 2019-2025
Silicon carbide (SiC) is the most mature and the most widely used among third-generation wide band gap semiconductor materials. Over the past two years, global SiC market capacity, however, hovered ar...
Global and China Photoresist Industry Report, 2019-2025
Photoresist, a sort of material indispensable to PCB, flat panel display, optoelectronic devices, among others, keeps expanding in market size amid the robust demand from downstream sectors. In 2018, ...
Global and China Graphene Industry Report, 2019-2025
Graphene is featured with excellent performance and enjoys a rosy prospect. The global graphene market was worth more than $100 million in 2018, with an anticipated CAGR of virtually 45% between 2019 ...
Global and China 3D Glass Industry Chain Report, 2019-2025
The evolution of AMOLED conduces to the steady development of 3D curved glass market. In 2018, the global 3D glass market expanded 37.7% on an annualized basis and reached $1.9 billion, a figure proje...
China Wood Flooring Industry Report, 2019-2025
With the better standard of living and the people’s desire for an elegant life, wood flooring sees a rising share in the flooring industry of China, up from 33.9% in 2009 to 38.9% in 2018, just behind...
Global and China Photovoltaic Glass Industry Report, 2019-2025
In China, PV installed capacity has ramped up since the issuance of photovoltaic (PV) subsidy policies, reaching 53GW in 2017, or over 50% of global total. However, the domestic PV demand was hit by t...
Global and China ITO Targets Industry Chain Report, 2019-2025
Featured by good electrical conductivity and transparency, ITO targets are widely applied to fields of LCD, flat-panel display, plasma display, touch screen, electronic paper, OLED, solar cell, antist...
Global and China MO Source Industry Report, 2019-2025
MO source is a key raw material for metal-organic chemical vapor deposition (MOCVD) process. Global MO source output ranged at 102.6 tons in 2018, a rise of roughly 4.6% from a year earlier, a figure ...
Global and China Bi-Metal Band Saw Blade Industry Report, 2018-2023
Chinese manufacturing rebounded in the wake of a pick-up in infrastructure construction between 2016 and 2018, so did the bi-metal band saw blade as a key integral of metal processing industry. In 201...