Global and China Viscose Fiber Industry Report, 2013-2016
-
May/2014
- Hard Copy
- USD
$2,650
-
- Pages:126
- Single User License
(PDF Unprintable)
- USD
$2,450
-
- Code:
ALZ003
- Enterprise-wide License
(PDF Printable & Editable)
- USD
$3,900
-
- Hard Copy + Single User License
- USD
$2,850
-
In recent years, the United States, Europe and Japan have successively withdrawn from the viscose fiber industry due to labor costs, environmental protection and other factors, while the Asia-Pacific Development Zone, including China, has entered a period of accelerated development of viscose fiber, with capacity and production increasing considerably. In 2013, the global viscose fiber output exceeded 4.9 million tons, up more than 13 % year on year, wherein, China contributed over 65%.
The Austria-based Lenzing Group and the India-based Aditya Birla Group as two viscose fiber giants worldwide gained capacity of above 800,000 tons/a each in 2013. But beyond that, Chinese counterparts also obtained greater capacity.
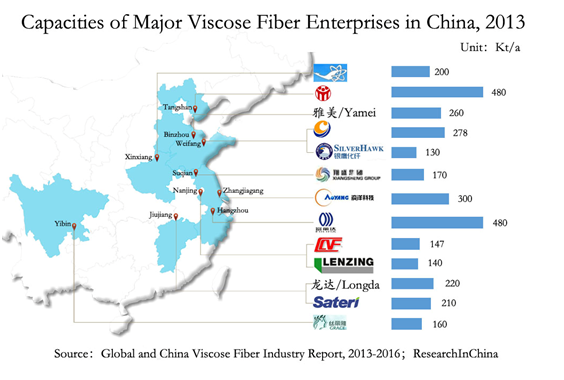
Viscose fiber includes viscose filament yarn (VFY) and viscose staple fiber (VSF), especially VSF capacity / output accounts for about 90% in China. In 2013, China’s VSF capacity approximated 3.45 million tons, 51.8% of which came from the top five enterprises, namely Fulida Group, Sanyou Chemical, Aoyang Technology, CHTC HELON and Shandong Yamei, showing a high industry concentration.?
In 2011-2013, the sluggish textile industry pulled down China’s overall prices of viscose fiber, resulting in a market downturn. However, based on promising prospects and corporate development needs, Sanyou Chemical, Sateri and Xinxiang Chemical Fiber are still planning to expand capacity with a focus on differentiated high-end products.
Being one of the Chinese VSF companies holding the highest product differentiation rate, Sanyou Chemical can reach above 80%. Following the operation of the 160,000 tons/a differentiated VSF project and the transformation of some production lines, the company, with overall VSF capacity of 480,000 tons/a as of end-2013, has became one of the largest VSF manufacturers in China. Furthermore, the company also plans to release incremental capacity of 50,000 tons through technological reform in 2014.
Sateri had only reached 210,000 tons/a viscose fiber by the end of 2013; but as China's largest dissolving wood pulp (DWP, the main raw material for viscose fiber) supplier, it enjoys around 40% market share with obvious cost advantages. Meanwhile, Sateri is accelerating the downstream viscose fiber capacity expansion, and its Fujian plant will obtain additional differentiated viscose fiber capacity of 150,000 tons/a in 2014 (wherein, 50,000 tons/a was realized in January and March 2014 each, and the remaining 50,000 tons/a will be put into operation in the third quarter).
As one of the largest VFY producers in China, Xinxiang Chemical Fiber saw VFY capacity of 60,000 tons/a in 2013. Currently, its subsidiary ------ Xinjiang Bailu has completed the “100,000 tons/a New-type Cellulose Project Phase I” and can accomplish full production in the first half of 2014.
The report mainly includes the following aspects:
 ?Supply, regional structure, competition pattern and trends of the global viscose fiber market;
Supply, capacity, competition pattern, policies, import, export and prices of Chinese viscose fiber market;
Status quo and competition pattern of Chinese bamboo fiber market segments;
Operation, revenue structure, gross margin, major clients, viscose fiber business and development of 18 domestic and foreign viscose fiber production enterprises.
1 Overview of Viscose Fiber
1.1 Definition and Characteristics
1.2 Classification and Application
1.3 Industry Chain
2 Global Viscose Fiber Industry
2.1 Development History
2.2 Overall Development
2.3 Output
2.4 Competition Pattern
3 China Viscose Fiber Industry
3.1 Development History
3.2 Operation
3.3 Policy
4 China Viscose Fiber Market
4.1 Overall Development
4.2 Capacity
4.3 Output
4.4 Import and Export
4.5 Price
5 China Bamboo Fiber Market
5.1 Introduction to Bamboo Fiber
5.2 Advantages of Bamboo Fiber
5.3 Market Overview
6 Key Foreign Enterprises
6.1 LENZING
6.1.1 Profile
6.1.2 Operation
6.1.3 Operation of Fiber Sector
6.1.4 Viscose Fiber Business
6.1.5 Business in China
6.1.6 Development
6.2 ADITYA BIRLA GROUP
6.2.1 Profile
6.2.2 Operation of Grasim
6.2.3 VSF Business of Grasim
6.2.4 Business in China
6.3 SATERI
6.3.1 Profile
6.3.2 Operation
6.3.3 Revenue Structure
6.3.4 Gross Margin
6.3.5 VSF Business
6.3.6 Business in China
7 Key Chinese Enterprises
7.1 CHTC HELON
7.1.1 Profile
7.1.2 Operation
7.1.3 Revenue Structure
7.1.4 Gross Margin
7.1.5 Clients
7.1.6 Viscose Fiber Business
7.1.7 Forecast & Outlook
7.2 Aoyang Technology
7.2.1 Profile
7.2.2 Operation
7.2.3 Revenue Structure
7.2.4 Gross Margin
7.2.5 Clients
7.2.6 Viscose Fiber Business
7.2.7 Forecast & Outlook
7.3 Xinxiang Chemical Fiber
7.3.1 Profile
7.3.2 Operation
7.3.3 Revenue Structure
7.3.4 Gross Margin
7.3.5 Clients
7.3.6 Viscose Fiber Business
7.3.7 Forecast & Outlook
7.4 Nanjing Chemical Fiber
7.4.1 Profile
7.4.2 Operation
7.4.3 Revenue Structure
7.4.4 Gross Margin
7.4.5 Clients
7.4.6 Viscose Fiber Business
7.4.7 Forecast & Outlook
7.5 Jilin Chemical Fibre
7.5.1 Profile
7.5.2 Operation
7.5.3 Revenue Structure
7.5.4 Gross Margin
7.5.5 Clients
7.5.6 Viscose Fiber Business
7.5.7 Forecast & Outlook
7.6 Swan Fiber
7.6.1 Profile
7.6.2 Operation
7.6.3 Revenue Structure
7.6.4 Gross Margin
7.6.5 Clients
7.6.6 Viscose Fiber Business
7.6.7 Forecast & Outlook
7.7 Sanyou Chemical
7.7.1 Profile
7.7.2 Operation
7.7.3 Revenue Structure
7.7.4 Gross Margin
7.7.5 Clients
7.7.6 Viscose Fiber Business
7.7.7 Forecast & Outlook
7.8 Hubei Golden Ring
7.8.1 Profile
7.8.2 Operation
7.8.3 Revenue Structure
7.8.4 Gross Margin
7.8.5 Clients
7.8.6 Forecast & Outlook
7.9 Fulida
7.9.1 Profile
7.9.2 Operation
7.9.3 Viscose Fiber Business
7.10 Grace
7.10.1 Profile
7.10.2 Operation
7.10.3 Viscose Fiber Business
7.11 Others
7.11.1 Shandong Yamei
7.11.2 Jiangsu Xiangsheng
7.11.3 Longda Chemical Fiber
7.11.4 Shandong Silver Hawk Chemical Fibre
7.11.5 Somettex
8 Summary and Forecast
8.1 Technology
8.2 Import and Export
8.3 Price
8.4 Capacity / Output
8.5 Enterprise
Viscose Fiber industry Chain
Global Fiber Output and Growth Rate, 2008-2013
Global Fiber Output Structure by Main Varieties, 2011-2013
Global Viscose Fiber Output and Growth Rate, 2006-2013
Global Viscose Fiber Output by Region, 2013
Capacity of the World’s Top 10 Viscose Fiber Manufacturers, 2013
Operating Revenue and YoY Growth Rate of China Cellulose Fiber Materials and Fiber Manufacturing, 2006-2013
Total Profit and YoY Growth Rate of China Cellulose Fiber Materials and Fiber Manufacturing, 2006-2013
List of Enterprises Subject to Viscose Fiber Industry Access Conditions (First Batch)
China’s Fiber Output Structure by Main Varieties, 2012-2013
Operating Revenue and YoY Growth Rate of China Chemical Fiber Manufacturing, 2006-2013
Capacity of China’s Leading Viscose Fiber Manufacturers, 2013
Major Chinese VSF Manufacturers and Capacity Proportion, 2013
Major Chinese VFY Manufacturers and Capacity Proportion, 2013
China’s Viscose Fiber Output and YoY Growth Rate, 2006-2013
China’s Viscose Fiber Output by Product, 2011-2013
China’s Viscose Fiber Output by Region, 2010
China’s VSF Import and Export Volume, 2008-2013
China’s VSF Import and Export Prices, 2008-2013
China’s VSF Export Destinations by Export Volume, 2013
China’s VSF Import Sources by Import Volume, 2013
China’s VSF Export Volume by Major Export Cities, 2013
China’s VSF Import Volume by Major Import Cities, 2013
China’s VSF and VFY Market Prices, May 2008-Apr 2014
Bamboo Fiber Technology Roadmap
Performance Comparison between Bamboo Fiber and Ordinary Viscose Fiber
Lenzing’s Sales and EBITDA, 2008-2013
Lenzing’s Sales Structure by Division, 2008-2013
Sales and EBIT of Lenzing Fiber Division, 2008-2013
Sales Structure of Lenzing Fiber Division by Product, 2011-2013
Sales Structure of Lenzing Fiber Division by Region, 2008-2013
Capacity of Lenzing’s Viscose Fiber Subsidiaries, 2013
Lenzing’s Total Fiber Output and Growth Rate, 2008-2013
Sales Structure of Lenzing Fiber Division by Product, 2009-2013
Revenue and Net Income of Lenzing (Nanjing) Fibers, 2008-2013
Grasim’s Net Revenue and Net Income, FY2008-FY2013
Grasim’s Net Revenue Structure by Product, FY2011-FY2013
Capacity of Grasim’s Main Production Plants, 2013
Grasim’s VSF Output, Sales Volume and Sales-Output Ratio, FY2008-FY2013
Grasim’s VSF Net Revenue and Growth Rate, FY2009-FY2013
Sateri’s Product Chain and Usage
Sateri’s Revenue and Net Income, 2008-2013
Sateri’s Revenue by Product, 2010-2013
Sateri’s Revenue Structure by Product, 2010-2013
Sateri’s Revenue by Region, 2010-2013
Sateri’s Revenue Structure by Region, 2010-2013
Sateri’s Gross Margin of Main Products, 2010-2013
Sateri’s VSF Output, Sales Volume and Sales-Output Ratio, 2010-2013
Sateri’s Average Selling Prices for VSP and DWP, 2010-2013
Capacity of Main Products of CHTC HELON, 2013
Revenue and Net Income of CHTC HELON, 2008-2013
Revenue of CHTC HELON by Product, 2008-2013
Revenue Structure of CHTC HELON by Product, 2008-2013
Revenue of CHTC HELON by Region, 2008-2013
Revenue Structure of CHTC HELON by Region, 2008-2013
Gross Margin of Viscose Fiber Products of CHTC HELON, 2008-2013
Revenue of CHTC HELON from Top 5 Clients and % of Total Revenue, 2008-2013
Name List and Revenue Contribution of Top 5 Clients of CHTC HELON, 2013
Subsidiaries of CHTC HELON, 2013
Revenue and Net Income of CHTC HELON, 2012-2016E
Revenue and Net Income of Aoyang Technology, 2008-2013
VSF Revenue and Growth Rate of Aoyang Technology, 2008-2013
Revenue Structure of Aoyang Technology by Product, 2008-2013
Revenue of Aoyang Technology by Region, 2009-2013
Revenue Structure of Aoyang Technology by Region, 2009-2013
VSF Gross Margin of Aoyang Technology, 2008-2013
Revenue of Aoyang Technology from Top 5 Clients and % of Total Revenue, 2008-2013
Revenue of Aoyang Technology from Top 5 Clients and % of Total Revenue, 2013
Revenue and Net Income of Manasi Aoyang Technology, 2008-2013
Revenue and Net Income of Funing Aoyang Technology, 2008-2013
Revenue and Net Income of Xinao Special Fiber, 2009-2013
Revenue and Net Income of Aoyang Technology, 2012-2016E
Production of Main Products of Xinxiang Chemical Fiber, 2012-2014E
Revenue and Net Income of Xinxiang Chemical Fiber, 2008-2013
Operating Revenue of Xinxiang Chemical Fiber by Product, 2008-2013
Operating Revenue Structure of Xinxiang Chemical Fiber by Product, 2008-2013
Operating Revenue of Xinxiang Chemical Fiber by Region, 2008-2013
Operating Revenue Structure of Xinxiang Chemical Fiber by Region, 2008-2013
Gross Margin of Main Products of Xinxiang Chemical Fiber, 2008-2013
Revenue of Xinxiang Chemical Fiber from Top 5 Clients and % of Total Revenue, 2008-2013
Name List and Revenue Contribution of Top 5 Clients of Xinxiang Chemical Fiber, 2013
VSF and VFY Output of Xinxiang Chemical Fiber, 2008-2013
Xinxiang Chemical Fiber’s Projects under Construction, 2013
Revenue and Net Income of Xinxiang Chemical Fiber, 2012-2016E
Revenue and Net Income of Nanjing Chemical Fiber, 2008-2013
Operating Revenue of Nanjing Chemical Fiber by Product, 2008-2013
Operating Revenue Structure of Nanjing Chemical Fiber by Product, 2008-2013
Operating Revenue of Nanjing Chemical Fiber by Region, 2008-2013
Gross Margin of Viscose Fiber Products of Nanjing Chemical Fiber, 2008-2013
Revenue of Nanjing Chemical Fiber from Top 5 Clients and % of Total Revenue, 2008-2013
Name List and Revenue Contribution of Top 5 Clients of Nanjing Chemical Fiber, 2013
Viscose Fiber Output of Nanjing Chemical Fiber, 2009-2013
Viscose Fiber Sales Volume of Nanjing Chemical Fiber, 2009-2013
Revenue and Net Income of Viscose Fiber Subsidiaries of Nanjing Chemical Fiber, 2013
Revenue and Net Income of Nanjing Chemical Fiber, 2012-2016E
Revenue and Net Income of Jilin Chemical Fibre, 2008-2013
Operating Revenue of Jilin Chemical Fibre by Product, 2010-2013
Operating Revenue Structure of Jilin Chemical Fibre by Product, 2010-2013
Revenue of Jilin Chemical Fibre by Region, 2008-2013
Revenue Structure of Jilin Chemical Fibre by Region, 2008-2013
Gross Margin of Main Products of Jilin Chemical Fibre, 2010-2013
Revenue of Jilin Chemical Fibre from Top 5 Clients and % of Total Revenue, 2009-2013
Name List and Revenue Contribution of Top 5 Clients of Jilin Chemical Fibre, 2013
Capacity of Main Products of Jilin Chemical Fibre, 2013
Operation of Viscose Fiber Subsidiaries of Jilin Chemical Fibre, 2013
Revenue and Net Income of Jilin Chemical Fibre, 2012-2016E
Revenue and Net Income of Swan Fiber, 2008-2013
Revenue of Swan Fiber (by Product), 2008-2013
Revenue Structure of Swan Fiber by Product, 2010-2013
Revenue of Swan Fiber by Region, 2010-2013
Revenue Structure of Swan Fiber by Region, 2010-2013
Gross Margin of Main Products of Swan Fiber, 2008-2013
Revenue of Swan Fiber from Top 5 Clients and % of Total Revenue, 2008-2013
Name List and Revenue Contribution of Top 5 Clients of Swan Fiber, 2013
Capacity of Main Products of Swan Fiber, 2013
VFY Revenue of Swan Fiber, 2008-2013
VFY Revenue Structure of Swan Fiber by Region, 2008-2013
Revenue and Net Income of Swan Fiber, 2012-2016E
Revenue and Net Income of Sanyou Chemical, 2008-2013
Operating Revenue of Sanyou Chemical by Product, 2010-2013
Revenue Structure of Sanyou Chemical by Product, 2010-2013
Revenue of Sanyou Chemical by Region, 2010-2013
Revenue Structure of Sanyou Chemical by Region, 2010-2013
Gross Margin of Main Products of Sanyou Chemical, 2010-2013
Revenue of Sanyou Chemical from Top 5 Clients and % of Total Revenue, 2008-2013
Name List and Revenue Contribution of Top 5 Clients of Sanyou Chemical, 2013
The Subsidiary - XingDa Chemical Fiber, 2013
Revenue and Net Income of XingDa Chemical Fiber, 2008-2013
Revenue and Net Income of Sanyou Chemical, 2012-2016E
Capacity of Main Products of Hubei Golden Ring, 2013
Revenue and Net Income of Hubei Golden Ring, 2008-2013
Revenue of Hubei Golden Ring by Product, 2008-2013
Revenue Structure of Hubei Golden Ring by Product, 2008-2013
Gross Margin of Viscose Fiber Business of Hubei Golden Ring, 2008-2013
Revenue of Hubei Golden Ring from Top 5 Clients and % of Total Revenue, 2008-2013
Name List and Revenue Contribution of Top 5 Clients of Hubei Golden Ring, H1 2013
Revenue and Net Income of Hubei Golden Ring, 2012-2016E
Revenue and Net Income of Fulida, 2009-2010
Operating Revenue and Total Profit of Grace, 2007-2009
Viscose Fiber Capacity of Grace, 2013
Supply and Demand of China Viscose Fiber industry, 2011-2016E
Development of Various Fiber Types in the World, 1960-2020E
Revenue and Growth Rate of Major Viscose Fiber Enterprises in China, 2011-2013
Global and China Synthetic Rubber Industry Report, 2021-2027
Synthetic rubber is a polymer product made of coal, petroleum and natural gas as main raw materials and polymerized with dienes and olefins as monomers, which is typically divided into general synthet...
Global and China Carbon Fiber Industry Report, 2021-2026
Carbon fiber is a kind of inorganic high performance fiber (with carbon content higher than 90%) converted from organic fiber through heat treatment. As a new material with good mechanical properties,...
China Coal Tar Industry Report, 2020-2025
Coal tar is a thick dark liquid which is a by-product of the production of coke and coal gas from coal. It can be classified by the dry distillation temperature into low-temperature coal tar, medium-t...
Global and China Dissolving Pulp Industry Report, 2019-2025
In 2018, global dissolving pulp capacity outstripped 10 million tons and its output surged by 14.0% from a year ago to 7.07 million tons, roughly 70% of the capacity. China, as a key supplier of disso...
Global and China 1, 4-butanediol (BDO) Industry Report, 2019-2025
1,4-butanediol (BDO), an essential organic and fine chemical material, finds wide application in pharmaceuticals, chemicals, textile and household chemicals.
As of the end of 2018, the global BDO cap...
Global and China Carbon Fiber and CFRP Industry Report, 2019-2025
Among the world’s three major high performance fibers, carbon fiber features the highest strength and the highest specific modulus. It is widely used in such fields as aerospace, sports and leisure.
...
Global and China Natural Rubber Industry Report, 2019-2025
In 2018, global natural rubber industry continued remained at low ebb, as a result of economic fundamentals. Global natural rubber price presented a choppy downtrend and repeatedly hit a record low in...
Global and China Ultra High Molecular Weight Polyethylene (UHMWPE) Industry Report, 2019-2025
Ultra high molecular weight polyethylene (UHMWPE), a kind of linear polyethylene with relative molecular weight of above 1.5 million used as an engineering thermoplastic with excellent comprehensive p...
China Polyether Monomer Industry Report, 2019-2025
China has seen real estate boom and issued a raft of policies for continuous efforts in improving weak links in infrastructure sector over the years. Financial funds of RMB1,663.2 billion should be al...
Global and China Needle Coke Industry Report, 2019-2025
Needle coke with merits of good orientation and excellent conductivity and thermal conductivity, is mainly used in graphite electrodes for electric steelmaking and lithium battery anode materials.
A...
Global and China Viscose Fiber Industry Report, 2019-2025
Over the recent years, the developed countries like the United States, Japan and EU members have withdrawn from the viscose fiber industry due to environmental factor and so forth, while the viscose f...
China Coal Tar Industry Report: Upstream (Coal, coke), Downstream (Phenol Oil, Industrial Naphthalene, Coal Tar Pitch), 2019-2025
Coal tar is a key product in coking sector. In 2018, China produced around 20 million tons of coal tar, a YoY drop of 2.4% largely due to a lower operating rate of coal tar producers that had to be su...
Global and China Synthetic Rubber (BR, SBR, EPR, IIR, NBR, Butadiene, Styrene, Rubber Additive) Industry Report, 2018-2023
In 2018, China boasted a total synthetic rubber capacity of roughly 6,667kt/a, including 130kt/a new effective capacity. Considering capacity adjustment, China’s capacity of seven synthetic rubbers (B...
Global and China Dissolving Pulp Industry Report, 2018-2022
With the commissioning of new dissolving pulp projects, the global dissolving pulp capacity had been up to about 8,000 kt by the end of 2017. It is worth noticing that the top six producers including ...
Global and China Carbon Fiber and CFRP Industry Report, 2018-2022
As a new generation of reinforced fiber boasting intrinsic properties of carbon material and excellent processability of textile fiber, carbon fiber is the one with the highest specific strength and s...
Global and China Ultra High Molecular Weight Polyethylene (UHMWPE) Industry Report, 2017-2021
Ultra High Molecular Weight Polyethylene (UHMWPE), a kind of linear polyethylene with relative molecular weight of above 1.5 million and an engineering thermoplastic with excellent comprehensive prope...
China Coal Tar Industry Report, 2017-2021
Coal tar, one of by-products in raw coal gas generated from coal pyrolysis in coking industry, accounts for 3%-4% of the output of coal as fired and is a main raw material in coal chemical industry.
...
Global and China Aramid Fiber Industry Report, 2017-2021
Global aramid fiber output totaled 115kt with capacity utilization of 76.0% in 2016. As industries like environmental protection and military develop, the output is expected to rise to 138kt and capac...