China Coal Tar Industry Report: Upstream (Coal, coke), Downstream (Phenol Oil, Industrial Naphthalene, Coal Tar Pitch), 2019-2025
-
Jan.2019
- Hard Copy
- USD
$3,200
-
- Pages:150
- Single User License
(PDF Unprintable)
- USD
$3,000
-
- Code:
ZHP084
- Enterprise-wide License
(PDF Printable & Editable)
- USD
$4,500
-
- Hard Copy + Single User License
- USD
$3,400
-
Coal tar is a key product in coking sector. In 2018, China produced around 20 million tons of coal tar, a YoY drop of 2.4% largely due to a lower operating rate of coal tar producers that had to be subject to the environmental policy. Coal tar output will still edge down by an estimated 0.5% in 2019 when capacity optimization and production curtailment persist in the industry. Yet as capacity gets upgraded and demand increases, coal tar output will pick up in future, expectedly to more than 22 million tons in 2025.
Segment: of China’s coal tar products, over 70% are high-temperature coal tar, a by-product from coke production. High-temperature coal tar output is predicted to approximate 16.8 million tons in 2025, compared with 15 million in 2018. Curbing production in China has brought about short supply of such product (apparent consumption ranged at 20 million tons in 2018) and a capacity utilization rate of less than 70%. Medium temperature coal tar whose output reached a mere 3.86 million tons in 2018 saw an even lower capacity utilization rate of below 30%.
Price: China’s coal tar price showed a upward mobility from 2016 to 2018, hovering at RMB3,000-4,000 per ton in 2018. The price hike resulted from tight supply. There is little possibility of a drop in coal tar price in the next two years as environmental protection campaigns which started in 2018 will last to 2020, but the price will rise at a limited rate for higher price has made downstream producers unprofitable.
Application: over 55% coal tar is utilized in deep-processing field where most players, however, have gone into the red due to coal tar price increase, thus demanding less. The demand from deep-processing domain for coal tar stood at roughly 9.6 million tons in 2018, down 7.7% from a year earlier, but is predicted to rise a bit in 2019 as part of new deep-processing capacity becomes operational. Carbon black driven by the growing tire market in recent two years generates the rising demand for coal tar, expectedly needing more than 6 million tons in 2019.
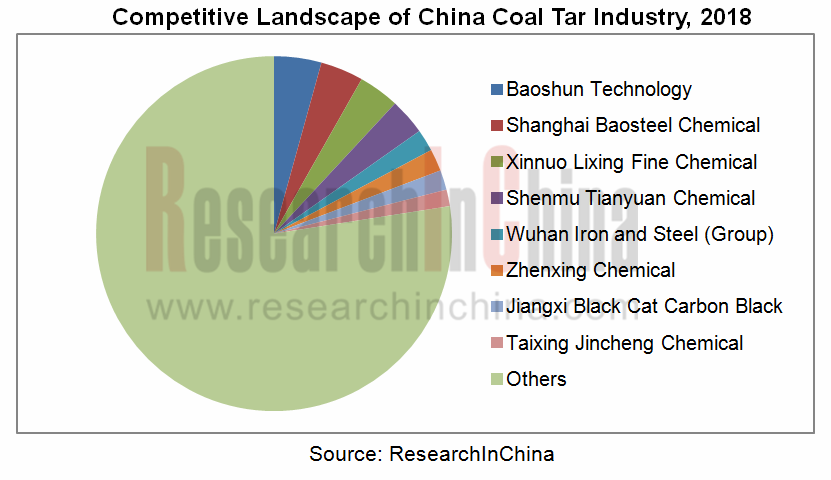
Coal tar and deep-processing industry features low concentration and scattered capacity with CR10 being less than 30% in China. Baoshun Technology as the coal tar deep-processing enterprise boasting largest production capacity in China, seized a market share of just 4.3% in 2018. The capacity optimization of coal tar makes for a higher concentration of the industry.
The report highlights the following:
 Coal Tar (definition, classification, application, industrial chain, etc.);
Coal Tar (development environment, market size, market structure, import & export, market price, development tendency, etc.);
Upstream coal and coke (market size, market structure, market price, import & export, etc.);
Downstream deep-processing market size, imports & exports, market price, etc.;
Coal tar industry patterns by regions and competition among enterprises, etc.;
Three foreign and twelve Chinese coal tar and deep-processing enterprises (operation, coal tar business, etc.)
1. Overview of Coal Tar
1.1 Definition & Classification
1.2 Preparation
1.3 Application
1.4 Key Technologies
1.4.1 Coal Tar Distillation
1.4.2 Industrial Naphthalene Distillation
1.4.3 Elution of Fraction from Coal tar Distillation
1.4.4 Refining of Crude Anthracene
1.4.5 Decomposition of Hydroxybenzene Natrium Salt
1.4.6 Preparation of Naphthalene
1.4.7 Refining of Crude Hydroxybenzene
1.4.8 Refining of Crude Pyridine and Crude Quinoline
1.4.9 Production of Refined Anthracene, Refined Carbazole and Anthraquinone
1.5 Industry Chain
2. Development Environment for China Coal Tar Industry
2.1 Development Environment
2.2 Supply
2.2.1 High Temperature Coal Tar
2.2.2 Medium Temperature Coal Tar
2.2.3 Low Temperature Coal Tar
2.3 Demand
2.3.1 Demand from Deep Processing
2.3.2 Demand from Carbon Black
2.3.3 Demand from Fuel
2.4 Import and Export
2.4.1 Export
2.4.2 Import
2.5 Market Price
2.5.1 High-temperature Coal Tar
2.5.2 Medium-temperature Coal Tar
2.5.3 Low-temperature Coal Tar
2.6 Development Trends
3 Upstream Sectors of Coal Tar in China
3.1 Coal Industry
3.1.1 Market Size
3.1.2 Structure
3.1.3 Price
3.1.4 Import & Export
3.2 Coke Industry
3.2.1 Supply and Demand
3.2.2 Import & Export
3.2.3 Price
4 Downstream Deep-processing Sectors of Coal Tar in China
4.1 Phenol Oil
4.1.1 Phenol
4.1.2 O-cresol
4.1.3 M-cresol and P-cresol
4.1.4 Mixed Cresol
4.2 Industrial Naphthalene
4.2.1 Production
4.2.2 Consumption
4.2.3 Import and Export
4.2.4 Price
4.3 Coal Tar Pitch
4.3.1 Supply and Demand
4.3.2 Application Market
4.3.3 Price Trend
4.4 Others
4.4.1 Anthracene Oil
4.4.2 Light Oil
4.4.3 Wash Oil
5. Coal Tar Industry Competition in China
5.1 Regional Competition
5.1.1 Shanxi
5.1.2 Hebei
5.1.3 Shandong
5.2 Enterprise Competition
5.3 Product Competition
6. Major Global Coal Tar Companies
6.1 Koppers
6.1.1 Profile
6.1.2 Operation
6.1.3 Operation of Carbon Materials & Chemicals Segment
6.1.4 Business in China
6.1.5 Development Strategy
6.2 RüTGERS Group
6.2.1 Profile
6.2.2 Operation
6.3 Nippon Steel & Sumikin Chemical Co. Ltd
6.3.1 Profile
6.3.2 Operation
7. Major Chinese Coal Tar Companies
7.1 Shanxi Coking Group Co., Ltd.
7.1.1 Profile
7.1.2 Operation
7.1.3 Project Investment
7.2 Shanxi Hongte Coal Chemical Industry Co., Ltd.
7.2.1 Profile
7.2.2 Capacity Expansion
7.3 Shanghai Baosteel Chemical Co., Ltd
7.3.1 Profile
7.3.2 Operation
7.3.3 Key Projects
7.4 Baoshun Technology Co., Ltd.
7.4.1 Profile
7.4.2 Operation
7.4.3 Coal Tar Business
7.5 Wuhan Iron and Steel (Group) Corp.
7.5.1 Profile
7.5.2 Operation
7.5.3 Coal Tar Business
7.6 Jiangxi Black Cat Carbon Black Inc., Ltd.
7.6.1 Profile
7.6.2 Operation
7.6.3 Coal Tar Business
7.7 Guanghui Energy Co., Ltd.
7.7.1 Profile
7.7.2 Operation
7.7.3 Coal Tar Business
7.8 Huanghua Xinnuolixing Fine Chemical Stock Company Limited
7.8.1 Profile
7.8.2 Operation
7.8.3 Key Projects
7.9 Shenmu Tianyuan Chemical Co., Ltd.
7.9.1 Profile
7.9.2 Coal Tar Business
7.10 JFE Zhenxing Shandong Chemical Company Ltd
7.10.1 Profile
7.10.2 Capacity
7.11 Shanxi Yongdong Chemistry Industry Co., Ltd.
7.11.1 Profile
7.11.2 Operation
7.11.3 Coal Tar Business
7.12 Baotailong New Materials Co., Ltd.
7.12.1 Profile
7.12.2 Operation
7.12.3 Coal Tar Business
Classification of Coal Tar
Main Products Extracted from High-temperature Coal Tar and Their Applications
Coal Tar Industry Chain
Development History of Chinese Coking Industry
SWOT Analysis of Chinese Coking Industry
Policies on Coal Chemical Industry in China
Coal Tar Output and Growth Rate in China, 2013-2025E
Coal Tar Output Structure in China by Product, 2018
High Temperature Coal Tar Capacity and YoY Growth in China, 2010-2025E
High Temperature Coal Tar Output and YoY Growth in China, 2014-2025E
Capacity Utilization of High Temperature Coal Tar in China, 2014-2019
High Temperature Coal Tar Production Concentrates in North China and East China.
Main Sources of Medium Temperature Coal Tar in China, 2017
Medium Temperature Coal Tar Output in China, 2013-2025E
Capacity Utilization of Medium Temperature Coal Tar in China, 2015-2019E
Capacity Structure of Medium Temperature Coal Tar (by Region) in China, 2018
Apparent Consumption of Coal Tar in China, 2013-2025E
High Temperature Coal Tar Demand in China, 2015-2025E
Consumption Structure of Coal Tar in China, 2018
Amount of Coal Tar Processed in China, 2010-2019E
Carbon Black Output in China, 2010-2019E
Demand from Carbon Black Industry for Coal Tar in China, 2014-2019E
China’s Coal Tar Export Tariff, 2017-2019
China’s Coal Tar Export Volume, 2007-2019E
China’s Coal Tar Import Volume, 2007-2019E
Price Trend of Coal Tar in North China, 2009-2016
Price Trend of Coal Tar in China, 2016-2018
Price of High Temperature Coal Tar in China, 2014-2016
Price of High Temperature Coal Tar in China, 2017
Price of High Temperature Coal Tar in China, 2018
Price of Medium Temperature Coal Tar in China, 2018-2019E
Average Price of Low Temperature Coal Tar in China, 2016-2018
Distribution of Anthracite Reserves in China
Anthracite Output and YoY Change in China, 2009-2019E
Apparent Consumption of Anthracite in China, 2009-2019E
Anthracite Output Structure (by Region) in China, 2017
Growth Rates for Average Price of Anthracite in China, 2016-2017
Price Trend of Anthracite (Medium-sized) in China, 2017-2018
China’s Anthracite Imports, 2009-2018
China’s Anthracite Exports, 2009-2018
Coke Capacity and Output in China, 2009-2019E
China’s Carbocoal Output, 2015-2019E
Coke Output Structure in China by Province, 2018
China’s Coke Apparent Consumption, 2009-2025E
Coke Demand Structure in China by Sector, 2018
China’s Coke Import and Export Volume, 2007-2018
Import and Export Prices of Coke in China, 2009-2018
Price Trend of Coke in China, 2017-2018
Coke Price Index in China, 2017-2018
Global Coal Tar Deep Processing Capacity Structure by Region, 2018
China’s Coal Tar Processing Capacity, 2009-2025E
Coal Tar Deep Processing Capacity Structure in China by Region, 2018
Capacity of Major Coal Tar Deep Processing Companies in China, 2018
Coal Tar Deep-processing Capacity under Construction in China, 2019E
Internationally Famous Coal Tar Deep Processing Techniques and Their Characteristics
Coal Tar Processing Procedure in China
Average Market Price of Major Coking Products in China, 2018
Phenol Capacity in China, 2010-2025E
Phenol Producers and Their Capacities in China, 2018
Operating Rate of Phenol Installations in China, 2016-2018
Phenol Output in China, 2017-2018
China’s Phenol Export & Import Volume, 2009-2018
Average Import and Export Price of Phenol in China, 2009-2018
China’s O-cresol Import and Export Volume, 2009-2017
Average Import and Export Price of O-cresol in China, 2009-2017
Monthly Import Volume and Average Price of M-cresol in China, 2014-2018
Monthly Export Volume and Average Price of M-cresol in China, 2014-2018
China’s Industrial Naphthalene Output, 2010-2025E
China’s Consumption Structure of Industrial Naphthalene, 2018
China’s Industrial Naphthalene Import and Export Volume, 2009-2019E
Average Import and Export Price of Industrial Naphthalene in China, 2009-2018
Price Trend of Industrial Naphthalene in North China, 2009-2016
Price of Industrial Naphthalene in China, 2017-2018
Monthly Output of Coal Tar Pitch in China, 2015-2025E
China’s Coal Tar Pitch Import and Export Volume, 2009-2019E
Average Import Price of Coal Tar Pitch in China, 2018
Coal Tar Pitch Demand Structure in China, 2018
Price Trend of Modified Coal Tar Pitch in China, 2017-2018
Price Trend of Anthracene Oil in China, 2013-2017
Price Trend of Anthracene Oil in China, 2017
Price Trend of Wash Oil in China, 2018
Geographical Distribution of Coal Tar Output in China, 2013-2016
Coke Oven Capacity Distribution in Shanxi Province
Capacity Distribution of High Temperature Coal Coke in Shanxi Province
Capacity Structure of High Temperature Coal Tar (by Region) in Shanxi Province, 2018
Coal Tar Output and Growth Rate in Shanxi Province, 2012-2025E
Capacity of Main Coal Tar Deep-processing Companies in Shanxi, 2018
New Coal Tar Deep Processing Capacity in Shanxi Province, 2010-2020E
Shanxi’s Coal Tar Deep Processing Projects, 2018
Development Goal of Shanxi Province’s Coking Industry, 2020E
Coal Tar Output and Growth Rate in Hebei Province, 2012-2025E
Capacity of Main Coal Tar Deep-processing Companies in Hebei, 2018
Coal Tar Output and Growth Rate in Shandong Province, 2012-2025E
Capacity of Main Coal Tar Deep-processing Companies in Shandong, 2018
Capacity of Main Coal Tar Deep-processing Companies in China, 2018
Competitive Landscape of Chinese Coal Tar Market, 2018
Statistics on Capacity and Products of Global Coal Tar Companies, 2018
Presence of Koppers’ Production Bases
Carbon Materials and Chemicals of Koppers
Net Sales and Net Income of Koppers, 2010-2018
Net Sales Structure (%) of Koppers by Division, 2012-2018
Net Sales Structure (%) of Koppers by Region, 2012-2017
Application Structure of Koppers’ Products, 2017
Koppers’ Coal Tar Processing Technology
Net Sales and Operating Income of Koppers’ Carbon Materials & Chemicals Division, 2010-2018
Distribution of Production Bases of Koppers’ Carbon Materials & Chemicals Division
Revenue Structure (by Product) of Koppers’ Carbon Materials & Chemicals Division, 2011-2017
Investment Strategy of Koppers
Development Strategy of Koppers
Subsidiaries and Capacity of Rutgers
Profile of Rutgers
Net Sales and Net Income of Nippon Steel & Sumikin Chemical, FY2009-FY2017
Major Products of Nippon Steel & Sumikin Chemical
Revenue and Net Income of Shanxi Coking Group, 2010-2018
Output (by Product) of Shanxi Coking Group, 2013-2017
Sales Volume (by Product) of Shanxi Coking Group, 2013-2017
Revenue Structure (by Product) of Shanxi Coking Group, 2012-2017
Capacity and Capacity Utilization of Shanxi Coking Group’s Main Products, 2017
Gross Margin (by Product) of Shanxi Coking Group, 2010-2017
Sales of Shanghai Baosteel Chemical, 2007-2018
Development Course of Shanghai Baosteel Chemical
Industrial Layout of Baoshun Technology
Revenue of Henan Baoshun Technology Technology, 2011-2018
Production Bases and Product Capacity of Henan Baoshun Chemical Technology, 2018
Revenue and Net Income of Wuhan Iron and Steel (Group), 2010-2018
Revenue and Net Income of Jiangxi Black Cat Carbon Black, 2010-2018
Revenue Structure (by Product) of Jiangxi Black Cat Carbon Black, 2012-2018
Revenue Structure (by Region) of Jiangxi Black Cat Carbon Black, 2012-2018
Gross Margin (by Product) of Jiangxi Black Cat Carbon Black, 2010-2018
Output and Sales Volume of Refined Coal Tar Products of Jiangxi Black Cat Carbon Black, 2015-2018
Revenue and Net Income of Guanghui Energy, 2010-2018
Revenue and Net Income of Huanghua Xinnuolixing Fine Chemical, 2013-2017
Revenue Structure (by Region) of Huanghua Xinnuolixing Fine Chemical, 2013-2016
Coal Tar Products of Shenmu Tianyuan Chemical
Revenue and Net Income of Shanxi Yongdong Chemistry Industry, 2012-2018
Revenue Structure (by Product) of Shanxi Yongdong Chemistry Industry, 2013-2018
Revenue Structure (by Region) of Shanxi Yongdong Chemistry Industry, 2013-2018
Gross Margin of Main Products of Shanxi Yongdong Chemistry Industry, 2012-2018
Output and Sales Volume of Coal Tar Deep-processed Products of Shanxi Yongdong Chemistry Industry, 2012-2017
Revenue and Net Income of Qitaihe Baotailong Coal & Coal Chemicals Public, 2011-2018
Price Trend of Refined Wash Oil Produced by Baotailong New Materials, 2017
Price Trend of Refined Wash Oil Produced by Baotailong New Materials, 2018
Capacity of Main Products of Qitaihe Baotailong Coal & Coal Chemicals Public, 2017
Baotailong New Materials’ Revenue from Refined Wash Oil Related Business, 2015-2017
Global and China Synthetic Rubber Industry Report, 2021-2027
Synthetic rubber is a polymer product made of coal, petroleum and natural gas as main raw materials and polymerized with dienes and olefins as monomers, which is typically divided into general synthet...
Global and China Carbon Fiber Industry Report, 2021-2026
Carbon fiber is a kind of inorganic high performance fiber (with carbon content higher than 90%) converted from organic fiber through heat treatment. As a new material with good mechanical properties,...
China Coal Tar Industry Report, 2020-2025
Coal tar is a thick dark liquid which is a by-product of the production of coke and coal gas from coal. It can be classified by the dry distillation temperature into low-temperature coal tar, medium-t...
Global and China Dissolving Pulp Industry Report, 2019-2025
In 2018, global dissolving pulp capacity outstripped 10 million tons and its output surged by 14.0% from a year ago to 7.07 million tons, roughly 70% of the capacity. China, as a key supplier of disso...
Global and China 1, 4-butanediol (BDO) Industry Report, 2019-2025
1,4-butanediol (BDO), an essential organic and fine chemical material, finds wide application in pharmaceuticals, chemicals, textile and household chemicals.
As of the end of 2018, the global BDO cap...
Global and China Carbon Fiber and CFRP Industry Report, 2019-2025
Among the world’s three major high performance fibers, carbon fiber features the highest strength and the highest specific modulus. It is widely used in such fields as aerospace, sports and leisure.
...
Global and China Natural Rubber Industry Report, 2019-2025
In 2018, global natural rubber industry continued remained at low ebb, as a result of economic fundamentals. Global natural rubber price presented a choppy downtrend and repeatedly hit a record low in...
Global and China Ultra High Molecular Weight Polyethylene (UHMWPE) Industry Report, 2019-2025
Ultra high molecular weight polyethylene (UHMWPE), a kind of linear polyethylene with relative molecular weight of above 1.5 million used as an engineering thermoplastic with excellent comprehensive p...
China Polyether Monomer Industry Report, 2019-2025
China has seen real estate boom and issued a raft of policies for continuous efforts in improving weak links in infrastructure sector over the years. Financial funds of RMB1,663.2 billion should be al...
Global and China Needle Coke Industry Report, 2019-2025
Needle coke with merits of good orientation and excellent conductivity and thermal conductivity, is mainly used in graphite electrodes for electric steelmaking and lithium battery anode materials.
A...
Global and China Viscose Fiber Industry Report, 2019-2025
Over the recent years, the developed countries like the United States, Japan and EU members have withdrawn from the viscose fiber industry due to environmental factor and so forth, while the viscose f...
China Coal Tar Industry Report: Upstream (Coal, coke), Downstream (Phenol Oil, Industrial Naphthalene, Coal Tar Pitch), 2019-2025
Coal tar is a key product in coking sector. In 2018, China produced around 20 million tons of coal tar, a YoY drop of 2.4% largely due to a lower operating rate of coal tar producers that had to be su...
Global and China Synthetic Rubber (BR, SBR, EPR, IIR, NBR, Butadiene, Styrene, Rubber Additive) Industry Report, 2018-2023
In 2018, China boasted a total synthetic rubber capacity of roughly 6,667kt/a, including 130kt/a new effective capacity. Considering capacity adjustment, China’s capacity of seven synthetic rubbers (B...
Global and China Dissolving Pulp Industry Report, 2018-2022
With the commissioning of new dissolving pulp projects, the global dissolving pulp capacity had been up to about 8,000 kt by the end of 2017. It is worth noticing that the top six producers including ...
Global and China Carbon Fiber and CFRP Industry Report, 2018-2022
As a new generation of reinforced fiber boasting intrinsic properties of carbon material and excellent processability of textile fiber, carbon fiber is the one with the highest specific strength and s...
Global and China Ultra High Molecular Weight Polyethylene (UHMWPE) Industry Report, 2017-2021
Ultra High Molecular Weight Polyethylene (UHMWPE), a kind of linear polyethylene with relative molecular weight of above 1.5 million and an engineering thermoplastic with excellent comprehensive prope...
China Coal Tar Industry Report, 2017-2021
Coal tar, one of by-products in raw coal gas generated from coal pyrolysis in coking industry, accounts for 3%-4% of the output of coal as fired and is a main raw material in coal chemical industry.
...
Global and China Aramid Fiber Industry Report, 2017-2021
Global aramid fiber output totaled 115kt with capacity utilization of 76.0% in 2016. As industries like environmental protection and military develop, the output is expected to rise to 138kt and capac...