China Engineering Adhesive Industry Report, 2015-2018
-
Aug.2015
- Hard Copy
- USD
$2,600
-
- Pages:120
- Single User License
(PDF Unprintable)
- USD
$2,400
-
- Code:
ZYM067
- Enterprise-wide License
(PDF Printable & Editable)
- USD
$3,700
-
- Hard Copy + Single User License
- USD
$2,800
-
It is over the recent years that China's engineering adhesive market has seen rapid development, with a CAGR of 20.6% during 2009-2014. In 2014, the output of engineering adhesives in China totaled approximately 711,000 tons, up 20.7% from a year ago. Moreover, in automobiles, wind power, high-speed rail, and other high-end fields in which adhesives are used, China-made engineering adhesives have partially substituted for imports.
In China, the demand for silicone adhesive, epoxy resin adhesive, and polyurethane adhesive is the largest, and accounted for 45.1%, 30.3%, and 15.9%, respectively, in 2014. However, other small adhesive varieties including anaerobic adhesive, though occupying a small market share, have high prices and handsome gross margins. In 2014, China’s output of anaerobic adhesive totaled only 3,850 tons, but with the average ex-factory price of RMB100,000/ton. Even the products from the manufacturers like Huitian Adhesive and Tonsan Adhesive are priced at more than RMB150,000 /ton.
With a full range of product varieties and advanced technologies, the global well-known adhesive manufacturers such as H.B. FULLER, Henkel, 3M, Sika, and ITW have held the larger portion of the engineering adhesive market in China. What’s more, these players are still increasing investments in China to sweep more market shares.
In 2013, Henkel established in Shanghai the world's largest industrial adhesive plant with an annual capacity of 428,000 tons, a plant that is positioned to satisfy the demand for adhesives used in automobiles and consumer goods in Asia. At the end of June 2014, H.B. FULLER announced to acquire a 95% stake in Tonsan Adhesive for RMB1.4 billion (USD230 million) in cash. In early 2015, the acquisition was approved by the Chinese government.
The Chinese engineering adhesive enterprises were mostly founded in the 1980s-1990s. These enterprises, which started very late, develop very fast and can compete with foreign counterparts in some market segments. They consist mainly of Hubei Huitian Adhesive Enterprise, Kangda New Material, Chengdu Guibao Science & Technology, Comens New Materials, Zhijiang Silicone, and Guangzhou Xiinzhan, among others.
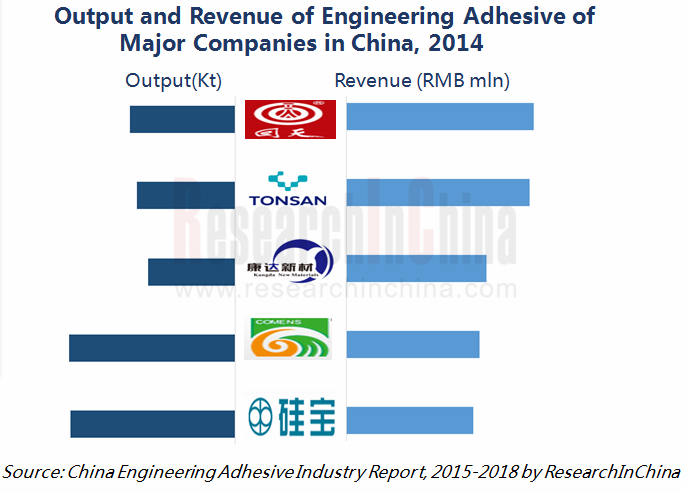
As an important supplier of engineering adhesive in China, Hubei Huitian Adhesive Enterprise applies its products in the fields of automobile and renewable energy. In 2014, its output and sales volume of engineering adhesives exceeded 20,000 tons, which generated revenue of RMB634.7 million. Among them, silicone adhesive and polyurethane adhesive accounted for a combined 82.8% share of total revenue. In addition, the company increased the projects of 10kt/a silicone adhesive and 10kt/a polyurethane adhesive in 2015.
Kangda New Materials mainly produces epoxy structural adhesive. In 2014, the company produced and sold around 16,000 tons of adhesive and realized revenue of RMB527.2 million, of which epoxy structural adhesive represented 70.0%. On March 20, 2015, the company finished construction of the project with raised funds for epoxy structural adhesive and so forth. The company is now working to apply for trial production, and it is expected to partially yield benefits in 2015.
China Engineering Adhesive Industry Report, 2015-2018 by ResearchInChina highlights the followings:
 Development status, demand and supply, competitive landscape, and development prediction of China’s Engineering Adhesive industry;
Current situation, competitive landscape, and development forecast of China’s engineering adhesive market segments, including silicone adhesive, polyurethane adhesive, epoxy adhesive, and acrylate adhesive;
Operation, adhesive business, and development prospects of 11 overseas and 10 Chinese engineering adhesives enterprises.
1. Overview of Engineering Adhesive
1.1 Definition and Classification of Adhesives
1.2 Definition and Classification of Engineering Adhesive
2. Global and China Engineering Adhesive Market
2.1 Operating Environment
2.1.1 Market Environment Worldwide
2.1.2 Policy Climate in China
2.2 Overall Status Quo
2.3 Demand & Supply
2.3.1 Global
2.3.2 China
2.3.3 Market Demand
2.4 Competitive Landscape
2.5 Downstream Demand for Engineering Adhesives
2.5.1 Construction
2.5.2 Automobile
2.5.3 Wind Power and PV
2.5.4 Electrical & Electronics
2.5.5 Other Fields
2.6 Development Prospects
3. Chinese Engineering Adhesive Market Segments
3.1 Organic Silicone Structural Adhesive
3.2 Epoxy Structural Adhesive
3.3 PU Structural Adhesives
3.4 Acrylate Structural Adhesive and Others
4. Major Global Suppliers
4.1 H.B. FULLER
4.1.1 Profile
4.1.2 Operation
4.1.3 Revenue Structure
4.1.4 Gross Margin
4.1.5 R&D and Investment
4.1.6 Development in China
4.2 HENKEL
4.2.1 Profile
4.2.2 Operation
4.2.3 Revenue Structure
4.2.4 Gross Margin
4.2.5 R&D and Investment
4.2.6 Adhesive
4.2.7 Development in China
4.3 THREEBOND
4.3.1 Profile
4.3.2 Operation
4.3.3 Development in China
4.4 3M
4.4.1 Profile
4.4.2 Operation
4.4.3 Revenue Structure
4.4.4 R&D and Investment
4.4.5 Development in China
4.5 ITW
4.5.1 Profile
4.5.2 Operation
4.5.3 Revenue Structure
4.5.4 R&D
4.5.5 Development in China
4.6 SIKA
4.6.1 Profile
4.6.2 Operation
4.6.3 Revenue Structure
4.6.5 R&D and Investment
4.6.6 Development in China
4.7 CYTEC INDUSTRIES
4.7.1 Profile
4.7.2 Operation
4.7.3 Revenue Structure
4.7.4 Gross Margin
4.7.5 Investment
4.7.6 Development in China
4.8 MOMENTIVE
4.8.1 Profile
4.8.2 MSC
4.8.3 MPM
4.8.4 Development in China
4.9 DOW CORNING
4.9.1 Profile
4.9.2 Operation
4.9.3 Development in China
4.10 ASHLAND
4.10.1 Profile
4.10.2 Operation
4.10.3 Adhesive
4.10.4 Development in China
4.11 Tex Year Industries Inc.
4.11.1 Profile
4.11.2 Operation
4.11.3 Revenue Structure
4.11.4 Gross Margin
4.11.5 R&D
4.11.6 Adhesive
4.11.7 Business in China
5. Major Suppliers in Mainland China
5.1 Hubei Huitian Adhesive Enterprise Co., Ltd.
5.1.1 Profile
5.1.2 Operation
5.1.3 Revenue Structure
5.1.4 Gross Margin
5.1.5 R&D and Investment
5.1.6 Clients and Suppliers
5.1.7 Development Prediction
5.2 Shanghai Kangda New Materials Co., Ltd.
5.2.1 Profile
5.2.2 Operation
5.2.3 Revenue Structure
5.2.4 Gross Margin
5.2.5 R&D and Investment
5.2.6 Clients and Suppliers
5.2.7 Development Prediction
5.3 Chengdu Guibao Science & Technology Co., Ltd.
5.3.1 Profile
5.3.2 Operation
5.3.3 Revenue Structure
5.3.4 Gross Margin
5.3.5 R&D and Investment
5.3.6 Clients and Suppliers
5.3.7 Development Prediction
5.4 Beijing Comens New Materials Co., Ltd.
5.4.1 Profile
5.4.2 Operation
5.4.3 Revenue Structure
5.4.4 Gross Margin
5.4.5 R&D and Investment
5.4.6 Clients and Suppliers
5.4.7 Development Prediction
5.5 Tonsan Adhesive, Inc.
5.5.1 Profile
5.5.2 Operation
5.5.3 Development Prospects
5.6 Shandong North Modern Chemistry Industry Co., Ltd.
5.6.1 Profile
5.6.2 Adhesive Manufacturers
5.7 Guangzhou Baiyun Chemical Industry Co., Ltd.
5.7.1 Profile
5.7.2 Operation
5.7.3 R&D
5.8 Hangzhou Zhijiang Silicone Chemicals Co., Ltd.
5.8.1 Profile
5.8.2 Operation
5.9 Guangzhou Xinzhan Silicone Co., Ltd.
5.9.1 Profile
5.10 Dongguan Pustar Adhesives & Sealants Co., Ltd.
5.10.1 Profile
5.10.2 Development
6. Conclusion and Forecast
6.1 Enterprise
6.2 Market
Definition and Classification of Adhesives
Classification and Application of Engineering Adhesives
Engineering Adhesive Industry Chain
Major Policies on Engineering Adhesive in China, 2006-2014
Adhesive Output and YoY Growth in China, 2003-2014
Adhesive Revenue and YoY Growth in China, 2003-2014
Global Adhesive and Sealant Market Volume, 2014
Global Adhesive Market Structure by Chemical Composition, 2014
Global Adhesive Market Structure by Application, 2014
Output and YoY Growth of Engineering Adhesives in China, 2009-2018E
Output of Engineering Adhesives in China by Chemical Composition, 2014
Market Structure of Engineering Adhesives in China by Application, 2014
New Housing Starts, Floor Space under Construction, and Completed Floor Space of Houses in China, 2007-2014
Output of Automobiles in China, 2005-2018E
Added Installed Capacity of Wind Power in China and Worldwide, 2007-2014
Installed Solar PV Capacity in China and Worldwide, 2007-2014
Revenue of China Electronic Information Industry, 2010-2014
Output and YoY Growth of Organic Silicone Adhesives in China, 2008-2018E
China’s Organic Silicone Adhesive Projects Proposed/under Construction, 2015
Output and YoY Growth of Epoxy Resin Adhesives in China, 2008-2018E
Output and YoY Growth of Polyurethane Adhesives in China, 2008-2018E
Output of Other Structural Adhesives in China, 2008-2018E
Competitive Landscape of Anaerobic Adhesive Enterprises in China by Output, 2014
Average Ex-factory Price for Products of Major Anaerobic Adhesive Enterprises in China, 2014
Distribution of H.B. Fuller’s Plants Worldwide, 2014
Revenue and EBITDA of H.B. Fuller, FY2009-FY2015
Revenue of H.B. Fuller by Business, FY2012-FY2015
Gross Margin of H.B. Fuller, 2008-2015
H.B. Fuller’s R&D Costs and % of Total Revenue, 2008-2014
Revenue and Net Income of Henkel, 2008-2015
Henkel’s Revenue Structure by Business, 2010-2015
Henkel’s Revenue Structure by Region, 2010-2015
Henkel’s Gross Margin, 2009-2015
Henkel’s R&D Costs and % of Total Revenue, 2009-2015
Revenue and YoY Growth of Henkel’s Adhesive Technical Service, 2009-2015
Threebond’s Revenue, 2001-2013
Revenue Structure of Threebond by Product, 2013
Revenue and Net Income of 3M, 2008-2015
3M’s Revenue and Operating Income by Sector, 2011-2014
3M’s Revenue and Operating Income by Region, 2011-2013
3M’s R&D Costs and % of Total Revenue, 2009-2015
3M’s Offices in China
ITW’s Revenue and Operating Income, 2008-2015
ITW’s Revenue by Business, 2011-2015
ITW’s Revenue by Region, 2012-2015
ITW’s R&D Costs and % of Total Revenue, 2008-2014
Sika’s Revenue and Net Income, 2008-2014
Sika’s Revenue Structure by Application, 2009-2014
Sika’s Revenue Structure by Region, 2014
Sika’s R&D Costs and % of Total Revenue, 2008-2014
Sika’s Subsidiaries in China as of the End of 2014
Revenue and Net Income of Cytec Industries, 2008-2015
Revenue Structure of Cytec Industries by Application, 2011-2015
Revenue Structure of Cytec Industries by Region, 2011-2014
Gross Margin of Cytec Industries, 2008-2014
MSC’s Revenue and Net Income, 2008-2014
MSC’s Revenue by Product, 2013
MPM’s Revenue and Net Income, 2008-2015
MPM’s Revenue Structure by Product, 2008-2015
Revenue and Net Income of Dow Corning, 2008-2015
Ashland’s Revenue and Net Income, FY2012-FY2015
Revenue Structure of ASH’s Special Additives by Product, 2014
Revenue and Net Income of Tex Year, 2008-2015
Revenue Structure of Tex Year by Product, 2013-2014
Revenue of Tex Year by Region, 2013-2014
Revenue of Tex Year by Business, 2008-2013
Gross Margin of Tex Year, 2008-2015
R&D Costs and % of Total Revenue of Tex Year, 2008-2015
Tex Year’s Revenue from Hot Melt Adhesives and Other Adhesives and % of Total Revenue, 2013-2014
Capacity, and Output, and Sales Volume of Tex Year’s Hot Melt Adhesives and Other Adhesives, 2013-2014
Output Value and Revenue of Tex Year’s Hot Melt Adhesives and Other Adhesives, 2013-2014
Name List, Operating Revenue, and Shareholding Ratio of Tex Year’s Holding Subsidiaries in China as of the End of 2014
Engineering Adhesive Output and Sales Volume of Hubei Huitian Adhesive Enterprise, 2012-2014
Revenue and Net Income of Hubei Huitian Adhesive Enterprise, 2009-2015
Revenue of Hubei Huitian Adhesive Enterprise by Product, 2008-2015
Revenue of Hubei Huitian Adhesive Enterprise by Application, 2012-2015
Revenue of Hubei Huitian Adhesive Enterprise by Region, 2008-2015
Gross Margin of Hubei Huitian Adhesive Enterprise by Product, 2008-2014
R&D Costs and % of Total Revenue of Hubei Huitian Adhesive Enterprise, 2008-2015
Revenue from Top 5 Clients and % of Total Revenue of Hubei Huitian Adhesive Enterprise, 2009-2014
Procurement from Top 5 Suppliers and % of Total Procurement of Hubei Huitian Adhesive Enterprise, 2009-2014
Revenue and Net Income of Hubei Huitian Adhesive Enterprise, 2014-2018E
Adhesive Output and Sales Volume of Kangda New Materials, 2011-2014
Revenue and Net Income of Kangda New Materials, 2008-2015
Revenue of Kangda New Materials by Product, 2008-2015
Revenue of Kangda New Materials by Region, 2008-2015
Gross Margin of Kangda New Materials by Product, 2008-2015
R&D Costs and % of Total Revenue of Kangda New Materials, 2011-2015
Project Investment and Progress of Kangda New Materials as of the End of 2013
Revenue from Top 5 Clients and % of Total Revenue of Kangda New Materials, 2009-2014
Procurement from Top 5 Suppliers and % of Total Procurement of Kangda New Materials, 2009-2014
Revenue and Net Income of Kangda New Materials, 2014-2018E
Revenue and Net Income of Chengdu Guibao Science & Technology, 2008-2015
Revenue of Chengdu Guibao Science & Technology by Product, 2008-2015
Revenue from Room Temperature Silicone Adhesive of Chengdu Guibao Science & Technology by Application, 2011-2015
Revenue of Chengdu Guibao Science & Technology by Region, 2008-2014
Gross Margin of Chengdu Guibao Science & Technology by Product, 2008-2013
R&D Costs and % of Total Revenue of Chengdu Guibao Science & Technology, 2008-2015
Revenue from Top 5 Clients and % of Total Revenue of Chengdu Guibao Science & Technology, 2009-2014
Name List and Revenue Contribution of Chengdu Guibao Science & Technology’s Top 5 Clients, 2013
Procurement from Top 5 Suppliers and % of Total Procurement of Chengdu Guibao Science & Technology, 2009-2014
Revenue and Net Income of Chengdu Guibao Science & Technology, 2014-2018E
Capacity, Output, Sales Volume, Capacity Utilization, and Sales-output Ratio of Polyurethane Adhesive of Comens New Materials, 2008-2014
Revenue and Net Income of Comens New Materials, 2009-2015
Revenue of Comens New Materials by Product, 2009-2014
Gross Margin of Comens New Materials by Product, 2009-2014
R&D Costs and % of Total Revenue of Comens New Materials, 2009-2014
Revenue from Top 5 Clients and % of Total Revenue of Comens New Materials, 2009-2014
Procurement from Top 5 Suppliers and % of Total Procurement of Comens New Materials, 2009-2014
Revenue and Net Income of Comens New Materials, 2014-2018E
Revenue of Tonsan Adhesive, 2011-2015
Tonsan Adhesive’s Downstream Consumption and Clients
Baiyun Chemical’s New Product Development and Characteristics, 2013-2014H1
Revenue of Major Global and Chinese Engineering Adhesive Manufacturers, 2010-2015
Net Income of Major Global and Chinese Engineering Adhesive Manufacturers, 2010-2015
Net Income of Major Global Engineering Adhesive Manufacturers, 2010-2015
Output of Major Chinese Engineering Adhesive by Product, 2014-2018E
Global and China Synthetic Rubber Industry Report, 2021-2027
Synthetic rubber is a polymer product made of coal, petroleum and natural gas as main raw materials and polymerized with dienes and olefins as monomers, which is typically divided into general synthet...
Global and China Carbon Fiber Industry Report, 2021-2026
Carbon fiber is a kind of inorganic high performance fiber (with carbon content higher than 90%) converted from organic fiber through heat treatment. As a new material with good mechanical properties,...
China Coal Tar Industry Report, 2020-2025
Coal tar is a thick dark liquid which is a by-product of the production of coke and coal gas from coal. It can be classified by the dry distillation temperature into low-temperature coal tar, medium-t...
Global and China Dissolving Pulp Industry Report, 2019-2025
In 2018, global dissolving pulp capacity outstripped 10 million tons and its output surged by 14.0% from a year ago to 7.07 million tons, roughly 70% of the capacity. China, as a key supplier of disso...
Global and China 1, 4-butanediol (BDO) Industry Report, 2019-2025
1,4-butanediol (BDO), an essential organic and fine chemical material, finds wide application in pharmaceuticals, chemicals, textile and household chemicals.
As of the end of 2018, the global BDO cap...
Global and China Carbon Fiber and CFRP Industry Report, 2019-2025
Among the world’s three major high performance fibers, carbon fiber features the highest strength and the highest specific modulus. It is widely used in such fields as aerospace, sports and leisure.
...
Global and China Natural Rubber Industry Report, 2019-2025
In 2018, global natural rubber industry continued remained at low ebb, as a result of economic fundamentals. Global natural rubber price presented a choppy downtrend and repeatedly hit a record low in...
Global and China Ultra High Molecular Weight Polyethylene (UHMWPE) Industry Report, 2019-2025
Ultra high molecular weight polyethylene (UHMWPE), a kind of linear polyethylene with relative molecular weight of above 1.5 million used as an engineering thermoplastic with excellent comprehensive p...
China Polyether Monomer Industry Report, 2019-2025
China has seen real estate boom and issued a raft of policies for continuous efforts in improving weak links in infrastructure sector over the years. Financial funds of RMB1,663.2 billion should be al...
Global and China Needle Coke Industry Report, 2019-2025
Needle coke with merits of good orientation and excellent conductivity and thermal conductivity, is mainly used in graphite electrodes for electric steelmaking and lithium battery anode materials.
A...
Global and China Viscose Fiber Industry Report, 2019-2025
Over the recent years, the developed countries like the United States, Japan and EU members have withdrawn from the viscose fiber industry due to environmental factor and so forth, while the viscose f...
China Coal Tar Industry Report: Upstream (Coal, coke), Downstream (Phenol Oil, Industrial Naphthalene, Coal Tar Pitch), 2019-2025
Coal tar is a key product in coking sector. In 2018, China produced around 20 million tons of coal tar, a YoY drop of 2.4% largely due to a lower operating rate of coal tar producers that had to be su...
Global and China Synthetic Rubber (BR, SBR, EPR, IIR, NBR, Butadiene, Styrene, Rubber Additive) Industry Report, 2018-2023
In 2018, China boasted a total synthetic rubber capacity of roughly 6,667kt/a, including 130kt/a new effective capacity. Considering capacity adjustment, China’s capacity of seven synthetic rubbers (B...
Global and China Dissolving Pulp Industry Report, 2018-2022
With the commissioning of new dissolving pulp projects, the global dissolving pulp capacity had been up to about 8,000 kt by the end of 2017. It is worth noticing that the top six producers including ...
Global and China Carbon Fiber and CFRP Industry Report, 2018-2022
As a new generation of reinforced fiber boasting intrinsic properties of carbon material and excellent processability of textile fiber, carbon fiber is the one with the highest specific strength and s...
Global and China Ultra High Molecular Weight Polyethylene (UHMWPE) Industry Report, 2017-2021
Ultra High Molecular Weight Polyethylene (UHMWPE), a kind of linear polyethylene with relative molecular weight of above 1.5 million and an engineering thermoplastic with excellent comprehensive prope...
China Coal Tar Industry Report, 2017-2021
Coal tar, one of by-products in raw coal gas generated from coal pyrolysis in coking industry, accounts for 3%-4% of the output of coal as fired and is a main raw material in coal chemical industry.
...
Global and China Aramid Fiber Industry Report, 2017-2021
Global aramid fiber output totaled 115kt with capacity utilization of 76.0% in 2016. As industries like environmental protection and military develop, the output is expected to rise to 138kt and capac...