Global and China Silica Industry Report, 2015-2018
-
Jan.2016
- Hard Copy
- USD
$2,600
-
- Pages:125
- Single User License
(PDF Unprintable)
- USD
$2,400
-
- Code:
LMX075
- Enterprise-wide License
(PDF Printable & Editable)
- USD
$3,800
-
- Hard Copy + Single User License
- USD
$2,800
-
China's silica (white carbon black) industry after rapid expansion over the preceding years has seen overcapacity and intensified competition among enterprises, combined with depressed demand from downstream sectors such as tire and shoemaking, China's silica capacity and output growth has been slow since 2013, with an around 50% capacity utilization of the industry. In 2015, the capacity and output rose 2.80% and 1.46% year on year to about 2,243 kilotons and 1,184 kilotons, respectively.
Against a slight downturn of the whole industry, Chinese silica enterprises are actively seeking breakthroughs by multiple means. Some companies are speeding up the R&D of high-performance silica technologies and launching projects; some competent players are beginning to get consciously involved in capital market and seeking a listing on the "New Three Board" (an over-the-counter market for growth enterprises); and a few ones are embracing business transformation.
Under the general trend of green tire development, the highly dispersible silica market in China has huge potential for development. Currently, Jiangxi Blackcat Carbon Black Inc.,Ltd that is primarily focused on carbon black plans an 80 kt/a highly dispersible silica project in Jining, Shandong province, and Yuan Xiang Chemical Co., Ltd. plans to build a 100 kt/a green tire-dedicated highly dispersible silica production line in the next two to three years.
Moreover, foreign companies are also bullish on green tire's huge demand for silica. Solvay started its 80 kt/a highly dispersible silica project in Gunsan, S. Korea in April 2015, followed by an 85 kt/a highly dispersible silica project located in Poland in July, thus expanding the company's capacity to 465 kilotons. And Evonik Industries AG's highly dispersible silica project in Americana, Brazil is under construction, too.
There have been two major enterprises seeking a listing on the "New Three Board" since 2015, namely Wuxi Quechen Silicon Chemical Co., Ltd. and Yuan Xiang Chemical Co., Ltd. The former as the largest silica producer in China boasts a 250 kt/a capacity and was listed on the "New Three Board" in October 2015. The latter mainly produces silica used in silicone rubber, but also engages in the research and development of high performance silica in the fields of delustering agent and green tire; with a 20 kt/a capacity, it formally applied for "New Three Board" listing in December 2015. In addition, Tong Hua Shuang Long Chemical Industry Co., Ltd. as the first listed company with silica as its core business purchased Jilin Jinbao Pharmaceutical Co., Ltd. in October 2014 and then pharmaceutical business replaced silica to become the main engine for the company's performance.
The report mainly highlights the followings:
 Global silica market structure, supply and demand conditions;
China's silica industry policies, production structure, capacity, output, import and export, competition pattern, etc.;
Analysis on silica product segments in China, i.e. capacity, output, production structure, corporate capacity and projects of precipitated silica and fumed silica;
China's silica consumption structure as well as six major applications;
Analysis on 6 global and 20 Chinese precipitated / fumed silica manufacturers.
1. Overview of Silica Industry
1.1 Definition and Classification
1.2 Applications
1.3 Policies
2. Development of Global Silica Industry
2.1 Market Pattern
2.2 Supply
2.3 Demand
3. Development of China Silica Industry
3.1 Capacity and Output
3.1.1 Product Mix
3.1.2 Production Data
3.2 Import and Export
3.3 Competition Pattern
4. Product Segments of China Silica Industry
4.1 Precipitated Silica
4.1.1 Capacity and Output
4.1.2 Production Structure
4.1.3 Major Producers
4.1.4 Major Projects
4.2 Fumed Silica
4.2.1 Capacity and Output
4.2.2 Production Structure
4.2.3 Major Producers
4.2.4 Major Projects
5. Downstream Applications of China Silica Industry
5.1 Consumption
5.2 Footwear
5.3 Tire
5.3.1 Tire Output
5.3.2 Demand for Silica
5.4 Silicone Rubber
5.4.1 Market Analysis
5.4.2 Demand for Silica
5.5 Pesticides and Feeds
5.6 Coating
5.7 Toothpaste
6. Key Companies in the World
6.1 Solvay S.A.
6.1.1 Profile
6.1.2 Operation
6.1.3 Silica Business
6.1.4 Solvay Highly Dispersible Silica Project (Poland) Put into Production
6.1.5 Solvay Silica Project (S. Korea) Starts Construction
6.1.6 Development in China
6.2 Evonik Industries AG
6.2.1 Profile
6.2.3 Operation
6.2.3 Silica Business
6.2.4 Silica Projects in Process
6.2.5 Development in China
6.3 PPG Industries
6.3.1 Profile
6.3.2 Silica Business
6.3.3 Operation
6.4 Cabot Corporation
6.4.1 Profile
6.4.2 Silica Business
6.4.3 Operation
6.4.4 Cabot Corporation Announces Restructuring Plan
6.4.5 Cabot Bluestar Chemical (Jiangxi) Company Limited
6.5 Wacker Chemie AG
6.5.1 Profile
6.5.2 Silica Business
6.5.3 Operation
6.5.4 Development in China
6.5.5 Wacker Chemicals (Zhangjiagang) Co., Ltd.
6.6 Tokuyama
6.6.1 Profile
6.6.2 Silica Business
6.6.3 Operation
6.6.4 Performance Forecast
6.6.5 Development Plan
6.6.6 Tokuyama Chemicals (Zhejiang) Co., Ltd.
7. Key Companies in China
Precipitated Silica Producers
7.1 Tong Hua Shuang Long Chemical Industry Co., Ltd.
7.1.1 Profile
7.1.2 Output and Sales Volume of Silica
7.1.3 Operation
7.1.4 Revenue Structure
7.1.5 Gross Margin
7.1.6 R&D and Investment
7.1.7 Competitive Advantages of Silica Business
7.1.8 Customers and Suppliers
7.1.9 Performance Forecast
7.2 Do-fluoride Chemicals Co., Ltd.
7.2.1 Profile
7.2.2 Operation
7.2.3 Revenue Structure
7.2.4 Silica Business
7.2.5 Business Transformation
7.2.6 Performance Forecast
7.3 Shandong Haihua Company Limited
7.3.1 Profile
7.3.2 Operation
7.3.3 Silica Business
7.4 Longxing Chemical Stock Co., Ltd.
7.4.1 Profile
7.4.2 Operation
7.4.3 Revenue Structure
7.4.4 Silica Business
7.4.5 Performance Forecast
7.5 Shanxi Tond Chemical Co., Ltd.
7.5.1 Profile
7.5.2 Output and Sales Volume of Silica
7.5.3 Operation
7.5.4 Revenue Structure
7.5.5 Gross Margin
7.5.6 R&D and Investment
7.5.7 Performance Forecast
7.6 Shandong Link Silica Co., Ltd.
7.6.1 Profile
7.6.2 Silica Business
7.6.3 Operation
7.6.4 Major Customers
7.6.5 Shandong Link Advanced Materials Buys A 100% Stake for RMB40.36 Million
7.7 Zhuzhou Xinglong New Material Co., Ltd
7.8 Wuxi QueChen Silicon Chemical Co., Ltd.
7.8.1 Profile
7.8.2 Development History
7.8.3 Silica Products
7.8.4 Operation
7.8.5 Competitive Advantages
7.9 Fujian Zhengsheng Inorganic Material Co.,Ltd
7.9.1 Profile
7.9.2 Silica Products
7.10 Sanming Fengrun Chemical Co., Ltd.
7.10.1 Profile
7.10.2 Silica Products
7.11 Fujian Shaxian Jinsha Silica Manufacturing Co., Ltd.
7.12 Fujian Sanming Zhengyuan Chemical Co., Ltd.
7.13 Yuan Xiang Chemical Co., Ltd.
7.13.1 Profile
7.13.2 Operation
7.13.3 Customers and Suppliers
7.13.4 Development Strategy
Fumed Silica Producers
7.14 Guangzhou GBS High-tech & Industry Co., Ltd.
7.15 Zhejiang Fushite Group
7.16 Chifeng Shengsen Silicon Technology Development Co., Ltd.
7.17 Jining Qingyun Chemical Co., Ltd.
7.18 Yichang CSG Polysilicon Co., Ltd.
7.19 China Silicon Corporation Ltd.
7.20 Jiangxi Blackcat Carbon Black Inc.,Ltd
7.20.1 Profile
7.20.2 Operation
7.20.3 Silica Business
8. Market Summary and Development Forecast
8.1 Market Summary
8.2 Development Forecast
8.2.1 Demand
8.2.2 Output
Classification of Silica
Main Applications of Silica
Regulations and Policies on Silica Industry in China
Products, Techniques, Capacities and Product Bases for Major Silica Producers in the World (as of 2015)
Global Silica Market Share in 2015 (by Capacity)
Capacity Structure of Global Silica in 2015 (by Process)
Silica Expansion Projects in the World, 2010-2015
Consumption Structure of Global Precipitated Silica Market
Silica Production Structure in China, 2008-2015 (by Output)
Capacity and Output of Silica in China, 2008-2015
Import and Export Volume of Silica, 2001-2014
Classification of Silica Market in China
Global Silica Producers’ Layout in China
Capacity and Output of Precipitated Silica in China, 2008-2015
Number of Precipitated Silica Producers in China, 2008-2015
Capacity and Output of Precipitated Silica in China, 2013
Capacity and Output of Precipitated Silica in China, 2013 (by Nature of Enterprise)
Capacity and Output of Precipitated Silica in China, 2012 (by Region)
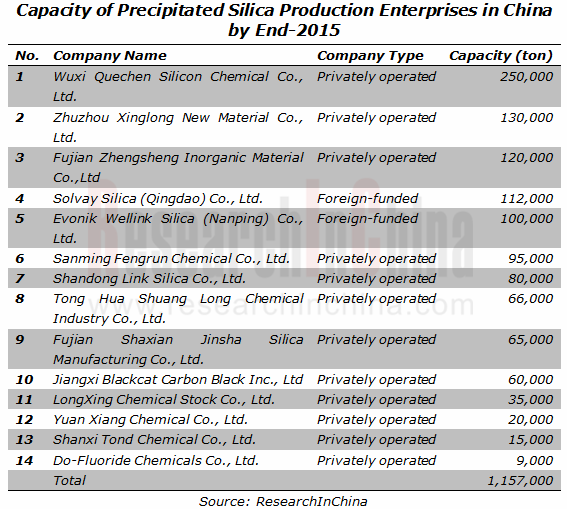
Precipitated Silica Producers’ Capacities in China (as of 2015)
Major Projects of Precipitated Silica in China, 2015
Capacity and Output of Fumed Silica in China, 2008-2015
Capacity and Output of Fumed Silica in China, 2013(by Nature of Enterprise)
Fumed Silica Producers’ Capacities in China (as of 2015)
Major Projects of Fumed Silica in China, 2015
Consumption Structure for Precipitated Silica in China, 2010-2015
Consumption Structure for Fumed Silica in China, 2012-2015
Silica Consumption in China, 2008-2015
Output and Its YoY Growth Rate of Leather Footwear in China, 2000-2015
Silica Consumption in Footwear Industry in China, 2010-2015
Output and Its YoY Growth Rate of Rubber Tire Casting in China, 2007-2015
Output and Its YoY Growth Rate of Radial Tire Casting in China, 2007-2015
Silica Consumption in Tire Industry in China, 2010-2015
Capacity, Output, and Consumption of Silicone Rubber in China, 2014
Consumption Structure of HTV in China, 2014
Consumption Structure of RTV in China, 2014
Silica Consumption in Silicone Rubber Industry in China, 2010-2015
Feed Output and YoY Change in China, 2007-2015
Output and Its YoY Change of Chemical Pesticide in China, 2005-2015
Silica Consumption in Pesticide & Feed Industry in China, 2010-2015
Coating Output and YoY Change in China, 2001-2015
Silica Consumption in Coating Industry in China, 2010-2015
Silica Consumption in Toothpaste Industry in China, 2010-2015
Operation of Solvay
Global Business Distribution of Solvay
Main Financials of Solvay, 2014-2015
Revenue Structure of Solvay, 2014-2015
REBITDA Structure of Solvay, 2015
Silica Brands of Solvay
Worldwide Silica Business of Solvay
Main Financials of Advanced Materials of Solvay, 2014-2015
Business Distribution of Solvay in China
Development History of Solvay in China
Introduction of Evonik
Main Financials of Evonik, 2014-2015
Revenue and EBITDA of Evonik (by BU), 2014-2015
Production Bases of Inorganic Materials of Evonik in the World
Silica Production Bases of PPG in the World
Main Financials of PPG, 2014-2015
Revenue and Income of PPG (by BU), 2014-2015
Worldwide Presence of Cabot
Revenue and Net Income of Cabot, FY2011-FY2015
Revenue and Earnings of Cabot (by Segments), FY2014-FY2015
Business Divisions of Wacker
Silica Production Bases of Wacker in the World
Main Financials of Wacker, 2014-2015
Revenue Structure of Wacker (by BU), 2014-2015
Revenue Structure of Wacker (by Regions), 2014-2015
Main Financials of Wacker Silicones, 2014-2015
Development History of Wacker in China
Global Business of Tokuyama
Introduction to Silica Products of Tokuyama
Main Financials of Tokuyama, FY2010-FY2014
Main Financials of Tokuyama, FY2014-FY2015
Revenue and Operating Income of Specialty Products of Tokuyama, FY2010-FY2014
Revenue and Operating Income of Tokuyama (by BU), FY2014-FY2015
Main Financials of Tokuyama, FY2015
Main Financials of Tokuyama (by BU), FY2015
Medium-Term Development Plan of Tokuyama
Introduction of Tokuyama Chemicals (Zhejiang) Co., Ltd.
Silica Application Fields and Product Types of Tokuyama Chemicals (Zhejiang) Co., Ltd.
Main Silica Products and Applications of Tong Hua Shuang Long Chemical Industry
Output and Sales Volume of Silica of Tong Hua Shuang Long Chemical Industry, 2007-2014
Revenue and Net Income of Tong Hua Shuang Long Chemical Industry, 2008-2015
Revenue Breakdown of Tong Hua Shuang Long Chemical Industry (by Product), 2012-2014
Revenue Breakdown of Tong Hua Shuang Long Chemical Industry (by Product), 2014-2015
Revenue Structure of Tong Hua Shuang Long Chemical Industry (by Region), 2008-2014
Revenue Structure of Tong Hua Shuang Long Chemical Industry (by Region), 2014-2015
Comprehensive Gross Margin of Tong Hua Shuang Long Chemical Industry, 2008-2014
Comprehensive Gross Margin of Tong Hua Shuang Long Chemical Industry, 2014-2015
R&D Costs and % of Total Revenue of Tong Hua Shuang Long Chemical Industry, 2008-2015
R&D Projects of Tong Hua Shuang Long Chemical Industry, H1 2015
Main Financials of Jinbao Pharmaceutical, 2014-2015
Committed Investment Project of Tong Hua Shuang Long Chemical Industry
Main Financials of Kuikang Pharmaceutical, 2014-2015
Tong Hua Shuang Long Chemical Industry’s Revenue from Top Five Clients and % of Total Revenue, Q1-Q3, 2015
Tong Hua Shuang Long Chemical Industry’s Procurement from Top Five Suppliers and % of Total Procurement, Q1-Q3, 2015
Revenue and Net Income of Tong Hua Shuang Long Chemical Industry, 2015-2018E
Revenue and Net Income of Do-fluoride Chemicals, 2008-2015
Main Products and Capacity of Do-fluoride Chemicals
Revenue Breakdown of Do-fluoride Chemicals (by Businesses), 2013-2015
Revenue Structure of Do-fluoride Chemicals (by Regions), 2008-2015
Technical Indicator of Silica of Do-fluoride Chemicals
Business Chain of Do-fluoride Chemicals
Business Development Direction of Do-fluoride Chemicals
Revenue and Net Income of Do-fluoride Chemicals, 2015-2018E
Revenue and Net Income of Shandong Haihua Company Limited, 2008-2015
Revenue of Sodium Silicate and Silica Business and % of Total Revenue of Shandong Haihua Company Limited, 2010-2013
Assets and Liabilities of Silica Plant of Shandong Haihua Company Limited, 2010-2013
Output of Silica Plant of Shandong Haihua Company Limited, 2010-2013
Revenue and Net Income of Longxing Chemical Stock, 2008-2015
Revenue Structure of Longxing Chemical Stock (by Products), H1 2015
Revenue Structure of Longxing Chemical Stock (by Region), 2011-2015
Silica Projects of Longxing Chemical Stock
Technical Indicators of Silica of Longxing Chemical Stock
Revenue, Operating Cost, and Gross Margin of Silica Business of Longxing Chemical Stock, 2014-2015
Revenue and Net Income of Longxing Chemical Stock, 2015-2018E
Types and Applications of Silica of Shanxi Tond Chemical
Output, Sales Volume, and Inventory of Silica of Shanxi Tond Chemical, 2011-2014
Revenue and Net Income of Shanxi Tond Chemical, 2008-2015
Revenue Structure of Shanxi Tond Chemical (by Business), 2009-2015
Revenue and Year-on-Year Change of Silica Products of Shanxi Tond Chemical, 2009-2015
Gross Margin of Shanxi Tond Chemical (by Products), 2010-2015
R&D Costs and % of Total Revenue of Shanxi Tond Chemical, 2011-2015
R&D Projects of Silica of Shanxi Tond Chemical
Revenue and Net Income of Shanxi Tond Chemical, 2015-2018E
Silica Product Types and Applications of Shandong Link Silica
Capacity, Output, and Sales Volume of Silica of Shandong Link Silica, 2009-2014
Main Operating Indicators of Shandong Link Silica, 2009-2015
Revenue Structure of Silica of Shandong Link Silica (by Products), 2009-2015
Shandong Link Silica’s Revenue from Top Five Clients and % of Total Revenue, Jan.-Oct., 2015
Development History of Wuxi QueChen Silicon Chemical
Product Types and Models of Silica of Wuxi QueChen Silicon Chemical
Main Financials of Wuxi QueChen Silicon Chemical, 2013-2015
Marketing Network of Fujian Zhengsheng Inorganic Material
Product Types and Applications of Fujian Zhengsheng Inorganic Material
Development Milestones of Sanming Fengrun Chemical
Product Types and Applications of Silica of Sanming Fengrun Chemical
Product Types and Applications of Silica of Fujian Sanming Zhengyuan Chemical
Main Financials of Yuan Xiang Chemical, 2013-2015
Main Financials of Yuan Xiang Chemical (by Business), 2013-2015
Operating Revenue Breakdown of Yuan Xiang Chemical (by Regions), 2013-2015
Yuan Xiang Chemical’s Revenue from Top Five Clients and % of Total Revenue, Q1-Q3, 2015
Yuan Xiang Chemical’s Procurement from Top Five Suppliers and % of Total Procurement, Q1-Q3, 2015
Product Types and Models of Guangzhou GBS High-tech & Industry
Technical Indicators of Zhejiang Fushite Group
Marketing Network of Chifeng Shengsen Silicon Technology Development
Development History of Yichang CSG Polysilicon
Revenue and Net Income of Jiangxi Blackcat Carbon Black, 2008-2015
Revenue and Gross Margin of Silica Business of Jiangxi Blackcat Carbon Black, 2011-2015
Output, Sales Volume, and Inventory of Jiangxi Blackcat Carbon Black, 2013-2014
Consumption Structure of Green Tire in the World (by Regions), 2017E
Green Tire Market Share in Major Asian Countries, 2020E
Silica Output in China, 2015-2018E
Global and China Synthetic Rubber Industry Report, 2021-2027
Synthetic rubber is a polymer product made of coal, petroleum and natural gas as main raw materials and polymerized with dienes and olefins as monomers, which is typically divided into general synthet...
Global and China Carbon Fiber Industry Report, 2021-2026
Carbon fiber is a kind of inorganic high performance fiber (with carbon content higher than 90%) converted from organic fiber through heat treatment. As a new material with good mechanical properties,...
China Coal Tar Industry Report, 2020-2025
Coal tar is a thick dark liquid which is a by-product of the production of coke and coal gas from coal. It can be classified by the dry distillation temperature into low-temperature coal tar, medium-t...
Global and China Dissolving Pulp Industry Report, 2019-2025
In 2018, global dissolving pulp capacity outstripped 10 million tons and its output surged by 14.0% from a year ago to 7.07 million tons, roughly 70% of the capacity. China, as a key supplier of disso...
Global and China 1, 4-butanediol (BDO) Industry Report, 2019-2025
1,4-butanediol (BDO), an essential organic and fine chemical material, finds wide application in pharmaceuticals, chemicals, textile and household chemicals.
As of the end of 2018, the global BDO cap...
Global and China Carbon Fiber and CFRP Industry Report, 2019-2025
Among the world’s three major high performance fibers, carbon fiber features the highest strength and the highest specific modulus. It is widely used in such fields as aerospace, sports and leisure.
...
Global and China Natural Rubber Industry Report, 2019-2025
In 2018, global natural rubber industry continued remained at low ebb, as a result of economic fundamentals. Global natural rubber price presented a choppy downtrend and repeatedly hit a record low in...
Global and China Ultra High Molecular Weight Polyethylene (UHMWPE) Industry Report, 2019-2025
Ultra high molecular weight polyethylene (UHMWPE), a kind of linear polyethylene with relative molecular weight of above 1.5 million used as an engineering thermoplastic with excellent comprehensive p...
China Polyether Monomer Industry Report, 2019-2025
China has seen real estate boom and issued a raft of policies for continuous efforts in improving weak links in infrastructure sector over the years. Financial funds of RMB1,663.2 billion should be al...
Global and China Needle Coke Industry Report, 2019-2025
Needle coke with merits of good orientation and excellent conductivity and thermal conductivity, is mainly used in graphite electrodes for electric steelmaking and lithium battery anode materials.
A...
Global and China Viscose Fiber Industry Report, 2019-2025
Over the recent years, the developed countries like the United States, Japan and EU members have withdrawn from the viscose fiber industry due to environmental factor and so forth, while the viscose f...
China Coal Tar Industry Report: Upstream (Coal, coke), Downstream (Phenol Oil, Industrial Naphthalene, Coal Tar Pitch), 2019-2025
Coal tar is a key product in coking sector. In 2018, China produced around 20 million tons of coal tar, a YoY drop of 2.4% largely due to a lower operating rate of coal tar producers that had to be su...
Global and China Synthetic Rubber (BR, SBR, EPR, IIR, NBR, Butadiene, Styrene, Rubber Additive) Industry Report, 2018-2023
In 2018, China boasted a total synthetic rubber capacity of roughly 6,667kt/a, including 130kt/a new effective capacity. Considering capacity adjustment, China’s capacity of seven synthetic rubbers (B...
Global and China Dissolving Pulp Industry Report, 2018-2022
With the commissioning of new dissolving pulp projects, the global dissolving pulp capacity had been up to about 8,000 kt by the end of 2017. It is worth noticing that the top six producers including ...
Global and China Carbon Fiber and CFRP Industry Report, 2018-2022
As a new generation of reinforced fiber boasting intrinsic properties of carbon material and excellent processability of textile fiber, carbon fiber is the one with the highest specific strength and s...
Global and China Ultra High Molecular Weight Polyethylene (UHMWPE) Industry Report, 2017-2021
Ultra High Molecular Weight Polyethylene (UHMWPE), a kind of linear polyethylene with relative molecular weight of above 1.5 million and an engineering thermoplastic with excellent comprehensive prope...
China Coal Tar Industry Report, 2017-2021
Coal tar, one of by-products in raw coal gas generated from coal pyrolysis in coking industry, accounts for 3%-4% of the output of coal as fired and is a main raw material in coal chemical industry.
...
Global and China Aramid Fiber Industry Report, 2017-2021
Global aramid fiber output totaled 115kt with capacity utilization of 76.0% in 2016. As industries like environmental protection and military develop, the output is expected to rise to 138kt and capac...