Global and China Lithium Carbonate Industry Report, 2016-2020
-
Jan.2016
- Hard Copy
- USD
$2,400
-
- Pages:135
- Single User License
(PDF Unprintable)
- USD
$2,200
-
- Code:
SK001
- Enterprise-wide License
(PDF Printable & Editable)
- USD
$3,600
-
- Hard Copy + Single User License
- USD
$2,600
-
Driven by a surge in sales volume of new energy vehicles in China, the upstream material- lithium carbonate was in short supply in the fourth quarter of 2015 with soaring prices. Global lithium carbonate output increased by 12.3% year on year to 202,800 tons in 2015 and is expected to arrive at 244,200 tons in 2016, 288,900 tons in 2017, and 341,000 tons in 2018, a rise of 20.4%, 18.3%, and 18.4% from a year ago, respectively.
The booming sales of new energy vehicles worldwide will boost lithium carbonate consumption significantly. According to estimates, every 100,000 new energy vehicles (electric bus (40%), electric sedan (20%), hybrid bus (25%), and hybrid sedan (15%)) will create a demand of 5,000 tons to 8,000 tons of battery-grade lithium carbonate, about a rise of 5%-8% in global demand for battery-grade lithium carbonate.
The price of lithium carbonate in China has been going straight up since Oct 2015 with that of industrial-grade and battery-grade lithium carbonate rising substantially (to RMB120,000/t and RMB150,000/t in Jan 2016, respectively, when battery-grade lithium hydroxide was quoted at RMB140,000/t, compared with the bottom price of lithium carbonate standing at RMB50,000/t). It is expected that global demand for lithium carbonate will outpace supply during 2016-2017, leading to a continued price rise during this period. As new lithium carbonate capacities are gradually released after 2017, the price will tend to stabilize.
Global lithium resources are primarily concentrated in Chile and China. However, as the Chinese lithium carbonate manufacturers are restrained by production technology, the supply of capacity is limited and Chile and Australia hold the lion’s share of global capacity. The world’s top3 players- SQM, FMC, and Rockwood together seize more than 56% market share, which give them a strong bargaining power over downstream companies and powerful pricing power and allow them to adjust prices according to market supply & demand and changes in production costs. Global lithium carbonate companies have successively expanded capacity so as to meet ever-increasing market demand in recent years. Meanwhile, a large number of newcomers outside the industry build new capacity and get involved in lithium carbonate business, thus reducing the concentration of the industry.
Chinese lithium carbonate suppliers can be principally divided into two categories: salt lake providers represented by Tibet Urban Development and Investment, spodumene providers represented by Sichuan Tianqi Lithium Industries and Galaxy Resources. The exploitation of salt lakes in China is still in its infancy with small capacity, while spodumene providers represented by Sichuan Tianqi Lithium Industries are relatively competitive.
In 2014, China produced 43,000 tons of lithium carbonate, a year-on-year rise of 16.5%, 23,000 tons of lithium hydroxide monohydrate, up 4.5% over the previous year and mainly concentrated in Sichuan, and 2,600 tons of lithium metal, an increase of 13% from a year ago, compared with global output of around 4,000 tons. An output of 49,000 tons and apparent consumption of 74,000 tons caused a supply gap of 25,000 tons in 2015, and the gap is expected to reach 31,400 tons in 2020, creating brisk demand for imports.
We believe that as the Chinese government scales up its support for new energy vehicles, the demand for battery-grade lithium carbonate will be a tipping point. China’s demand for battery-grade lithium carbonate was about 27,800 tons in 2015 and is expected to exceed 100,000 tons in 2020. The country’s total demand for lithium carbonate will increase at annual rate of 20% over the next couple years, higher than the global average and approximating 167,000 tons in 2020.
Global and China Lithium Carbonate Industry Report, 2016-2020 by ResearchInChina highlights the followings:
 Global and China’s lithium carbonate supply and demand, supply gap, the demand for lithium carbonate from downstream sectors, especially new energy vehicles, energy storage, and consumer electronics;
Global and China’s competitive landscape, including market share of foreign and domestic companies, capacity planning, market pattern, etc.;
China’s lithium carbonate imports and exports, covering import/export value, prices, sources, destinations, etc.;
China’s production costs of lithium carbonate with lithium extracted from ores and from salt lake brine, price trends, etc.;
China’s lithium battery industry, including shipments, technology routes, market pattern, etc.;
Operation, technology, development planning, and output & sales of 8 lithium carbonate players in the United States, Chile, Australia, etc.;
Operation, technology, development planning, and output & sales of 14 Chinese lithium carbonate companies.
1 Overview of Lithium Carbonate
1.1 Definition of Lithium
1.1.1 Distribution of Lithium Resources Worldwide
1.1.2 Distribution of Lithium Resources in China
1.2 Application and Product Type
1.3 Industry Chain
1.4 Production Technology
2 Development of Global Lithium Carbonate Industry
2.1 Supply
2.2 Demand
2.2.1 New Energy Vehicles’ Demand for Lithium Carbonate
2.2.2 3C Consumer Electronics’ Demand for Lithium Carbonate
2.2.3 Energy Storage Equipment’ Demand for Lithium Carbonate
2.2.4 Industry’s Demand for Lithium Carbonate
2.3 Competitive Landscape
3 Development of Lithium Carbonate Industry in China
3.1 Supply
3.2 Demand
3.2.1 Total Demand
3.2.2 New Energy Vehicles’ Demand for Lithium Carbonate
3.2.3 Industrial Energy Storage’s Demand for Lithium Carbonate
3.3 Status Quo of Industrial Development
3.4 Competitive Landscape
3.5 Technology Trend- High-purity Lithium Carbonate
4 Import & Export of Lithium Carbonate in China
4.1 Overview
4.2 Import
4.2.1 Import Volume
4.2.2 Import Value
4.2.3 Import Origins
4.3 Export
4.3.1 Export Volume
4.3.2 Export Value
4.3.3 Export Destinations
5 Production Costs and Prices
5.1 Costs of Lithium Carbonate
5.1.1 Lithium Extracted from Ores
5.1.2 Lithium Extracted from Salt Lake Brine
5.2 Prices and Trend
6 Chinese Lithium Battery Market
6.1 Overview
6.2 Industry Chain
6.3 Output
6.4 Technology Route
6.5 Market Pattern
6.6 Electric Vehicles’ Demand for Lithium Battery
6.6.1 Chinese EV Market
6.6.2 Electric Vehicles’ Demand for Lithium Carbonate in China
7 Major Global Companies
7.1 SQM
7.1.1 Profile
7.1.2 Operation
7.1.3 Capacity
7.1.4 Sales Volume
7.1.5 Development Trend
7.2 Albemarle
7.2.1 Profile
7.2.2 Operation
7.2.3 Lithium Carbonate Business
7.2.4 Development Trend
7.2.5 Competitive Edge
7.3 FMC
7.3.1 Profile
7.3.2 Operation
7.3.3 Lithium Carbonate Business
7.4 Orocobre
7.4.1 Profile
7.4.2 Lithium Carbonate Business
7.5 Galaxy Resources
7.5.1 Profile
7.5.2 Lithium Carbonate Business
7.6 Simbol Mining
7.6.1 Profile
7.6.2 Lithium Carbonate Business
7.7 Sentient
7.7.1 Profile
7.7.2 Lithium Carbonate Business
7.7.3 Enirgi
7.8 Nordic Mining
7.8.1 Profile
7.8.2 Lithium Carbonate Business
8 Major Chinese Lithium Carbonate Companies
8.1 Sichuan Tianqi Lithium Industries, Inc.
8.1.1 Profile
8.1.2 Operation
8.1.3 Revenue Structure
8.1.4 Cost Analysis
8.1.5 Output and Sales Volume
8.1.6 Resource Acquisition
8.1.7 Core Competence
8.1.8 Performance Forecast
8.2 Qinghai Salt Lake Industry Co., Ltd.
8.2.1 Profile
8.2.2 Operation
8.2.3 Revenue Structure
8.2.4 Lithium Carbonate Business
8.2.5 Core Competence
8.2.6 Performance Forecast
8.3 YOUNGY Co., Ltd. (formerly Luxiang)
8.3.1 Profile
8.3.2 Operation
8.3.3 Revenue Structure
8.3.4 Costs
8.3.5 Lithium Carbonate Business
8.3.6 Core Competence
8.3.7 Performance Forecast
8.4 Tibet Mineral Development Co., Ltd.
8.4.1 Profile
8.4.2 Operation
8.4.3 Revenue Structure
8.4.4 Lithium Carbonate Business
8.4.5 Core Competence
8.4.6 Performance Forecast
8.5 Sichuan Western Resources Holding Co., Ltd.
8.5.1 Profile
8.5.2 Operation
8.5.3 Revenue Structure
8.5.4 Lithium Carbonate Business
8.5.5 Core Competence
8.5.6 Performance Forecast
8.6 Jiangxi Ganfeng Lithium Co., Ltd.
8.6.1 Profile
8.6.2 Industry Chain
8.6.3 Operation
8.6.4 Revenue Structure
8.6.5 Lithium Carbonate Business
8.6.6 Production Capacity
8.6.7 Core Competence
8.6.8 Performance Forecast
8.7 Western Mining Co., Ltd.
8.7.1 Profile
8.7.2 Operation
8.7.3 Lithium Carbonate Business
8.8 Tibet Urban Development and Investment Co., Ltd.
8.8.1 Profile
8.8.2 Operation
8.8.3 Lithium Carbonate Business
8.9 Jiangxi Special Electric Motor Co., Ltd.
8.9.1 Profile
8.9.2 Operation
8.9.3 Lithium Carbonate Business
8.10 Xinjiang Lithium Salt Plant
8.11 Sichuan Ni & Co Guorun New Materials Co., Ltd.
8.12 Sichuan Jixiang Lithium Co., Ltd.
8.13 ABA Guangsheng Lithium Co., Ltd.
8.14 Shanghai China Lithium Industrial Co., Ltd.
Global Lithium Resource Reserves in 2014
Distribution of Lithium Resources Worldwide
Distribution of Salt Lake Brine Resources Worldwide
Distribution of Main Lithium Ore Resources Worldwide
Distribution and Composition of Main Salt Lake Lithium Resources Worldwide
Global Lithium Resource Reserves, 2004-2015
Brine-extracted Lithium Output Estimation of Major Chinese Lithium Extraction Enterprises
Distribution of Lithium Resources and Manufacturers in China
Status Quo of Lithium Resource Development in China (by Production Enterprise/by Location of Resources)
Estimated Percentages of Main Applications of Lithium Carbonate in 2020
Schematic Diagram of Product Chain in Lithium Carbonate Industry
Features of Mainstream Lithium Carbonate Manufacturing Technologies
Lithium Extracting Technologies of Chinese Lithium Carbonate Manufacturers
Global Supply of Lithium Carbonate, 2012-2020E
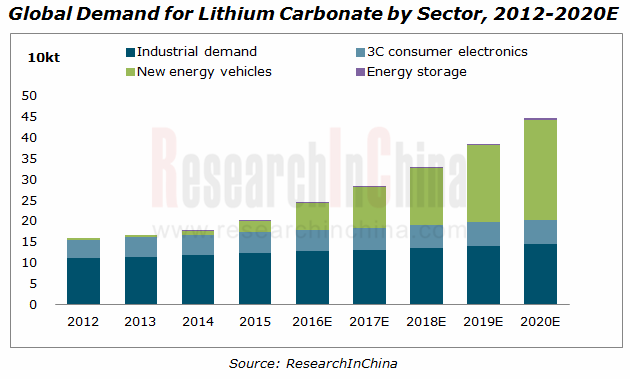
Global Demand for Lithium Carbonate, 2012-2020E
Global Supply of Lithium Carbonate (by Salt Lake Lithium and Ore Lithium), 2012-2020E
Global Lithium Carbonate Output Statistics and Capacity Forecast (by Enterprise/by Lithium Extraction Technology), 2011-2017E
Demand for Lithium Carbonate from Main Downstream End Products
Global Demand for Lithium Carbonate, 2012-2020E
Consumption Structure of Lithium Carbonate Worldwide, 2013
Consumption Structure of Lithium Carbonate Worldwide, 2015
World’s Mainstream EV Makers’ Selection of Cathode Materials
EV&PHEV Sales Volume in the World, 2011-2020
EV’s Demand for Power Lithium Battery (by Type) Worldwide, 2011-2020
New Energy Vehicle’s Demand for Lithium Carbonate Worldwide, 2016-2020E
Use of Lithium Battery by 3C Consumer Electronics
Structure of 3C Consumer Electronics’ Demand for Lithium Battery Used Lithium Carbonate Worldwide, 2015
Global Demand for Lithium Battery from Consumer Electronics and Growth Rate, 2013-2020E
Global Mobile Phone Sales Volume and Demand for Lithium Battery, 2012-2020E
Global Tablet PC Sales Volume and Demand for Lithium Battery, 2012-2020E
Competitive Pattern of Global Tablet PC Market, 2013-2015
Global Notebook Computer Sales Volume and Demand for Lithium Battery, 2012-2020E
Global Electronic Cigarette Sales Volume and Percentage, 2012-2020E
Global 3C Consumer Electronics’ Demand for Lithium Carbonate, 2016-2020E
Demand for Lithium Carbonate from Global Energy Storage Equipment, 2016-2020E
Global Consumption Structure of Lithium Carbonate for Industrial Use, 2015
Global Demand for Lithium Carbonate for Industrial Use, 2016-2020E
Distribution of Lithium Carbonate Capacities Worldwide
Global Lithium Carbonate Market Pattern, 2015
Output and Capacity of World’s Leading Lithium Carbonate Manufacturers, 2014-2015
Share of China’s Lithium Carbonate Output in Global Total, 2012-2020E
Output of Basic Lithium Salts in China, 2013-2014
Estimated Demand for Battery-grade Lithium Carbonate in China
EV & PHEV Sales Volume in China, 2011-2020E
Share of China’s EV & PHEV Sales Volume in Global Total, 2011-2020E
Demand for Power Lithium Battery (by Type) in China, 2011-2020E
Number of Mobile Base Stations in China, 2009-2016E
Demand for Energy Storage Lithium Battery in China, 2015/2020
Structure of Demand for Energy Storage Lithium Battery (by Field) in China, 2020E
Energy Storage Battery Demand (by Application Field) in China, 2014-2020E
Market Share of Leading Lithium Carbonate Enterprises in China, 2015
Production Capacities of Leading Lithium Carbonate Enterprises in China, 2015
High-purity Lithium Carbonate Capacity of Some Enterprises in China
Main Spodumene Mines Worldwide
Main Lithium-containing Salt Lakes Worldwide
Lithium Carbonate Manufacturing Costs of Major Global Companies
Lithium Ores and Purity of Brine-extracted Products
Prices of Industrial-grade and Battery-grade Lithium Carbonate in China, 2012-2016E
Structure of Global Demand for Lithium Battery, 2012-2020E
Output of Power Lithium Battery in China (by Application), 2011-2020E
Global Output of Power Lithium Battery for Electric Vehicles (by Application), 2011-2020E
Cost Structure of Li-ion Battery
Li-ion Battery Industry Chain
Suppliers of Lithium Battery Upstream Materials in China
Suppliers of Battery Materials in China
Lithium Battery Downstream Enterprises in China
Output of Lithium Battery in China, 2008-2015
Distribution of Lithium Battery Output Concentration in China, Jan-Oct., 2015
Capacities of Top 10 Lithium Battery Companies in China, 2015
Comparison between Different Manufacturing Technologies for Lithium Battery
Technology Roadmap of Some Leading Chinese Lithium Battery Manufacturers
Percentage of Power Battery (by Type of Technology) Supporting for New Energy Passenger Vehicles in China, 2015H1
Market Share of Leading Battery Manufacturers in 2015H1
Shipment of Leading Battery Manufacturers in 2015H1
Electric Vehicle Sales Volume in China, 2011-2020E
Demand for Lithium Carbonate from Electric Vehicle in China, 2011-2020E
Lithium Carbonate Manufacturing Flow of SQM
Operating Income of SQM, 2011-2015
Net Income of SQM, 2011-2015
SQM’s Revenue from and Gross Margin of Lithium and Its Derivatives, 2009-2015
Revenue Contribution of Lithium and Derivatives to SQM, 2009-2015
Lithium Carbonate Capacity of SQM, 2006-2020E
SQM’s Sales Volume of Lithium and Lithium Derivatives and Market Share, 2006-2014
SQM’s Lithium Carbonate Sales Percentage by Regions Worldwide, 2012-2014
Lithium Resource Reserves of Albemarle
Distribution of Albemarle’s Lithium Salt Processing Enterprises Worldwide
Operating Income of Albemarle, 2011-2015
Net Income of Albemarle, 2011-2015
Albemarle’s Revenue from Lithium Business Segment and Comparison of EBITDA, 2014/2015Q3
Main Lithium Products of Albemarle
Lithium Carbonate Capacity of Albemarle, 2014-2020E
Albemarle’s Commissioning of the 20,000 t/a Battery-grade Lithium Carbonate Plant in La Negra, Chile
Albemarle’s New Addition of 50,000-ton Capacity of Spodumene Battery-grade Lithium Salts in 2020
FMC’s Hombre Muerto Salt Lake Processing Technology
Operating Income of FMC, 2012-2015
Net Income of FMC, 2012-2015
FMC’s Revenue Breakdown by Segment, 2014
FMC’s Revenue Breakdown by Region, 2014
FMC’s Revenue from Lithium Products, 2006-2015
Lithium Carbonate Downstream Fields in which FMC Set Foot
FMC’s Prediction of Global Demand for Lithium Carbonate, 2016-2020
Lithium Carbonate Capacity of FMC, 2014-2020E
Product Sales Volume of Orocobre, 2013-2014
Olaroz Salt Lake Technical Transformation and Optimization Technology Roadmap
Olaroz Salt Lake Output Prediction, 2015
Lithium Carbonate Capacity of Orocobre, 2015-2020E
Lithium Carbonate Output and Sales Volume of Galaxy Resources’ Jiangsu Plant, 2012-2013
Distribution of Nordic Mining’s Resources
Organization Structure of Sichuan Tianqi Lithium Industries
Total Revenue, Operating Income and Net Income of Sichuan Tianqi Lithium Industries, 2007-2015
Gross Margin of Lithium Salts of Sichuan Tianqi Lithium Industries, 2010-2015
Revenue Structure of Sichuan Tianqi Lithium Industries by Region, 2009-2015
Lithium Carbonate Cost Structure of Sichuan Tianqi Lithium Industries, 2012-2013
Capacity Distribution of Sichuan Tianqi Lithium Industries, 2014
Revenue and Net Income of Qinghai Salt Lake Industry, 2009-2015
Revenue Structure of Qinghai Salt Lake Industry (by Product), 2010-2015
Total Revenue of Qinghai Salt Lake Industry, 2015-2017E
Transformation Process of YOUNGY Co., Ltd
Organization Structure of YOUNGY Co., Ltd, 2015
Revenue and Net Income of YOUNGY Co., Ltd, 2009-2015
Revenue Structure of YOUNGY Co., Ltd by Product, 2015H2
Revenue Structure of YOUNGY Co., Ltd by Region, 2015H2
Cost Structure of Lithium Products of YOUNGY Co., Ltd, 2013-2014
Lithium Ore Output, Sales Volume and Inventory of YOUNGY Co., Ltd, 2012-2014
Product R&D Scheme of Dongguan Tec-Rich Engineering, 2014-2018
Revenue and Net Income of Luxiang Co., Ltd, 2014-2017
Revenue and Net Income of Tibet Mineral Development, 2009-2015
Revenue Structure of Tibet Mineral Development by Product, 2015H2
Main Operating Indices of Lithium Carbonate Exploitation and Production Enterprises of Tibet Mineral Development, 2013-2014
Key Subsidiaries of Sichuan Western Resources Holding in New Energy Industry Chain
Revenue and Net Income of Sichuan Western Resources Holding, 2009-2015
Revenue Structure of Sichuan Western Resources Holding by Sector, 2015H2
Revenue Structure of Sichuan Western Resources Holding by Product, 2015H2
Revenue of Sichuan Western Resources Holding, 2015-2017E
Footprint of Jiangxi Ganfeng Lithium in the Emerging Fields
Revenue and Net Income of Jiangxi Ganfeng Lithium, 2009-2015
Revenue and Gross Margin of Jiangxi Ganfeng Lithium by Product/by Region, 2013-2015
Product Manufacturing Flow of Jiangxi Ganfeng Lithium
Revenue, Cost and Gross Margin of Lithium Carbonate Business of Jiangxi Ganfeng Lithium, 2009-2014
Capacities of Main Products of Jiangxi Ganfeng Lithium, 2014
Distribution of Lithium Resource of Jiangxi Ganfeng Lithium
Major Projects of Jiangxi Ganfeng Lithium, 2013-2014
Revenue and Net Income of Jiangxi Ganfeng Lithium, 2014-2017
Revenue and Net Income of Western Mining, 2009-2015
Revenue and Net Income of Tibet Urban Development and Investment, 2009-2015
Product Capacity Planning of Tibet Urban Development and Investment, 2013-2018E
Revenue and Net Income of Jiangxi Special Electric Motor, 2009-2015
Revenue and Gross Margin of Jiangxi Special Electric Motor by Business, 2015H2
Projects with Raised Funds of Jiangxi Special Electric Motor
Capacities of Main Products of Xinjiang Lithium Salt Plant
Capacities of Main Products of Sichuan Ni & Co Guorun New Materials
Capacities of Main Products of Sichuan Jixiang Lithium
Capacities of Main Products of ABA Guangsheng Lithium
Capacities of Main Products of Shanghai China Lithium Industrial
Global and China Synthetic Rubber Industry Report, 2021-2027
Synthetic rubber is a polymer product made of coal, petroleum and natural gas as main raw materials and polymerized with dienes and olefins as monomers, which is typically divided into general synthet...
Global and China Carbon Fiber Industry Report, 2021-2026
Carbon fiber is a kind of inorganic high performance fiber (with carbon content higher than 90%) converted from organic fiber through heat treatment. As a new material with good mechanical properties,...
China Coal Tar Industry Report, 2020-2025
Coal tar is a thick dark liquid which is a by-product of the production of coke and coal gas from coal. It can be classified by the dry distillation temperature into low-temperature coal tar, medium-t...
Global and China Dissolving Pulp Industry Report, 2019-2025
In 2018, global dissolving pulp capacity outstripped 10 million tons and its output surged by 14.0% from a year ago to 7.07 million tons, roughly 70% of the capacity. China, as a key supplier of disso...
Global and China 1, 4-butanediol (BDO) Industry Report, 2019-2025
1,4-butanediol (BDO), an essential organic and fine chemical material, finds wide application in pharmaceuticals, chemicals, textile and household chemicals.
As of the end of 2018, the global BDO cap...
Global and China Carbon Fiber and CFRP Industry Report, 2019-2025
Among the world’s three major high performance fibers, carbon fiber features the highest strength and the highest specific modulus. It is widely used in such fields as aerospace, sports and leisure.
...
Global and China Natural Rubber Industry Report, 2019-2025
In 2018, global natural rubber industry continued remained at low ebb, as a result of economic fundamentals. Global natural rubber price presented a choppy downtrend and repeatedly hit a record low in...
Global and China Ultra High Molecular Weight Polyethylene (UHMWPE) Industry Report, 2019-2025
Ultra high molecular weight polyethylene (UHMWPE), a kind of linear polyethylene with relative molecular weight of above 1.5 million used as an engineering thermoplastic with excellent comprehensive p...
China Polyether Monomer Industry Report, 2019-2025
China has seen real estate boom and issued a raft of policies for continuous efforts in improving weak links in infrastructure sector over the years. Financial funds of RMB1,663.2 billion should be al...
Global and China Needle Coke Industry Report, 2019-2025
Needle coke with merits of good orientation and excellent conductivity and thermal conductivity, is mainly used in graphite electrodes for electric steelmaking and lithium battery anode materials.
A...
Global and China Viscose Fiber Industry Report, 2019-2025
Over the recent years, the developed countries like the United States, Japan and EU members have withdrawn from the viscose fiber industry due to environmental factor and so forth, while the viscose f...
China Coal Tar Industry Report: Upstream (Coal, coke), Downstream (Phenol Oil, Industrial Naphthalene, Coal Tar Pitch), 2019-2025
Coal tar is a key product in coking sector. In 2018, China produced around 20 million tons of coal tar, a YoY drop of 2.4% largely due to a lower operating rate of coal tar producers that had to be su...
Global and China Synthetic Rubber (BR, SBR, EPR, IIR, NBR, Butadiene, Styrene, Rubber Additive) Industry Report, 2018-2023
In 2018, China boasted a total synthetic rubber capacity of roughly 6,667kt/a, including 130kt/a new effective capacity. Considering capacity adjustment, China’s capacity of seven synthetic rubbers (B...
Global and China Dissolving Pulp Industry Report, 2018-2022
With the commissioning of new dissolving pulp projects, the global dissolving pulp capacity had been up to about 8,000 kt by the end of 2017. It is worth noticing that the top six producers including ...
Global and China Carbon Fiber and CFRP Industry Report, 2018-2022
As a new generation of reinforced fiber boasting intrinsic properties of carbon material and excellent processability of textile fiber, carbon fiber is the one with the highest specific strength and s...
Global and China Ultra High Molecular Weight Polyethylene (UHMWPE) Industry Report, 2017-2021
Ultra High Molecular Weight Polyethylene (UHMWPE), a kind of linear polyethylene with relative molecular weight of above 1.5 million and an engineering thermoplastic with excellent comprehensive prope...
China Coal Tar Industry Report, 2017-2021
Coal tar, one of by-products in raw coal gas generated from coal pyrolysis in coking industry, accounts for 3%-4% of the output of coal as fired and is a main raw material in coal chemical industry.
...
Global and China Aramid Fiber Industry Report, 2017-2021
Global aramid fiber output totaled 115kt with capacity utilization of 76.0% in 2016. As industries like environmental protection and military develop, the output is expected to rise to 138kt and capac...