Global and China Natural Rubber Industry Report, 2016-2020
-
Aug.2016
- Hard Copy
- USD
$2,400
-
- Pages:121
- Single User License
(PDF Unprintable)
- USD
$2,250
-
- Code:
CYH051
- Enterprise-wide License
(PDF Printable & Editable)
- USD
$3,500
-
- Hard Copy + Single User License
- USD
$2,600
-
Since 2011, the global natural rubber market has been in a state of oversupply which reached 220,000 tons in 2011 and about 140,000 tons in 2015. Affected by the growing tapping area of natural rubber in main producing regions, the slowdown in the growth rate of the tire industry and other factors, there will still be a glut of natural rubber worldwide during 2016-2020 and the global glut will be 110,000 tons or so in 2020.
Due to the sluggish global economic growth and the excess supply of natural rubber, the price of natural rubber has been hovering at a low level. As of the end of 2015, China's natural rubber price had fallen to around USD1,140 / ton which was also the cost price. In 2016, the global average price of natural rubber fluctuates at USD1,200-1,500 / ton.
In 2015, China's natural rubber output dropped 5.5% year on year to 794,200 tons. Weather factors confine China’s natural rubber planting areas to a limited scope; plus the rubber price lingering on the cost line, more and more farmers have abandoned rubber production. In 2016, China's output of natural rubber is expected to further decline by 5.3% to 752,100 tons.
As the world's largest consumer, China consumed 4.682 million tons of natural rubber in 2015, accounting for 38.5% of the global total. Amid the serious imbalance between supply and demand, China mostly imports natural rubber to meet the additional demand. The import volume rose 4.8% year on year to 2.736 million tons, while the average import price fell 24.5% year on year to USD1,431.6 / ton in 2015.
In the backdrop of the descending rubber price and the downsized rubber plantations, China's automobile industry has been expanding in ownership and new increment, conducing to the ascending rigid demand of the tire industry and the growing demand for natural rubber. In 2016-2020, the contradiction between natural rubber supply and demand in China will further intensify; by 2020, the gap between supply and demand will hit about 5.142 million tons, an increase of 32.3% over 2015.
Restricted by resource distribution, the natural rubber industry is highly centralized in Thailand, Malaysia and other Southeast Asian nations, represented by the key players such as Sri Trang Agro-Industry, Von Bundit, Southland Rubber, Thai Rubber Latex and Sinochem International.
Given the downturn of the natural rubber market, companies can speed up the development of resources and strategies, increase the planting area in major producing countries as well as enhance processing factory layout to improve production capacity in the next years; on the other hand, they can keep an eye on customization and high-end market applications of natural rubber, such as military rubber tires, to heighten the gross margin and competitiveness of products.
Capacity of Major Global and Chinese Natural Rubber Producers, 2016
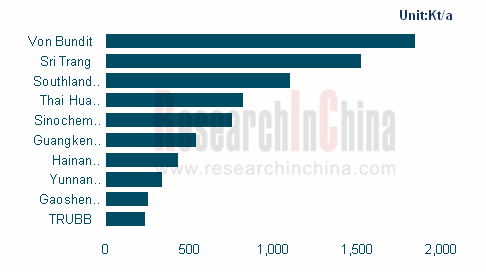
Source: ResearchInChina
Global and China Natural Rubber Industry Report, 2016-2020 by ResearchInChina highlights:
 Supply & demand, regional distribution, prices, competitive landscape and development trends of global natural rubber market;
Supply & demand, import & export, regional structure, competitive landscape, development trends of Chinese natural rubber market;
Tapping area and planting area of natural rubber in China and around the world;
Development of applications of natural rubber in China, such as tyre, rubber belt & hose;
Operation and development in China of 5 global natural rubber companies;
Operation and development strategies of 5 key Chinese natural rubber companies.
1 Basic Concept of Natural Rubber
1.1 Definition
1.2 Classification
1.3 Industry Chain
2 Development of Global Natural Rubber Market
2.1 Status Quo
2.2 Supply
2.3 Demand
2.3.1 Consumption
2.3.2 Consumption Structure
2.4 Main Natural Rubber Producing Areas
2.4.1 Thailand
2.4.2 Indonesia
2.4.3 Malaysia
2.4.4 Vietnam
2.5 Price
2.6 Competitive Landscape
2.6.1 by Revenue
2.6.2 by Capacity
2.7 Development Trend
3 Development of Chinese Natural Rubber Market
3.1 Status Quo
3.2 Supply and Demand
3.2.1 Supply and Regional Structure
3.2.2 Demand and Consumption Structure
3.3 Import and Export
3.3.1 Import
3.3.2 Export
3.4 Price
3.5 Competitive Landscape
3.5.1 by Enterprise
3.5.2 Substitute Products
3.6 Development Trend
4 Development of Global and China Natural Rubber-related Industries
4.1 Upstream
4.2 Downstream
4.2.1 Tyre Industry
4.2.2 Others
5 Key Global Players
5.1 Sri Trang Agro-Industry Plc.
5.1.1 Profile
5.1.2 Operation
5.1.3 Revenue Structure
5.1.4 Capacity, Output and Sales Volume
5.1.5 Layout of Industry Chain
5.1.6 Development in China
5.1.7 Competitive Edge
5.2 Thai Rubber Latex Corporation (Thailand) Public Co., Ltd. (TRUBB)
5.2.1 Profile
5.2.2 Operation
5.2.3 Revenue Structure
5.2.4 Capacity and Sales Volume
5.2.5 Layout of Industry Chain
5.2.6 Product Competitive Strategy
5.2.7 Sales Channels
5.2.8 Development in China
5.3 Thai Hua Rubber Public Co., Ltd.
5.3.1 Profile
5.3.2 Capacity
5.3.3 Development in China
5.3.4 Competitive Edge
5.4 Von Bundit Co., Ltd.
5.4.1 Profile
5.4.2 Capacity
5.4.3 Competitive Edge
5.5 Southland Rubber Co., Ltd.
5.5.1 Profile
5.5.2 Capacity
5.5.3 Development in China
6 Major Chinese Companies
6.1 China Hainan Rubber Industry Group Co., Ltd. (601118)
6.1.1 Profile
6.1.2 Operation
6.1.3 Revenue Structure
6.1.4 Gross Margin
6.1.5 Output and Sales Volume
6.1.6 Competitive Strength
6.1.7 Development Strategy
6.2 Sinochem International Corporation (600500)
6.2.1 Profile
6.2.2 Operation
6.2.3 Revenue Structure
6.2.4 Gross Margin
6.2.5 Natural Rubber Business
6.2.6 Competitive Edge
6.3 Yunnan State Farms Group Co., Ltd.
6.3.1 Profile
6.3.2 Operation
6.3.3 Revenue Structure
6.3.4 Natural Rubber Business
6.3.5 Overseas Layout
6.3.6Competitive Strength
6.4 Guangdong Guangken Rubber Group Co., Ltd.
6.4.1 Profile
6.4.2 Operation
6.4.3 Rubber Plantation Business
6.4.4 Rubber Processing Business
6.4.5 Development Strategy
6.5 Yunnan Gaoshen Rubber Co., Ltd.
6.5.1 Profile
6.5.2 Operation
6.5.3 Capacity, Output and Sales Volume
6.5.4 Competitive Edge
Properties of Natural Rubber
Categories of Standard Rubber (by Level)
Classification of Natural Rubber
Main Production Processes of Natural Rubber
Natural Rubber Industry Chain
Development Stages of Global Natural Rubber
Global Natural Rubber Output and YoY Growth, 2008-2016
Global Natural Rubber Output by Country, 2013-2015
Occurrence Time and Intensity of Important El Ni?o Phenomena, by Jun 2016
Global Natural Rubber Consumption and YoY Growth, 2008-2016
Global Natural Rubber Consumption Structure by Application, 2015&2020
Global Natural Rubber Export Volume Structure by Country, 2015
Thailand's Natural Rubber Output and Tapping Area, 2015-2020E
Thailand's Natural Rubber Export Volume, 2005-2016
Temperature Characteristics of Thailand's Natural Rubber Planting Areas by Month
Distribution of Thailand's Natural Rubber by Tree Age, by 2020E
Thailand's Natural Rubber Output by Product, 2010-2015
Thailand's Natural Rubber Output Structure by Product, 2015
Indonesia's Natural Rubber Supply, 2015-2020E
Indonesia's Natural Rubber Export Volume, 2008-2016
Indonesia's Natural Rubber Total Planting Area, Tapping Area and Tapping Rate, 2003-2015
Malaysia's Natural Rubber Supply, 2015-2020E
Malaysia's Natural Rubber Export Volume, 2008-2016
Malaysia's Natural Rubber Planting Area, 1996-2015
Malaysia's Natural Rubber Total Planting Area, Tapping Area and Tapping Rate, 2003-2016
Malaysia's Additional Natural Rubber Planting Area, 2003-2016
Malaysia’s Standard Rubber Price, 2012-2016
Vietnam's Natural Rubber Supply, 2015-2020E
Vietnam's Natural Rubber Export Volume, 2008-2016
Vietnam's Natural Rubber Total Planting Area, Tapping Area and Tapping Rate, 2003-2016
Vietnam's Additional Natural Rubber Planting Area, 2003-2016
Vietnam's Natural Rubber Export Volume, 2007-2015
Vietnam's Natural Rubber Export Structure by Product, 2015
Policies on Natural Rubber in Major Countries, 2009-2016
CIF Prices of Natural Rubber in Main Ports of Qingdao, 2014-2016
Revenue of Major Global and Chinese Rubber Producers, 2015-2016
Capacity of Major Global and Chinese Natural Rubber Producers, 2016
Global Natural Rubber Output and Demand, 2015-2020E
Global Natural Rubber Consumption by Application, 2015-2020E
Purchase and Storage of Natural Rubber by State Bureau of Material Reserve, Dec 2014
China’s Natural Rubber Output and YoY Growth, 2008-2016
China’s Natural Rubber Self-sufficiency Rate, 2005-2016
China’s Natural Rubber Output Structure by Region, 2015
Structure of Hainan's Natural Rubber Processing Regions
China’s Natural Rubber Consumption and YoY Growth, 2008-2016
Structure of Downstream Demand for Natural Rubber in China, 2013-2020E
China’s Import Tariff Policies on Natural Rubber, 2006-2016
Import Volume and YoY Growth of Natural Rubber in China, 2004-2016
Import Volume Structure of Natural Rubber in China by Country, 2007-2016
Import Volume Structure of Natural Rubber in China by Product, 2013&2015
China’s Natural Rubber Export Volume, 2008-2016
Natural Rubber Price in Shanghai Market, 2011-2016
Natural Rubber Business Development of Major Natural Rubber Producers in China, 2015
Performance of Common Rubber Products
Synthetic Rubber Output and Consumption in China, 2003-2020E
Natural Rubber Output and Consumption in China, 2015-2020E
Total Planting Area of Global Top 9 Natural Rubber Producing Countries, 2013-2015
Tapping Area of Global Top 9 Natural Rubber Producing Countries, 2004-2014
Natural Rubber Output of Global Major Countries, 2014-2015
New Planting & Replanting Area of Global Major Natural Rubber Producing Countries, 2008-2015
Stoppage Periods of Global Major Natural Rubber Producing Countries
China’s Radial Tire Operating Rate by Product, 2013-2016
China’s Tire Export Volume and Value, 2013-2015
Size of Chinese Semisteel Tire Enterprises, 2015
Size of Chinese Steel Tire Enterprises, 2015
Steel Tire Cost Structure by Raw Materials, 2015
Semisteel Tire Cost Structure by Raw Materials, 2015
Demand of Chinese Radial Tires for Natural Rubber, 2015-2020E
Overseas Natural Rubber Layout of Chinese Tire Enterprises, 2016
China’s Rubber Hose & Belt Output and YoY Growth, 2012-2015
Revenue and YoY Growth of Rubber Hose-related Manufacturers in China, 2008-2015
Gross Margin of Rubber Hose Manufacturers in China, 2008-2015
Milestones in the Development of Sri Trang, 1987-2016
Revenue and Net Income of Sri Trang, 2008-2016
Gross Profit and Gross Margin of Sri Trang, 2014-2015
Operating Revenue of Sri Trang by Product, 2012-2016
Natural Rubber Operating Revenue of Sri Trang by Country, 2013-2016
Natural Rubber Sales Volume of Sri Trang by Country/Region, 2015-2016
Natural Rubber Sales Volume of Sri Trang by Product, 2010-2015
Natural Rubber Industry Chain of Sri Trang, 2016
Natural Rubber Planting Area Structure of Sri Trang, by the end of Mar 2016
Natural Rubber Tapping Area of Sri Trang, 2016-2022E
Natural Rubber Capacity of Sri Trang, 2005-2016
Layout of Sri Trang’s Main Downstream Natural Rubber Products, 2016
Natural Rubber Revenue of Sri Trang in China, 2011-2016
Sri Trang’s Sales Share in China’s Total Natural Rubber Import Volume, 2012-2015
Global Market Share of Sri Trang
Main Development Strategies of Sri Trang
Revenue and Net Income of TRUBB, 2008-2016
Subsidiaries of TRUBB by Business, 2016
Revenue Structure of TRUBB by Business, 20131-2016
Capacity of TRUBB by Business, 2013-2015
Sales Volume of TRUBB by Business, 2012-2013
Main Product Competitive Strategies of TRUBB
Sales Channels of TRUBB's Main Business Divisions, 2016
TRUBB’s Revenue from China, 2012-2015
Factories and Capacity of Thai Hua Rubber Public Company Ltd., 2016
Natural Rubber Capacityby Product of Thai Hua Rubber Public Company Ltd., 2016
Distribution of Von Bundit’s Affiliated Companies, 2016
Capacity of Von Bundit by Product, 2013-2015
Natural Rubber Capacity of Von Bundit by Factory, 2015
Global Development Events of Southland Rubber, 1999-2016
Capacity of Southland Rubber by Product, 2015-2016
Capacity of Southland Rubber by Factory, 2016
Revenue and Net Income of Hainan Rubber Group, 2008-2016
Operating Revenue Structure of Hainan Rubber Group by Product, 2012-2015
Operating Revenue of Hainan Rubber Group by Region, 2009-2015
Gross Margin of Hainan Rubber Group by Product, 2009-2015
Natural Rubber Output of Hainan Rubber Group by Channel, 2010-2015
Sales Volume and YoY Growth of Hainan Rubber Group, 2008-2015
Industry Chain Layout of Hainan Rubber Group, 2016
New Planting Area of Hainan Rubber Group’s Special Rubber Plantations, 2016-2020E
Supporting Shelterbelt Area of Hainan Rubber Group’s Special Rubber Plantations, 2016-2020E
Revenue and Net Income of Hainan Rubber Group, 2015-2020E
Revenue and Net Income of Sinochem International, 2008-2016
Operating Revenue Structure of Sinochem International by Business, 2015
Revenue of Sinochem International by Region, 2012-2015
Gross Margin of Sinochem International by Business, 2009-2015
Natural Rubber Revenue and Operating Cost of Sinochem International, 2009-2015
Natural Rubber Capacity of Sinochem International, 2010-2015
Natural Rubber Output and Sales Volume of Sinochem International, 2011-2016
Revenue and Net Income of Yunnan State Farms Group, 2012-2016
Operating Revenue Structure of Yunnan State Farms Group by Business, 2014-2015
Natural Rubber Planting Area, Tapping Area and Tapping Rate of Yunnan State Farms Group, 2012-2015
Natural Rubber Procurement Volume, Purchase Cost and Average Price of Yunnan State Farms Group, 2012-2015
Rubber Processing Capacity of Yunnan State Farms Group by Factory, 2016
Natural Rubber Capacity and Output of Yunnan State Farms Group by Product, 2012-2016
Natural Rubber Revenue and Structure of Yunnan State Farms Group by Product, 2012-2015
Natural Rubber Sales Volume and Structure of Yunnan State Farms Group by Sales Channel, 2012-2015
Major Overseas Subsidiaries of Guangdong Guangken Rubber Group
Revenue and YoY Growth of Rubber Companies of Guangdong Guangken Rubber Group, 2010-2016
Natural Rubber Revenue of Guangdong Guangken Rubber Group by Region, 2013-2016
Natural Rubber Procurement Volume and Price of Guangdong Guangken Rubber Group by Region, 2013-2016
Rubber Capacity and Output of Guangdong Guangken Rubber Group by Product, 2013-2016
Sales Volume and Revenue of Rubber Companies of Guangdong Guangken Rubber Group by Product/Region, 2013-2015
Major Rubber Projects Planned/under Construction of Guangdong Guangken Rubber Group, by the end of Mar 2016
Revenue and Net Income of Gaoshen Rubber, 2013-2016
Operating Revenue Structure of Gaoshen Rubber by Region, 2013-2015
Capacity and Output of Gaoshen Rubber by Factory, 2013-2015
Natural Rubber Sales Volume of Gaoshen Rubber by Product, 2013-2014
Name List and Revenue Contribution of Gaoshen Rubber’s Top 5 Clients, 2016H1
Global and China Synthetic Rubber Industry Report, 2021-2027
Synthetic rubber is a polymer product made of coal, petroleum and natural gas as main raw materials and polymerized with dienes and olefins as monomers, which is typically divided into general synthet...
Global and China Carbon Fiber Industry Report, 2021-2026
Carbon fiber is a kind of inorganic high performance fiber (with carbon content higher than 90%) converted from organic fiber through heat treatment. As a new material with good mechanical properties,...
China Coal Tar Industry Report, 2020-2025
Coal tar is a thick dark liquid which is a by-product of the production of coke and coal gas from coal. It can be classified by the dry distillation temperature into low-temperature coal tar, medium-t...
Global and China Dissolving Pulp Industry Report, 2019-2025
In 2018, global dissolving pulp capacity outstripped 10 million tons and its output surged by 14.0% from a year ago to 7.07 million tons, roughly 70% of the capacity. China, as a key supplier of disso...
Global and China 1, 4-butanediol (BDO) Industry Report, 2019-2025
1,4-butanediol (BDO), an essential organic and fine chemical material, finds wide application in pharmaceuticals, chemicals, textile and household chemicals.
As of the end of 2018, the global BDO cap...
Global and China Carbon Fiber and CFRP Industry Report, 2019-2025
Among the world’s three major high performance fibers, carbon fiber features the highest strength and the highest specific modulus. It is widely used in such fields as aerospace, sports and leisure.
...
Global and China Natural Rubber Industry Report, 2019-2025
In 2018, global natural rubber industry continued remained at low ebb, as a result of economic fundamentals. Global natural rubber price presented a choppy downtrend and repeatedly hit a record low in...
Global and China Ultra High Molecular Weight Polyethylene (UHMWPE) Industry Report, 2019-2025
Ultra high molecular weight polyethylene (UHMWPE), a kind of linear polyethylene with relative molecular weight of above 1.5 million used as an engineering thermoplastic with excellent comprehensive p...
China Polyether Monomer Industry Report, 2019-2025
China has seen real estate boom and issued a raft of policies for continuous efforts in improving weak links in infrastructure sector over the years. Financial funds of RMB1,663.2 billion should be al...
Global and China Needle Coke Industry Report, 2019-2025
Needle coke with merits of good orientation and excellent conductivity and thermal conductivity, is mainly used in graphite electrodes for electric steelmaking and lithium battery anode materials.
A...
Global and China Viscose Fiber Industry Report, 2019-2025
Over the recent years, the developed countries like the United States, Japan and EU members have withdrawn from the viscose fiber industry due to environmental factor and so forth, while the viscose f...
China Coal Tar Industry Report: Upstream (Coal, coke), Downstream (Phenol Oil, Industrial Naphthalene, Coal Tar Pitch), 2019-2025
Coal tar is a key product in coking sector. In 2018, China produced around 20 million tons of coal tar, a YoY drop of 2.4% largely due to a lower operating rate of coal tar producers that had to be su...
Global and China Synthetic Rubber (BR, SBR, EPR, IIR, NBR, Butadiene, Styrene, Rubber Additive) Industry Report, 2018-2023
In 2018, China boasted a total synthetic rubber capacity of roughly 6,667kt/a, including 130kt/a new effective capacity. Considering capacity adjustment, China’s capacity of seven synthetic rubbers (B...
Global and China Dissolving Pulp Industry Report, 2018-2022
With the commissioning of new dissolving pulp projects, the global dissolving pulp capacity had been up to about 8,000 kt by the end of 2017. It is worth noticing that the top six producers including ...
Global and China Carbon Fiber and CFRP Industry Report, 2018-2022
As a new generation of reinforced fiber boasting intrinsic properties of carbon material and excellent processability of textile fiber, carbon fiber is the one with the highest specific strength and s...
Global and China Ultra High Molecular Weight Polyethylene (UHMWPE) Industry Report, 2017-2021
Ultra High Molecular Weight Polyethylene (UHMWPE), a kind of linear polyethylene with relative molecular weight of above 1.5 million and an engineering thermoplastic with excellent comprehensive prope...
China Coal Tar Industry Report, 2017-2021
Coal tar, one of by-products in raw coal gas generated from coal pyrolysis in coking industry, accounts for 3%-4% of the output of coal as fired and is a main raw material in coal chemical industry.
...
Global and China Aramid Fiber Industry Report, 2017-2021
Global aramid fiber output totaled 115kt with capacity utilization of 76.0% in 2016. As industries like environmental protection and military develop, the output is expected to rise to 138kt and capac...