China Pesticide Industry Report, 2016-2020
-
Nov. 2016
- Hard Copy
- USD
$2,700
-
- Pages:171
- Single User License
(PDF Unprintable)
- USD
$2,500
-
- Code:
ZLC040
- Enterprise-wide License
(PDF Printable & Editable)
- USD
$3,900
-
- Hard Copy + Single User License
- USD
$2,900
-
China’s pesticide industry has weathered the rough time of “overcapacity, market downturn, weak demand, price decline, stringent environmental policies, and fierce competition” over the past two years. Due to a greater pressure from safety production and environmental protection, rising costs, tepid domestic and foreign demands, and prohibition of and restrictions on highly toxic pesticides, the industry has been running with lower product prices. Overall, the pesticide enterprises now make meager profits or barely break even.
China produced 3.741 million tons and sold 3.495 million tons of chemical pesticide APIs in 2015, edging down 0.1% and 2.2% from a year ago, respectively. In addition, output of pesticide preparations represented by herbicides, insecticides, and bactericides all fell over the same period in 2014, standing at 1.774 million tons, 514,000 tons, and 182,000 tons, down 1.6%,8.5%and 20.8% respectively against the previous year.
Jiangsuis the country’s largest pesticide production base, not only the largest API producing region but also a major production region of herbicides, insecticides, and bactericides. The province produced 1.055 million tons of pesticide APIs, 419,000 tons of herbicides, 205,000 tons of insecticides, and 91,000 tons of bactericides in 2015, making up 28.2%, 23.6%,39.8%, and 49.7% of the country’s total, respectively.
The Action Program for Zero Growth of Pesticide Utilization by 2020 issued by the MoA in 2015 specifies that pesticide utilization will be effectively controlled and new pesticides vigorously promoted so as to reduce consumption and harm of pesticides.The country’s pesticide production and sales will maintain slight growth over a period of time, with chemical pesticide APIs reaching an estimated 3.768 million tons in production and 3.628 million tons in sales in 2020, respectively.
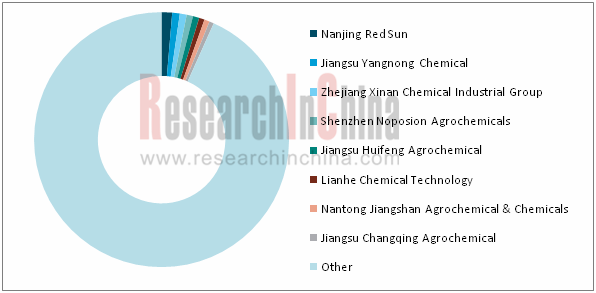
There are about 1,800 pesticide producers in China, represented by Nanjing Red Sun, Jiangsu Yangnong Chemical, Zhejiang Xinan Chemical Industrial Group, Shenzhen Noposion Agrochemicals, and Jiangsu Huifeng Agrochemical. The country’s No. 1 pesticide enterprise hasless than a 2 percent market share, showing a very low market concentration. As a series of measures on closing down backward production facilities and encouraging corporate merger and restructuring are implemented, the Chinese pesticide market concentration is expected to improve gradually.
Market Share of Major Pesticide Enterprises in China, 2016H1
 ?
?
Source: ResearchInChina
With introduction of support policies including new environmental policy and the Planning for the Development of Pesticide Industry during the 13th Five-Year Plan Period,a quick penetration of new formats like agricultural inputs E-commerce and “Internet + agriculture”, and rapid development of new models (farmers’ cooperative, crop solutions), the pesticide industry will see an accelerated elimination of backward capacity, constantly enhanced industrial transformation and upgrading, and an increased industry concentration.
China Pesticide Industry Report, 2016-2020 highlights the following:
 Pesticide industry in China (production & sales, import & sales, operation, competitive landscape, etc.);
Development environments (regulatory policies, industry policies, upstream & downstream sectors, etc.);
Development trends;
16 major pesticide enterprises (operation, pesticide business, forecast & outlook, etc.)
1. Overview of Pesticide Industry
1.1 Definition
1.2 Classification
1.3 Industry Chain
2. Status Quo of China Pesticide Industry
2.1 Production
2.1.1 Pesticide APIs
2.1.2 Pesticide Preparations
2.1.3 Production by Province/City
2.2 Sales
2.3 Import & Export
2.3.1 Import
2.3.2 Export
2.3.3 Import & Export Prices
2.4 Operation
2.4.1 Number of Enterprises
2.4.2 Revenue
2.4.3 Profit
2.5 Competition Pattern
2.5.1 Global Market
2.5.2 Chinese Market
2.6 Entry Barriers
2.6.1 Strict Administrative Licensing
2.6.2 Higher Capital Barrier
2.6.3 Environmental Barriers
2.6.4 Obstacles in Introducing Advanced Technologies
2.6.5 Market Entry Barriers
3. Development Environment of China Pesticide Industry
3.1 Policy Environment
3.1.1 Regulatory Policy
3.1.2 Industry Policy
3.2 Upstream and Downstream Sectors
3.2.1 Upstream
3.2.2 Downstream
4. Trends of China Pesticide Industry
4.1 Overview
4.2 Pesticide API Capacity Transferring to China
4.2.1 Chinese Players Specializing in “Generic Drugs”
4.2.2 Low-cost Edge Backing Industry Transferring
4.3 Rising Boom of Pesticide Stimulating Industry Growth
4.4Supply and Demand
4.4.1 Accelerated Industrial Integration, Improved Supply Capabilities
4.4.2 Pesticide Product Mix Will Be Gradually Optimized
4.4.3 Steady Growth in Domestic and Overseas Demand from Pesticide Market
4.5 Policy Tendency
4.5.1 Further Policies to Be Tightened
4.5.2 Environmental Protection Management is Becoming Normalized and Internationalized
4.6 Herbicide and Bactericide are More Potential than Insecticide in the Long-term Development
5. Major Chinese Pesticide Players
5.1 Nanjing Red Sun
5.1.1 Profile
5.1.2 Operation
5.1.3 Revenue Structure
5.1.4 Gross Margin
5.1.5 R&D
5.1.6 Pesticide Business
5.1.7 Forecast and Outlook
5.2 Nantong Jiangshan Agrochemical & Chemicals
5.2.1 Profile
5.2.2 Operation
5.2.3 Revenue Structure
5.2.4 Gross Margin
5.2.5 R&D
5.2.6 Pesticide Business
5.2.7 Forecast and Outlook
5.3 Lier Chemical
5.3.1 Profile
5.3.2 Operation
5.3.3 Revenue Structure
5.3.4 Gross Margin
5.3.5 R&D
5.3.6 Pesticide Business
5.3.7 Forecast and Outlook
5.4 Jiangsu Yangnong Chemical Co., Ltd.
5.4.1 Profile
5.4.2 Operation
5.4.3 Revenue Structure
5.4.4 Gross Margin
5.4.5 R&D
5.4.6 Pesticide Business
5.4.7 Forecast and Outlook
5.5 Jiangsu Changqing Agrichemical
5.5.1 Profile
5.5.2 Operation
5.5.3 Revenue Structure
5.5.4 Gross Margin
5.5.5 R&D
5.5.6 Pesticide Business
5.5.7 Forecast and Outlook
5.6 Zhejiang Xin’an Chemical Industrial Group
5.6.1 Profile
5.6.2 Operation
5.6.3 Revenue Structure
5.6.4 Gross Margin
5.6.5 R&D
5.6.6 Pesticide Business
5.6.7 Forecast and Outlook
5.7 Zhejiang ShenghuaBiok Biology
5.7.1 Profile
5.7.2 Operation
5.7.3 Revenue Structure
5.7.4 Gross Margin
5.7.5 R&D
5.7.6 Pesticide Business
5.7.7 Forecast and Outlook
5.8 Hubei Sanonda Co., Ltd.
5.8.1 Profile
5.8.2 Operation
5.8.3 Revenue Structure
5.8.4 Gross Margin
5.8.5 R&D
5.8.6 Pesticide Business
5.8.7 Forecast and Outlook
5.9 Jiangsu Huifeng Agrochemical Co., Ltd.
5.9.1 Profile
5.9.2 Operation
5.9.3 Revenue Structure
5.9.4 Gross Margin
5.9.5 R&D
5.9.6 Pesticide Business
5.9.7 Forecast and Outlook
5.10 Hunan Haili
5.10.1 Profile
5.10.2 Operation
5.10.3 Revenue Structure
5.10.4 Gross Margin
5.10.5 R&D
5.10.6 Pesticide Business
5.10.7 Forecast and Outlook
5.11 Limin Chemical
5.11.1 Profile
5.11.2 Operation
5.11.3 Revenue Structure
5.11.4 Gross Margin
5.11.5 R&D
5.11.6 Pesticide Business
5.11.7 Forecast and Outlook
5.12 Lianhe Chemical Technology
5.12.1 Profile
5.12.2 Operation
5.12.3 Revenue Structure
5.12.4 Gross Margin
5.12.5 R&D
5.12.6 Pesticide Business
5.12.7 Forecast and Outlook
5.13 Lanfeng Biochemical
5.13.1 Profile
5.13.2 Operation
5.13.3 Revenue Structure
5.13.4 Gross Margin
5.13.5 R&D
5.13.6 Pesticide Business
5.13.7 Forecast and Outlook
5.14 Noposion Corporation
5.14.1 Profile
5.14.2 Operation
5.14.3 Revenue Structure
5.14.4 Gross Margin
5.14.5 R&D
5.14.6 Pesticide Business
5.14.7 Forecast and Outlook
5.15 ENN
5.15.1 Profile
5.15.2 Operation
5.15.3 Revenue Structure
5.15.4 Gross Margin
5.15.5 R&D
5.15.6 Pesticide Business
5.15.7 Forecast and Outlook
5.16 Sichuan Guoguang Agrochemical
5.16.1 Profile
5.16.2 Operation
5.16.3 Revenue Structure
5.16.4 Gross Margin
5.16.5 R&D
5.16.6 Pesticide Business
5.16.7 Forecast and Outlook
Classification and Main Varieties of Pesticides
Pesticide Industry Chain
Production of Chemical Pesticide APIs (Equivalent to 100% Active Ingredient) in China, 2006-2016
Production of Major Pesticide Preparations in China by Type, 2006-2016
Production of Chemical Pesticide APIs (Equivalent to 100% Active Ingredient) in China by Region, 2015
Output Structure of Chemical Pesticide APIs (Equivalent to 100% Active Ingredient) in China by Region, 2015
China’s Herbicide Production by Region, 2015
China’s Herbicide Production Structure by Region, 2015
China’s Insecticide Production by Region, 2015
China’s Insecticide Production Structure by Region, 2015
China’s Bactericide Production by Region, 2015
China’s Bactericide Production Structure by Region, 2015
Sales Volume of Chemical Pesticide APIs (Equivalent to 100% Active Ingredient) in China, 2006-2016
China’s Import Volume of Pesticides, 2010-2016
China’s Import Value of Pesticides, 2010-2016
China’s Export Volume of Pesticides, 2010-2016
China’s Export Value of Pesticides, 2010-2016
Import and Export Prices of Pesticides in China, 2010-2016
Number of Enterprises in China Pesticide Industry, 2006-2016
Proportion of Loss-generating Enterprises in China Pesticide Industry, 2006-2016
Operating Revenue of China Pesticide Industry, 2006-2016
Total Profit of China Pesticide Industry, 2006-2016
Profit Margin of China Pesticide Industry, 2006-2016
Gross Margin of Pesticide Business of Major Companies in China Pesticide Industry, 2013-2016
Global Top 20 Pesticide Manufacturers, 2015
Revenue of Major Pesticide Companies in China, 2011-2016
Net Income of Major Pesticide Enterprises in China, 2011-2016
Pesticide Revenue of Major Pesticide Companies in China, 2013-2016
Market Share of Major Pesticide Companies in China, 2013-2016
Pesticide Output of Major Pesticide Companies in China, 2013-2015
Pesticide Sales Volume of Major Pesticide Companies in China, 2013-2015
Pesticide Enterprises Listed and to Be Listed and Their Fund-Raising Projects, 2015
Regulatory Policies and Main Content in China Pesticide Industry
Major Policies on China Pesticide Industry, 2005-2016
Output of Chemical Pesticide API (100% Effective Ingredients) in China, 2015-2020E
Sales Volume of Chemical Pesticide API (100% Effective Ingredients) in China, 2015-2020E
Pesticide Patented Products Expired in China, 2013-2017
Key Merger and Reorganization Events in China Pesticide Industry, 2008-2015
Companies (1-7 Batches) Voluntarily Renouncing Pesticide Production Qualification in China, 2016
Comparison between New Version Pesticide Management Regulations (Draft) and Old Version
Development Targets of the Development Plan for Pesticide Industry in the Thirteenth Five-Year Plan Period
International Treaties in Global Pesticide Industry
Chinese Pesticide-related Environmental Policies
Revenue and Net Income of Nanjing Red Sun, 2011-2016
Revenue of Nanjing Red Sun by Product, 2013-2016
Revenue Structure of Nanjing Red Sun by Product, 2013-2016
Revenue of Nanjing Red Sun by Region, 2013-2016
Revenue Structure of Nanjing Red Sun by Region, 2013-2016
Gross Margin of Nanjing Red Sun, 2013-2016
R&D Costs of Nanjing Red Sun, 2013-2016
Pyridine Base Industry Chain of Nanjing Red Sun
Hydrocyanic Acid Industry Chain of Nanjing Red Sun
Pyrethroid Industry Chain of Nanjing Red Sun
Capacity of Nanjing Red Sun by Product
Performance of major subsidiaries of Nanjing Red Sun, 2015-2016
Revenue and Net Income of Nanjing Red Sun, 2015-2020E
Revenue and Net Income of Nantong Jiangshan Agrochemical & Chemicals, 2011-2016
Revenue of Nantong Jiangshan Agrochemical & Chemicals by Product, 2013-2016
Revenue Structure of Nantong Jiangshan Agrochemical & Chemicals by Product, 2013-2016
Revenue of Nantong Jiangshan Agrochemical & Chemicals by Region, 2013-2016
Revenue Structure of Nantong Jiangshan Agrochemical & Chemicals by Region, 2013-2016
Gross Margin of Nantong Jiangshan Agrochemical & Chemicals by Product, 2013-2016
R&D Costs and % of Total Revenue of Nantong Jiangshan Agrochemical & Chemicals, 2013-2016
Pesticide Output and Sales Volume of Nantong Jiangshan Agrochemical & Chemicals, 2013-2015
Revenue and Net Income of Nantong Jiangshan Agrochemical & Chemicals, 2015-2020E
Revenue and Net Income of Lier Chemical, 2011-2016
Revenue of Lier Chemical by Product, 2013-2016
Revenue Structure of Lier Chemical by Product, 2013-2016
Revenue of Lier Chemical by Region, 2013-2016
Revenue Structure of Lier Chemical by Region, 2013-2016
Gross Margin of Lier Chemical by Product, 2013-2016
R&D Costs and % of Total Revenue of Lier Chemical, 2013-2016
Pesticide Output and Sales Volume of Lier Chemical, 2012-2015
Glufosinate Capacity of Lier Chemical, 2012-2017E
Revenue and Net Income of Jiangsu Kuaida Agrochemical, 2013-2016
Revenue and Net Income of Lier Chemical, 2015-2020E
Revenue and Net Income of Jiangsu Yangnong Chemical, 2011-2016
Revenue Breakdown of Jiangsu Yangnong Chemical by Product, 2013-2016
Revenue Structure of Jiangsu Yangnong Chemical by Product, 2013-2016
Revenue Breakdown of Jiangsu Yangnong Chemical by Region, 2013-2016
Revenue Structure of Jiangsu Yangnong Chemical by Region, 2013-2016
Gross Margin of Jiangsu Yangnong Chemical by Product, 2013-2016
R&D Costs and % of Total Revenue of Jiangsu Yangnong Chemical, 2013-2016
Output and Sales Volume of Pesticide Products of Jiangsu Yangnong Chemical, 2012-2015
Capacity of Main Pesticide Products of Jiangsu Yangnong Chemical
Revenue and Net Income of Major Subsidiaries of Jiangsu Yangnong Chemical, 2014-2016
Revenue and Net Income of Jiangsu Yangnong Chemical, 2015-2020E
Revenue and Net Income of Jiangsu Changqing Agrichemical, 2011-2016
Revenue Breakdown of Jiangsu Changqing Agrichemical by Product, 2013-2016
Revenue Structure of Jiangsu Changqing Agrichemical by Product, 2013-2016
Revenue Breakdown of Jiangsu Changqing Agrichemical by Region, 2013-2016
Revenue Structure of Jiangsu Changqing Agrichemical by Region, 2013-2016
Gross Margin of Jiangsu Changqing Agrichemical by Product, 2013-2016
R&D Costs and % of Total Revenue of Jiangsu Changqing Agrichemical, 2013-2016
Output and Sales Volume of Pesticide Products of Jiangsu Changqing Agrichemical, 2014-2015
Revenue and Net Income of Major Subsidiaries of Jiangsu Changqing Agrichemical, 2015
Revenue and Net Income of Jiangsu Changqing Agrichemical, 2015-2020E
Revenue and Net Income of Zhejiang Xin’an Chemical Industrial Group, 2011-2016
Revenue Breakdown of Zhejiang Xin’an Chemical Industrial Group by Product, 2013-2016
Revenue Structure of Zhejiang Xin’an Chemical Industrial Group by Product, 2013-2016
Revenue Breakdown of Zhejiang Xin’an Chemical Industrial Group by Region, 2013-2016
Revenue Structure of Zhejiang Xin’an Chemical Industrial Group by Region, 2013-2016
Gross Margin of Zhejiang Xin’an Chemical Industrial Group by Product, 2013-2016
R&D Costs and % of Total Revenue of Zhejiang Xin’an Chemical Industrial Group, 2013-2016
Pesticide Output and Sales Volume of Zhejiang Xin’an Chemical Industrial Group, 2013-2015
Revenue and Net Income of Zhejiang Xin’an Chemical Industrial Group, 2015-2020E
Revenue and Net Income of Zhejiang ShenghuaBiok Biology, 2011-2016
Revenue Breakdown of Zhejiang ShenghuaBiok Biology by Product, 2013-2016
Revenue Structure of Zhejiang ShenghuaBiok Biology by Product, 2013-2016
Revenue Breakdown of Zhejiang ShenghuaBiok Biology by Region, 2013-2016
Revenue Structure of Zhejiang ShenghuaBiok Biology by Region, 2013-2016
Gross Margin of Zhejiang ShenghuaBiok Biology by Product, 2013-2016
R&D Costs and % of Total Revenue of Zhejiang ShenghuaBiok Biology, 2013-2016
Revenue and Net Income of Zhejiang ShenghuaBiok Biology, 2015-2020E
Main Product System of Hubei Sanonda
Revenue and Net Income of Hubei Sanonda, 2011-2016
Revenue Breakdown of Hubei Sanonda by Product, 2013-2016
Revenue Breakdown of Hubei Sanonda by Region, 2013-2016
Gross Margin of Hubei Sanonda by Product, 2013-2016
R&D Costs and % of Total Revenue of Hubei Sanonda, 2013-2016
Capacity of Main Products of Hubei Sanonda
Operating Results of Main Subsidiaries of Hubei Sanonda, 2015
Revenue and Net Income of Hubei Sanonda, 2015-2020E
Revenue and Net Income of Jiangsu Huifeng Agrochemical, 2011-2016
Revenue Breakdown of Jiangsu Huifeng Agrochemical by Product, 2013-2015
Revenue Structure of Jiangsu Huifeng Agrochemical by Product, 2013-2015
Revenue Structure of Jiangsu Huifeng Agrochemical by Product, 2016H1
Revenue Breakdown of Jiangsu Huifeng Agrochemical by Region, 2013-2016
Revenue Structure of Jiangsu Huifeng Agrochemical by Region, 2013-2016
Gross Margin of Jiangsu Huifeng Agrochemical by Product, 2013-2015
R&D Costs and % of Total Revenue of Jiangsu Huifeng Agrochemical, 2013-2016
Capacity of Main Pesticide Products of Jiangsu Huifeng Agrochemical
Output and Sales Volume of Agrochemical Products of Jiangsu Huifeng Agrochemical, 2014-2015
Revenue and Net Income of Jiangsu Huifeng Agrochemical, 2015-2020E
Revenue and Net Income of Hunan Haili Chemical, 2011-2016
Revenue of Hunan Haili Chemical by Product, 2013-2016
Revenue Structure of Hunan Haili Chemical by Product, 2013-2016
Revenue of Hunan Haili Chemical by Region, 2013-2016
Revenue Structure of Hunan Haili Chemical by Region, 2013-2016
Gross Margin of Hunan Haili Chemical by Product, 2013-2016
R&D Costs and % of Total Revenue of Hunan Haili Chemical, 2013-2016
Pesticide Output and Sales Volume of Hunan Haili Chemical, 2013-2015
Revenue and Net Income of Hunan Haili Chemical, 2015-2020E
Revenue and Net Income of Limin Chemical, 2011-2016
Revenue of Limin Chemical by Product, 2014-2016
Revenue Structure of Limin Chemical by Product, 2014-2016
Revenue of Limin Chemical by Region, 2013-2016
Revenue Structure of Limin Chemical by Region, 2013-2016
Gross Margin of Limin Chemical by Product, 2014-2016
R&D Costs and % of Total Revenue of Limin Chemical, 2013-2016
Output and Sales Volume of Major Products of Limin Chemical, 2013-2015
Overseas Layout of Limin Chemical
Revenue and Net Income of Limin Chemical, 2015-2020E
Production Bases of Lianhe Chemical Technology
Revenue and Net Income of Lianhe Chemical Technology, 2011-2016
Revenue of Lianhe Chemical Technology by Product, 2013-2016
Revenue Structure of Lianhe Chemical Technology by Product, 2013-2016
Revenue of Lianhe Chemical Technology by Region, 2013-2016
Revenue Structure of Lianhe Chemical Technology by Region, 2013-2016
Gross Margin of Lianhe Chemical Technology by Product, 2013-2016
R&D Costs and % of Total Revenue of Lianhe Chemical Technology, 2013-2016
Pesticide Output and Sales Volume of Lianhe Chemical Technology, 2012-2015
Revenue and Net Income of Lianhe Chemical Technology, 2014-2020E
Revenue and Net Income of Lanfeng Biochemical, 2011-2016
Revenue of Lanfeng Biochemical by Product, 2013-2016
Revenue of Lanfeng Biochemical by Product, 2013-2016
Revenue of Lanfeng Biochemical by Region, 2013-2016
Revenue Structure of Lanfeng Biochemical by Region, 2013-2016
Gross Margin of Lanfeng Biochemical by Product, 2013-2016
R&D Costs and % of Total Revenue of Lanfeng Biochemical, 2013-2016
Pesticide Output and Sales Volume of Lanfeng Biochemical, 2012-2015
Revenue and Net Income of Lanfeng Biochemical, 2015-2020E
Revenue and Net Income of Noposion, 2011-2016
Revenue of Noposion by Product, 2013-2016
Revenue Structure of Noposion by Product, 2013-2016
Revenue of Noposion by Region, 2013-2016
Revenue Structure of Noposion by Region, 2013-2016
Gross Margin of Noposion by Product, 2013-2016
R&D Costs and % of Total Revenue of Noposion, 2013-2016
Revenue and Net Income of Noposion, 2015-2020E
ENN’s Main Layout
Revenue and Net Income of ENN, 2011-2016
Revenue of ENN by Product, 2013-2016
Revenue Structure of ENN by Product, 2013-2016
Revenue of ENN by Region, 2013-2016
Revenue Structure of ENN by Region, 2013-2016
Gross Margin of ENN by Product, 2013-2016
R&D Costs and % of Total Revenue of ENN, 2013-2016
Pesticide Output and Sales Volume of ENN, 2012-2015
Operation of Pesticide-related Subsidiaries of ENN, 2015 (Unit: RMB mln)
Revenue and Net Income of ENN, 2015-2020E
Main Products of Guoguang Agrochemical
Revenue and Net Income of Sichuan Guoguang Agrochemical, 2011-2016
Revenue of Sichuan Guoguang Agrochemical by Product, 2013-2016
Revenue Structure of Sichuan Guoguang Agrochemical by Product, 2013-2016
Revenue Structure of Sichuan Guoguang Agrochemical by Region, 2013-2016
Gross Margin of Sichuan Guoguang Agrochemical by Product, 2014-2016
R&D Costs of Sichuan Guoguang Agrochemical, 2013-2016
Progress of Fund-raising Projects of Sichuan Guoguang Agrochemical as of H1 2016
Capacity of Major API and Preparation Products of Sichuan Guoguang Agrochemical
Output and Sales Volume of Pesticide Products of Sichuan Guoguang Agrochemical, 2014-2015
Revenue and Net Income of Sichuan Guoguang Agrochemical, 2015-2020E
Global and China Synthetic Rubber Industry Report, 2021-2027
Synthetic rubber is a polymer product made of coal, petroleum and natural gas as main raw materials and polymerized with dienes and olefins as monomers, which is typically divided into general synthet...
Global and China Carbon Fiber Industry Report, 2021-2026
Carbon fiber is a kind of inorganic high performance fiber (with carbon content higher than 90%) converted from organic fiber through heat treatment. As a new material with good mechanical properties,...
China Coal Tar Industry Report, 2020-2025
Coal tar is a thick dark liquid which is a by-product of the production of coke and coal gas from coal. It can be classified by the dry distillation temperature into low-temperature coal tar, medium-t...
Global and China Dissolving Pulp Industry Report, 2019-2025
In 2018, global dissolving pulp capacity outstripped 10 million tons and its output surged by 14.0% from a year ago to 7.07 million tons, roughly 70% of the capacity. China, as a key supplier of disso...
Global and China 1, 4-butanediol (BDO) Industry Report, 2019-2025
1,4-butanediol (BDO), an essential organic and fine chemical material, finds wide application in pharmaceuticals, chemicals, textile and household chemicals.
As of the end of 2018, the global BDO cap...
Global and China Carbon Fiber and CFRP Industry Report, 2019-2025
Among the world’s three major high performance fibers, carbon fiber features the highest strength and the highest specific modulus. It is widely used in such fields as aerospace, sports and leisure.
...
Global and China Natural Rubber Industry Report, 2019-2025
In 2018, global natural rubber industry continued remained at low ebb, as a result of economic fundamentals. Global natural rubber price presented a choppy downtrend and repeatedly hit a record low in...
Global and China Ultra High Molecular Weight Polyethylene (UHMWPE) Industry Report, 2019-2025
Ultra high molecular weight polyethylene (UHMWPE), a kind of linear polyethylene with relative molecular weight of above 1.5 million used as an engineering thermoplastic with excellent comprehensive p...
China Polyether Monomer Industry Report, 2019-2025
China has seen real estate boom and issued a raft of policies for continuous efforts in improving weak links in infrastructure sector over the years. Financial funds of RMB1,663.2 billion should be al...
Global and China Needle Coke Industry Report, 2019-2025
Needle coke with merits of good orientation and excellent conductivity and thermal conductivity, is mainly used in graphite electrodes for electric steelmaking and lithium battery anode materials.
A...
Global and China Viscose Fiber Industry Report, 2019-2025
Over the recent years, the developed countries like the United States, Japan and EU members have withdrawn from the viscose fiber industry due to environmental factor and so forth, while the viscose f...
China Coal Tar Industry Report: Upstream (Coal, coke), Downstream (Phenol Oil, Industrial Naphthalene, Coal Tar Pitch), 2019-2025
Coal tar is a key product in coking sector. In 2018, China produced around 20 million tons of coal tar, a YoY drop of 2.4% largely due to a lower operating rate of coal tar producers that had to be su...
Global and China Synthetic Rubber (BR, SBR, EPR, IIR, NBR, Butadiene, Styrene, Rubber Additive) Industry Report, 2018-2023
In 2018, China boasted a total synthetic rubber capacity of roughly 6,667kt/a, including 130kt/a new effective capacity. Considering capacity adjustment, China’s capacity of seven synthetic rubbers (B...
Global and China Dissolving Pulp Industry Report, 2018-2022
With the commissioning of new dissolving pulp projects, the global dissolving pulp capacity had been up to about 8,000 kt by the end of 2017. It is worth noticing that the top six producers including ...
Global and China Carbon Fiber and CFRP Industry Report, 2018-2022
As a new generation of reinforced fiber boasting intrinsic properties of carbon material and excellent processability of textile fiber, carbon fiber is the one with the highest specific strength and s...
Global and China Ultra High Molecular Weight Polyethylene (UHMWPE) Industry Report, 2017-2021
Ultra High Molecular Weight Polyethylene (UHMWPE), a kind of linear polyethylene with relative molecular weight of above 1.5 million and an engineering thermoplastic with excellent comprehensive prope...
China Coal Tar Industry Report, 2017-2021
Coal tar, one of by-products in raw coal gas generated from coal pyrolysis in coking industry, accounts for 3%-4% of the output of coal as fired and is a main raw material in coal chemical industry.
...
Global and China Aramid Fiber Industry Report, 2017-2021
Global aramid fiber output totaled 115kt with capacity utilization of 76.0% in 2016. As industries like environmental protection and military develop, the output is expected to rise to 138kt and capac...