Global and China Ethylene Oxide (EO) Industry Report, 2017-2021
-
Jul.2017
- Hard Copy
- USD
$2,700
-
- Pages:137
- Single User License
(PDF Unprintable)
- USD
$2,500
-
- Code:
ZHP061
- Enterprise-wide License
(PDF Printable & Editable)
- USD
$3,900
-
- Hard Copy + Single User License
- USD
$2,900
-
Ethylene oxide (EO) is one of the major derivatives of the ethylene industry. Featured with special reactivity, it can generate a series of fine chemical products for a wide range of applications.
In 2016, the global EO capacity was 34.5 million tons / a, with the CAGR of 4.3% in 2011-2016. It is estimated to grow at the annual average growth rate of around 2.0% in 2017-2021, lower than that in previous years because of overcapacity and the slowdown of downstream demand growth.
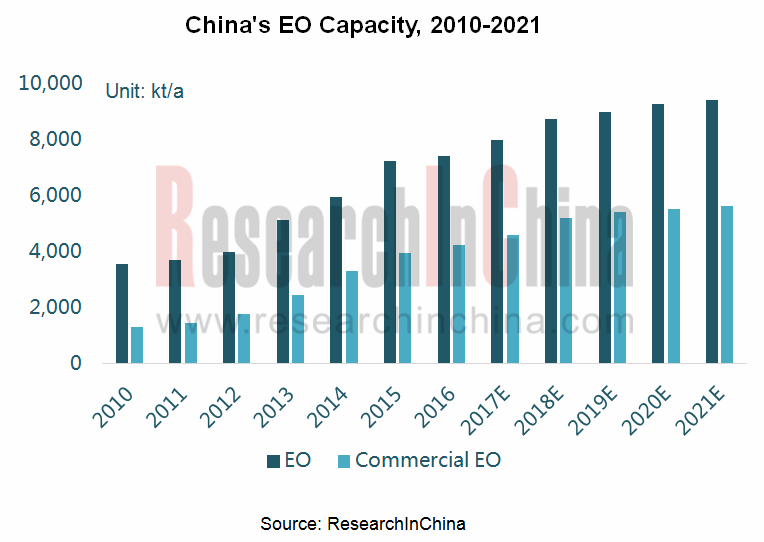
China is a leading EO supplier in the world, with the EO capacity of 7.43 million tons / a in 2016 (21.5% of the world's total) and the CAGR of 15.0% in 2011-2016, making it become the main driving force for the global EO capacity growth. Due to overcapacity and falling prices, the capacity growth has slowed down in the past two years significantly; the capacity is expected to hit 8 million tons / a in 2017 and 9.5 million tons / a in 2021.
In recent years, the development of China’s EO industry characterizes the following:
1, Commercial EO accounts for a higher proportion
In 2016, China's commercial EO (not used for glycol) capacity accounted for 56.9% of the total EO capacity, up 20.2 percentage points from 2010, mainly because:
1) China mainly exploited EO for the production of glycol in early time, while it has altered or built commercial EO-based capacity in recent years;
2) The demand of polyether-based superplasticizer for EO grew rapidly.
2, The market monopoly is gradually broken
Before 2010, more than 70% of China’s EO capacity concentrated in Sinopec and PetroChina. In recent years, the market share of these two tycoons has been gradually squeezed by private enterprises, foreign-funded enterprises and military enterprises. In 2016, the capacity contribution of Sinopec and PetroChina fell to about 50%.
3, The price stops dropping to stabilize
The overcapacity dragged down China's EO price after 2011, but the slowdown in capacity expansion has eased the price decline rate in the past two years, even with a slight rebound in 2016. In 2017, the EO price will rise at first and then fall under the impact of the fluctuating ethylene price, while the average price is expected to be the same with 2016.
4, The demand for fine chemical-use EO continues to grow
In 2016, China's demand for fine chemical-use commercial EO occupied about 40%, higher than the global average. Wherein, the market demand from polyether-based superplasticizer jumped the fastest, with the CAGR of up to 32.9% in 2011-2016, mainly thanks to the rapid development of China's rail transit engineering and nuclear power engineering.
The report covers the following:
 Definition, production technology, industrial chain, etc. of the EO industry;
Market size, market structure, competitive landscape, etc. of the global EO industry;
China’s EO market size, market structure, import & export, competitive pattern, market price, etc.;
Supply & demand, import & export, price and the like of the EO upstream industry (ethylene and ethanol);
Supply & demand, import & export, competitive pattern, price and the like of the EO downstream deep processing industry (glycol, nonionic surfactants, ethanolamine, polycarboxylate superplasticizer, taurine, etc.);
Operation, EO business, etc. of 3 foreign and 8 Chinese EO-related companies;
Operation, EO derivative business, etc. of 7 Chinese EO deep-processing enterprises.
1 Overview of EO
1.1 Definition
1.2 Production Technology
1.3 Industry Chain
2 Global EO Industry
2.1 Market Size
2.1.1 Supply
2.1.2 Demand
2.2 Market Structure
2.2.1 Capacity
2.2.2 Demand
2.3 Competitive Pattern
3 China EO Industry
3.1 Market Size
3.1.1 Supply
3.1.2 Demand
3.2 Market Structure
3.2.1 Capacity
3.2.2 Demand
3.3 Import and Export
3.4 Competitive Pattern
3.5 Price
4 EO Upstream Industry
4.1 Ethylene
4.1.1 Supply
4.1.2 Demand
4.1.3 Import and Export
4.1.4 Price
4.2 Ethanol
4.2.1 Supply and Demand
4.2.2 Import and Export
4.2.3 Price
5 EO Downstream Deep-processing
5.1 Glycol
5.1.1 Supply
5.1.2 Demand
5.1.3 Import and Export
5.1.4 Competitive Pattern
5.1.5 Price
5.2 Nonionic Surfactant
5.2.1 Supply
5.2.2 Demand
5.2.3 Import and Export
5.3 Polyether Monomer and Polycarboxylate Superplasticizer
5.3.1 Supply
5.3.2 Demand
5.3.3 Import and Export
5.3.3 Competitive Pattern
5.3.4 Price
5.3.5 Development Prospect
5.3.6 Polycarboxylate Superplasticizer
5.4 Polysilicon Cutting Fluid
5.4.1 Supply and Demand
5.4.2 Competitive Pattern
5.5 Ethanolamine
5.5.1 Supply
5.5.2 Demand
5.5.3 Price
5.6 Taurine
5.6.1 Supply and Demand
5.6.2 Competitive Pattern
6 Foreign EO Producers
6.1 Dow Chemical Company
6.1.1 Profile
6.1.2 Operation
6.1.3 EO Business
6.1.4 Development in China
6.2 SABIC
6.2.1 Profile
6.2.2 Operation
6.2.3 EO Business
6.3 Shell
6.3.1 Profile
6.3.2 Operation
6.3.3 EO Project
7 Chinese EO Producers
7.1 Sinopec Shanghai Petrochemical
7.1.1 Profile
7.1.2 Operation
7.1.3 Revenue Structure
7.1.4 Gross Margin
7.1.5 Clients and Suppliers
7.1.6 EO Business
7.1.7 Anticipation and Outlook
7.2 Sinopec Zhenhai Refining & Chemical
7.2.1 Profile
7.2.2 Operation
7.2.3 Ethylene Supporting EO Project
7.3 Sinopec Yangzi Petrochemical
7.3.1 Profile
7.3.2 EO Business
7.4 CNOOC and Shell Petrochemical (CSPC)
7.4.1 Profile
7.4.2 EO Business
7.5 CNPC Jilin Petrochemical
7.5.1 Profile
7.5.2 EO Business
7.6 BASF-YPC
7.6.1 Profile
7.6.2 Operation
7.6.3 EO Business
7.7 China North Chemical Industries Group
7.7.1 Profile
7.7.2 EO Business
7.8 China Sanjiang Fine Chemicals
7.8.1 Profile
7.8.2 Operation
7.8.3 Revenue Structure
7.8.4 Gross Margin
7.8.5 EO Business
7.8.6 Anticipation and Outlook
8 Chinese EO Deep-processing Enterprises
8.1 Liaoning Huaxing
8.1.1 Profile
8.1.2 Surfactant Business
8.2 Sasol (China)
8.2.1 Profile
8.2.2 Surfactant Business
8.3 Liaoning Oxiranchem
8.3.1 Profile
8.3.2 Operation
8.3.3 R & D
8.3.4 EO Derivative Business
8.3.5 Development Strategy
8.4 Kelong Fine Chemical
8.4.1 Profile
8.4.2 Operation
8.4.3 R & D
8.4.4 EO Derivative Business
8.5 Jiangsu Sobute
8.5.1 Profile
8.5.2 Superplasticizer Business
8.6 Xiamen Academy of Building Research Group
8.6.1 Profile
8.6.2 Operation
8.6.3 Revenue Structure
8.6.4 Gross Margin
8.6.5 R & D
8.6.6 Superplasticizer Business
8.7 Yongan Pharmaceutical
8.7.1 Profile
8.7.2 Operation
8.7.3 Revenue Structure
8.7.4 Gross Margin
8.7.5 R & D
8.7.6 Taurine Business
EO Industry Chain
Global EO Capacity, 2010-2021E
Global EO Consumption, 2010-2021E
Global EO Capacity Structure by Region, 2016
Global Refined EO Capacity Structure by Region, 2016
Commercial EO Capacity Structure in Major Regions Worldwide, 2016
Additional Refined EO Capacity in Major Regions Worldwide, 2018E
Global EO Demand Structure by Product, 2016
Global Commercial EO Demand Structure by Product, 2016
Capacity of EO and Commercial EO in China, 2010-2021E
Output of EO and Commercial EO in China, 2012-2021E
Capacity of EO and Commercial EO in China by Enterprise, by the end of 2016
Apparent Consumption of EO in China, 2010-2021E
Proportion of Commercial EO in China, 2005-2021E
Commercial EO Capacity Structure in China by Region, 2016
EO Demand Structure in China by Product, 2011/2016/2021E
Commercial EO Demand Structure in China by Product, 2016
EO Import/ Export Volume in China, 2009-2016
EO Import/ Export Value in China, 2009-2016
EO Export Volume Structure in China by Region, 2016
Net Import Volume of Main EO Downstream Products in China, 2008-2016
Competitive Pattern of Chinese EO Market, 2016
Competitive Pattern of Chinese Commercial EO Market, 2016
Revenue of EO and Derivative Producers in China, 2015-2016
Average Price of EO in Chinese Market, 2006-2017
Global Ethylene Capacity and Output, 2015-2020E
Global Ethylene Capacity Structure by Region, 2016
Global Ethylene Trade Trend, 2016
Ethylene Capacity Structure in China by Enterprise, 2016
Major New Ethylene Capacity Projects in China, 2016-2020E
China’s Ethylene Output, 2014-2016
Global Ethylene Demand Structure, 2015-2017
Apparent Consumption and Growth Rate of Ethylene in China, 2006-2017
Ethylene Demand Structure in China, 2015-2017
Ethylene Import/ Export Volume in China, 2009-2016
Average Import Price of Ethylene in China, 2009-2016
Ethylene Import Volume in China by Origins, 2016
Ethylene Export Volume in China by Destinations, 2016
Ethylene Price Trend in Foreign Countries, 2016
Regional Distribution of Ethanol Manufacturers in China
Ethanol Demand Structure in China by Product, 2016
Ethanol Import/Export Volume in China, 2009-2016
Average Import/Export Price of Ethanol in China, 2009-2016
Ethanol Import Volume in China by Origins, 2016
Ethanol Export Volume in China by Destinations, 2016
Ethanol Price Trend in China, 2017
EO Derivatives
Glycol–use EO Demand, 2016-2021E
Glycol Capacity and Growth Rate in China, 2008-2018E
Glycol Capacity Structure in China by Production Process, 2016
Capacity of Glycol Manufacturers in China, by 2016
New Glycol Capacity Delivery Plan in China, 2017-2019
China’s Glycol Output, 2010-2021E
Apparent Consumption of Glycol in China, 2010-2021E
Glycol Consumption Structure in China by Application, 2016
Glycol Import/Export Volume in China, 2009-2016
Average Import/Export Price of Glycol in China, 2009-2016
Glycol Import Volume in China by Origins, 2016
Glycol Export Volume in China by Destinations, 2016
Competitive Landscape of Chinese Glycol Market, 2016
Price Trend in Chinese Glycol Market, 2017
Nonionic Surfactant-use EO Demand in China, 2016-2021E
Output and Growth Rate of Surfactant in China, 2010-2021E
Surfactant Output Structure in China by Product, 2016
Output and Growth Rate of Nonionic Surfactant in China, 2010-2021E
Output Structure of Nonionic Surfactant in China by Product, 2016
Apparent Consumption of Nonionic Surfactant in China, 2010-2021E
Import/Export Volume of Nonionic Surfactant in China, 2009-2016
Import/Export Unit Price of Nonionic Surfactant in China, 2009-2016
Import Volume of Nonionic Surfactant in China by Origins, 2016
Export Volume of Nonionic Surfactant in China by Destinations, 2016
Demand for EO Used for Polycarboxylate Superplasticizer in China, 2016-2021E
Volume of Superplasticizer-use Polyether Monomer in China, 2009-2016
Share of Three Main Types of Polyether Monomer in Chinese Polycarboxylate Superplasticizer Market, 2010-2016
Output Structure of Superplasticizer-use Polyether Monomer in China by Province and Municipality, 2016
Demand Structure of Superplasticizer-use Polyether Monomer in China by Region, 2016
Demand Structure of Polyether Monomer in China by Province and Municipality, 2016
Import/Export Volume of Superplasticizer-use Polyether Monomer in China, 2009-2017
Market Share of Top 10 Superplasticizer-use Polyether Monomer Manufacturers in China, 2016
Output of Top 35 Superplasticizer-use Polyether Monomer Manufacturers in China, 2016
Price Trend of Polyether Monomer in China, 2011-2017
Price Trend of Polyether Monomer APEG in China, 2013-2017
Price Trend of Polyether Monomer TPEG (4C) in China, 2013-2017
Price Trend of Polyether Monomer TPEG (5C) in China, 2013-2016
Price Trend of Polyether Monomer MPEG in China, 2013-2016
Volume of Superplasticizer-use Polyether Monomer in China, 2017-2021E
Consumption and Growth Rate of Polycarboxylate Superplasticizer in China, 2007-2017
Polycarboxylate Superplasticizer Market Share in China by Consumption, 2006-2017
Sales Volume and Market Share of Top 10 Polycarboxylate Superplasticizer Manufacturers in China, 2016
Sales and Unit Price of Top 10 Polycarboxylate Superplasticizer Manufacturers in China, 2016
Position of Crystalline Silicon Cutting Fluid in PV Industry Chain
Installed Capacity of Solar PV in China, 2009-2020E
Demand for EO Used for Crystalline Silicon Cutting Fluid in China, 2016-2021E
Ethanolamine-use EO Demand in China, 2016-2021E
Capacity of Major Ethanolamine Manufacturers in China, 2016
Output, Import/Export Volume and Self-sufficiency Rate of Ethanolamine in China, 2006-2017
Apparent Consumption of Ethanolamine in China, 2010-2021E
Price Trend in Chinese Monoethanolamine Market, 2016
Price Trend in Chinese Diethanolamine Market, 2016
Price Trend in Chinese Triethanolamine Market, 2016
China’s Taurine Output, 2010-2021E
Taurine Application Structure by Field, 2016
Competitive Landscape of Chinese Taurine Market, 2016
Operation of Dow Chemical, 2015-2016
Revenue Breakdown of Dow Chemical by Business, 2016
Revenue Structure of Dow Chemical by Region, 2016
SABIC’s Revenue and Net Income, 2001-2016
Capacity of Main Products of Sinopec SABIC
SABIC’s Main Products and Market Share
Shell’s Revenue and Net Income, 2012-2016
Capacity of Main Products of Sinopec Shanghai Petrochemical, by 2016
Revenue and Net Income of Sinopec Shanghai Petrochemical, 2009-2017
Output and Growth Rate of Main Products of Sinopec Shanghai Petrochemical, 2016
Revenue Breakdown of Sinopec Shanghai Petrochemical by Product, 2012-2016
Revenue Structure of Sinopec Shanghai Petrochemical by Product, 2012-2016
Revenue Breakdown of Sinopec Shanghai Petrochemical by Region, 2012-2016
Revenue Structure of Sinopec Shanghai Petrochemical by Region, 2012-2016
Gross Margin of Main Products of Sinopec Shanghai Petrochemical, 2012-2016
Sinopec Shanghai Petrochemical’s Revenue from Top 5 Clients and % of Total Revenue, 2012-2016
Net Sales and Operating Income of Intermediate Petrochemical Division of Sinopec Shanghai Petrochemical, 2010-2016
Sales Volume of Intermediate Petrochemical Division of Sinopec Shanghai Petrochemical, 2009-2016
Revenue and Net Income of Sinopec Shanghai Petrochemical, 2013-2017
Capacity of Main Products of Sinopec Zhenhai Refining & Chemical, 2016
1-million-tons/a Ethylene Project Supporting Equipment and Capacity of Sinopec Zhenhai Refining & Chemical
Capacity of Main Products of Sinopec Yangzi Petrochemical, by 2016
Capacity of Main Products of CNOOC and Shell Petrochemicals, by 2016
Sales of BASF-YPC, 2012-2016
Revenue and Net Income of China Sanjiang Fine Chemicals, 2009-2016
Revenue Breakdown of China Sanjiang Fine Chemicals by Product, 2012-2016
Revenue Structure of China Sanjiang Fine Chemicals by Product, 2012-2016
Gross Margin of Main Products of China Sanjiang Fine Chemicals, 2012-2016
EO Business Development Course of China Sanjiang Fine Chemicals
Sales Volume of Main Products of China Sanjiang Fine Chemicals, 2010-2016
Selling Price of Main Products of China Sanjiang Fine Chemicals, 2010-2016
Revenue and Net Income of China Sanjiang Fine Chemicals, 2013-2017
Capacity of Main Products of Liaoning Huaxing, by 2016
Capacity of Main Products of Sasol (China), by 2016
Revenue and Net Income of Liaoning Oxiranchem, 2011-2017
Operating Revenue of Liaoning Oxiranchem by Product, 2013-2016
Revenue Structure of Liaoning Oxiranchem by Product, 2013-2016
Operating Revenue of Liaoning Oxiranchem by Region, 2012-2016
Revenue Structure of Liaoning Oxiranchem by Region, 2012-2016
Gross Margin of Liaoning Oxiranchem by Product, 2011-2016
R & D Costs and % of Total Revenue of Liaoning Oxiranchem, 2013-2016
Business Positioning of Liaoning Oxiranchem
Polyether Monomer Output and Sales Volume of Liaoning Oxiranchem, 2011-2016
Polyether Monomer-related Subsidiaries of Liaoning Oxiranchem, 2016
Revenue and Net Income of EO Deep-processing Subsidiaries of Liaoning Oxiranchem, 2016
Progress in Major Construction Projects of Liaoning Oxiranchem, by the end of 2016
EO Derivative Capacity of Liaoning Oxiranchem, by the end of Jun 2017
Revenue and Net Income of Kelong Fine Chemical, 2011-2017
Revenue Structure of Kelong Fine Chemical by Product, 2015-2016
Revenue Breakdown of Kelong Fine Chemical by Region, 2012-2016
Revenue Structure of Kelong Fine Chemical by Region, 2012-2016
R & D Costs and % of Total Revenue of Kelong Fine Chemical, 2013-2016
Capacity, Revenue and Gross Margin of Polyether Monomer of Kelong Fine Chemical, 2013-2016
Output and Sales Volume of Concrete Admixtures of Kelong Fine Chemical by Product, 2011-2016
Output, Capacity and Capacity Utilization of Polycarboxylate Superplasticizer of Kelong Fine Chemical, 2011-2017
Output and Sales Volume of Crystalline Silicon Cutting Fluid of Kelong Fine Chemical, 2011-2016
Output, Capacity and Capacity Utilization of EO-derived Products of Kelong Fine Chemical, 2011-2016
Main Projects under Construction of Kelong Fine Chemical, end of 2016
Capacity of Main Products of Sobute New Materials, by 2016
Product Applications of Sobute New Materials
Revenue and Net Income of Xiamen Academy of Building Research Group, 2009-2017
Revenue Breakdown of Xiamen Academy of Building Research Group by Product, 2012-2016
Revenue Structure of Xiamen Academy of Building Research Group by Product, 2012-2016
Revenue Breakdown of Xiamen Academy of Building Research Group by Region, 2012-2016
Revenue Structure of Xiamen Academy of Building Research Group by Region, 2012-2016
Gross Margin of Xiamen Academy of Building Research Group by Product, 2012-2016
R & D Costs and % of Total Revenue of Xiamen Academy of Building Research Group, 2011-2016
Admixture Revenue and Net Income of Xiamen Academy of Building Research Group, 2011-2016
Admixture Sales Volume of Xiamen Academy of Building Research Group, 2009-2016
Admixture Subsidiaries of Xiamen Academy of Building Research Group and Their Revenue and Net Income, 2016
Revenue and Net Income of Yongan Pharmaceutical, 2009-2017
Revenue Breakdown of Yongan Pharmaceutical by Product, 2012-2016
Revenue Structure of Yongan Pharmaceutical by Product, 2012-2016
Revenue Breakdown of Yongan Pharmaceutical by Region, 2012-2016
Revenue Structure of Yongan Pharmaceutical by Region, 2012-2016
Gross Margin of Main Products of Yongan Pharmaceutical, 2012-2016
R & D Costs and % of Total Revenue of Yongan Pharmaceutical, 2011-2016
Output and Sales Volume of Yongan Pharmaceutical Taurine, 2009-2016
Capacity of Taurine Products of Yongan Pharmaceutical, 2009-2016
Global and China Synthetic Rubber Industry Report, 2021-2027
Synthetic rubber is a polymer product made of coal, petroleum and natural gas as main raw materials and polymerized with dienes and olefins as monomers, which is typically divided into general synthet...
Global and China Carbon Fiber Industry Report, 2021-2026
Carbon fiber is a kind of inorganic high performance fiber (with carbon content higher than 90%) converted from organic fiber through heat treatment. As a new material with good mechanical properties,...
China Coal Tar Industry Report, 2020-2025
Coal tar is a thick dark liquid which is a by-product of the production of coke and coal gas from coal. It can be classified by the dry distillation temperature into low-temperature coal tar, medium-t...
Global and China Dissolving Pulp Industry Report, 2019-2025
In 2018, global dissolving pulp capacity outstripped 10 million tons and its output surged by 14.0% from a year ago to 7.07 million tons, roughly 70% of the capacity. China, as a key supplier of disso...
Global and China 1, 4-butanediol (BDO) Industry Report, 2019-2025
1,4-butanediol (BDO), an essential organic and fine chemical material, finds wide application in pharmaceuticals, chemicals, textile and household chemicals.
As of the end of 2018, the global BDO cap...
Global and China Carbon Fiber and CFRP Industry Report, 2019-2025
Among the world’s three major high performance fibers, carbon fiber features the highest strength and the highest specific modulus. It is widely used in such fields as aerospace, sports and leisure.
...
Global and China Natural Rubber Industry Report, 2019-2025
In 2018, global natural rubber industry continued remained at low ebb, as a result of economic fundamentals. Global natural rubber price presented a choppy downtrend and repeatedly hit a record low in...
Global and China Ultra High Molecular Weight Polyethylene (UHMWPE) Industry Report, 2019-2025
Ultra high molecular weight polyethylene (UHMWPE), a kind of linear polyethylene with relative molecular weight of above 1.5 million used as an engineering thermoplastic with excellent comprehensive p...
China Polyether Monomer Industry Report, 2019-2025
China has seen real estate boom and issued a raft of policies for continuous efforts in improving weak links in infrastructure sector over the years. Financial funds of RMB1,663.2 billion should be al...
Global and China Needle Coke Industry Report, 2019-2025
Needle coke with merits of good orientation and excellent conductivity and thermal conductivity, is mainly used in graphite electrodes for electric steelmaking and lithium battery anode materials.
A...
Global and China Viscose Fiber Industry Report, 2019-2025
Over the recent years, the developed countries like the United States, Japan and EU members have withdrawn from the viscose fiber industry due to environmental factor and so forth, while the viscose f...
China Coal Tar Industry Report: Upstream (Coal, coke), Downstream (Phenol Oil, Industrial Naphthalene, Coal Tar Pitch), 2019-2025
Coal tar is a key product in coking sector. In 2018, China produced around 20 million tons of coal tar, a YoY drop of 2.4% largely due to a lower operating rate of coal tar producers that had to be su...
Global and China Synthetic Rubber (BR, SBR, EPR, IIR, NBR, Butadiene, Styrene, Rubber Additive) Industry Report, 2018-2023
In 2018, China boasted a total synthetic rubber capacity of roughly 6,667kt/a, including 130kt/a new effective capacity. Considering capacity adjustment, China’s capacity of seven synthetic rubbers (B...
Global and China Dissolving Pulp Industry Report, 2018-2022
With the commissioning of new dissolving pulp projects, the global dissolving pulp capacity had been up to about 8,000 kt by the end of 2017. It is worth noticing that the top six producers including ...
Global and China Carbon Fiber and CFRP Industry Report, 2018-2022
As a new generation of reinforced fiber boasting intrinsic properties of carbon material and excellent processability of textile fiber, carbon fiber is the one with the highest specific strength and s...
Global and China Ultra High Molecular Weight Polyethylene (UHMWPE) Industry Report, 2017-2021
Ultra High Molecular Weight Polyethylene (UHMWPE), a kind of linear polyethylene with relative molecular weight of above 1.5 million and an engineering thermoplastic with excellent comprehensive prope...
China Coal Tar Industry Report, 2017-2021
Coal tar, one of by-products in raw coal gas generated from coal pyrolysis in coking industry, accounts for 3%-4% of the output of coal as fired and is a main raw material in coal chemical industry.
...
Global and China Aramid Fiber Industry Report, 2017-2021
Global aramid fiber output totaled 115kt with capacity utilization of 76.0% in 2016. As industries like environmental protection and military develop, the output is expected to rise to 138kt and capac...