China Synthetic Rubber Industry Report, 2017-2021
-
Aug.2017
- Hard Copy
- USD
$3,000
-
- Pages:145
- Single User License
(PDF Unprintable)
- USD
$2,800
-
- Code:
CYH065
- Enterprise-wide License
(PDF Printable & Editable)
- USD
$4,400
-
- Hard Copy + Single User License
- USD
$3,200
-
Synthetic rubber is one of important strategic materials, mainly used in tyres and other industries. In 2016, the global output and consumption of synthetic rubber reached 14.822 million tons and 14.936 million tons, respectively, up 2.2% and 2.0% year on year. Driven by the steady development of automobile and tyre industries, the world’s output and consumption of synthetic rubber are expected to hit 16.975 million tons and 17.725 million tons by 2021 respectively.
China, the world's largest producer of synthetic rubber, boasted the output of 5.458 million tons in 2016, accounting for 36.8% of the global output. China's synthetic rubber output is expected to grow at an average annual rate of 5.2% from 2017 to 2021 and reach 7.032 million tons in 2021, equivalent to 41.4% of the world's total output.
In 2016, the combined capacity of styrene butadiene rubber (SBR) and cis-polybutadiene rubber (BR) which are the two most popular products in China shared 60.1% of China's total capacity. Ethylene propylene rubber (EPR) and Isobutylene Isoprene Rubber (IIR) saw the fastest growth rates in the past five years, with the respective capacity CAGR of 69.5% and 37.7% during 2012-2016. With the continuous optimization of the rubber product (such as tyres) structure in China, the demand for solution polymerized styrene butadiene rubber (SSBR), halogenated butyl rubber (HIIR), neodymium polybutadiene rubber (Nd-BR), low cis-polybutadiene rubber (LCBR) and other environment-friendly rubber products will increase significantly in future.
In terms of prices, the rising price of the raw material butadiene and other factors spurred the explosive growth in the prices of China's major synthetic rubber products from 2016 to February 2017. Later, the synthetic rubber price fell with the lower butadiene price, but it may restore limited growth in fluctuations after July.
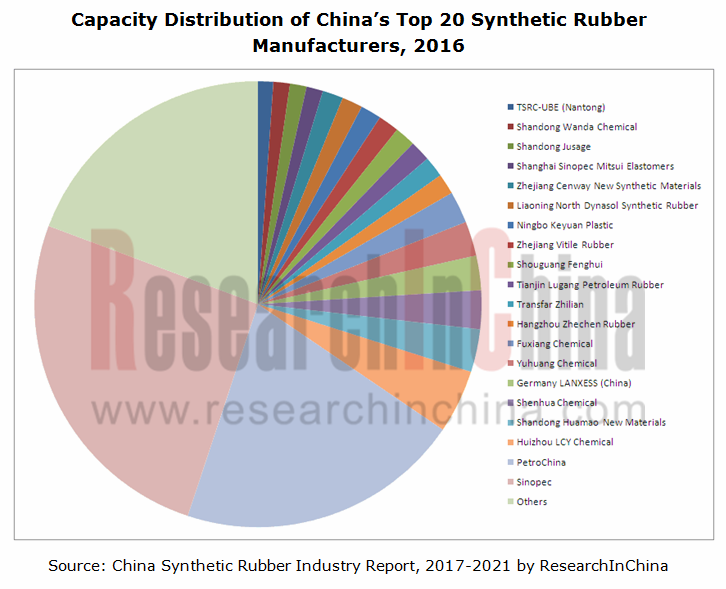
As for the enterprise pattern, there were more than 50 synthetic rubber manufacturers in China with the total capacity of 6.475 million t/a as of the end of 2016. Among them, the top two giants Sinopec and PetroChina contributed 46.2% to China's total synthetic rubber capacity together in 2016. In addition, Huizhou LCY Chemical, Shandong Huamao New Materials, Shenhua Chemical, Yuhuang Chemical, Germany LANXESS, TSRC-UBE and other Taiwanese, foreign and private companies have also entered the field.
As new entrants mostly focus on medium and low-end styrene butadiene rubber and cis-polybutadiene rubber (BR) products, China witnesses serious structural overcapacity of synthetic rubber with the release of new capacity. In the past two years, given the low prosperity index and depressed price of synthetic rubber as well as the tight supply of raw materials, some enterprises have sped up the reform of their product mix, while some other companies have shut down and dismantled facilities. In September 2016, Sinopec Shanghai Gaoqiao announced the removal of the 120,000 t/a cis-polybutadiene rubber (BR) plant which had run for many years; Yuhuang Chemical proclaimed the conversion of the 80,000 t/a cis-polybutadiene rubber (BR) facility into SBS facility. In the next few years, China's de-capacity trend will be more apparent and the new capacity will center on SBS and environment-friendly rubber.
The report covers the following:
 Supply and demand, product structure, regional structure, development trend, etc. of global synthetic rubber market;
Supply and demand, import and export, product structure, regional structure, enterprise pattern, development trend, etc. of Chinese synthetic rubber market;
Market supply and demand, import and export, enterprise pattern and other market situations of major Chinese synthetic rubber products (BR, SBR, IIR, EPR, NBR, etc.);
Development of main raw materials of synthetic rubber (butadiene, styrene, rubber additive, etc.) in China;
Development of global and China tyre (downstream sector of synthetic rubber) industry;
Operation, development strategy, etc. of 21 major Chinese synthetic rubber manufacturers.
1 Overview of Synthetic Rubber
1.1 Definition
1.2 Classification
1.3 Industrial Chain
2 Overview of Global Synthetic Rubber Industry
2.1 Overview
2.2 Market Supply and Demand
2.3 Regional Structure
2.4 Development Trend
3 Overview of China Synthetic Rubber Industry
3.1 Market Supply and Demand
3.1.1 Market Supply
3.1.2 Market Demand
3.2 Import and Export
3.2.1 Import
3.2.2 Export
3.3 Product Structure
3.4 Regional Distribution
3.5 Enterprise Pattern
3.6 Development Trend
4 Key Chinese Synthetic Rubber Market Segments
4.1 Cis-Polybutadiene Rubber (BR)
4.1.1 Market Supply
4.1.2 Import and Export
4.1.3 Market Demand
4.1.4 Competitive Landscape
4.1.5 Price
4.1.6 Development Trend
4.2 Styrene Butadiene Rubber (SBR)
4.2.1 Market Supply
4.2.2 Import and Export
4.2.3 Market Demand
4.2.4 Competitive Landscape
4.2.5 Price
4.2.6 Development Trend
4.3 Ethylene Propylene Rubber (EPR)
4.3.1 Market Supply
4.3.2 Import and Export
4.3.3 Market Demand
4.3.4 Competitive Landscape
4.3.5 Price
4.3.6 Development Trend
4.4 Isobutylene Isoprene Rubber (IIR)
4.4.1 Market Supply
4.4.2 Import and Export
4.4.3 Market Demand
4.4.4 Competitive Landscape
4.4.5 Price
4.4.6 Development Trend
4.5 Nitrile-butadiene rubber (NBR)
4.5.1 Market Supply
4.5.2 Import and Export
4.5.3 Market Demand
4.5.4 Competitive Landscape
4.5.5 Price
4.5.6 Development Trend
5 Upstream of Synthetic Rubber in China
5.1 Butadiene
5.1.1 Market Supply
5.1.2 Import and Export
5.1.3 Market Demand
5.1.4 Price
5.1.5 Competitive Landscape
5.1.6 Development Trend
5.2 Styrene
5.2.1 Market Supply
5.2.2 Import and Export
5.2.3 Market Demand
5.2.4 Price
5.2.5 Competitive Landscape
5.2.6 Development Trend
5.3 Rubber Additive
5.3.1 Market Supply and Demand
5.3.2 Price
5.3.3 Enterprise Pattern
6 Tyre Market Development
6.1 Global
6.2 China
7 Key Chinese Synthetic Rubber Enterprises
7.1 Sinopec
7.1.1 Profile
7.1.2 Operation
7.1.3 Synthetic Rubber Business
7.1.4 YPC (Nanjing) Rubber
7.1.5 Sinopec Beijing Yanshan
7.1.6 Sinopec Qilu
7.1.7 Sinopec Maoming
7.1.8 Sinopec Baling
7.1.9 Sinopec Shanghai Gaoqiao
7.2 PetroChina
7.2.1 Profile
7.2.2 Operation
7.2.3 Synthetic Rubber Business
7.2.4 PetroChina Lanzhou Petrochemical
7.2.5 PetroChina Jilin Petrochemical
7.2.6 PetroChina Daqing Petrochemical
7.2.7 PetroChina Dushanzi Petrochemical
7.2.8 PetroChina Jinzhou Petrochemical
7.2.9 PetroChina Fushun Petrochemical
7.2.10 PetroChina Sichuan Petrochemical
7.3 Shandong Yuhuang Chemical (Group)
7.3.1 Profile
7.3.2 Operation
7.3.3 Synthetic Rubber Business
7.4 TSRC
7.4.1 Profile
7.4.2 Operation
7.4.3 Synthetic Rubber Business
7.5 Lande Fine Chemical
7.5.1 Profile
7.5.2 Operation
7.6 Zhenjiang Nantex Chemical Industry
7.6.1 Profile
7.6.2 Operation
7.7 Other Enterprises
7.7.1 Gaoqiao BASF Dispersions
7.7.2 Shanxi Synthetic Rubber
7.7.3 Dow Chemical (Zhangjiagang)
7.7.4 Bridgestone (Huizhou)
7.7.5 Hangzhou Zhechen Rubber
7.7.6 Tianjin Lugang Petroleum Rubber
7.7.7 Fujian Meizhouwan Chlor-Alkali Industry
7.7.8 Zhejiang Cenway New Synthetic Materials
7.7.9 Chongqing Changshou Chemical
7.7.10 Panjin Heyun New Materials
7.7.11 Shandong Huamao New Materials
7.7.12 Fushun Yikesi New Materials
7.7.13 Ningbo Shunze Rubber
7.7.14 Shandong Jusage
7.7.15 Liaoning North Dynasol Synthetic Rubber
Synthetic Rubber Industry Chain
Global Synthetic Rubber Capacity, 2011-2017
Global Synthetic Rubber Output and Consumption, 2007-2016
Global Synthetic Rubber Output and Consumption Structure, 2007-2016
Global Synthetic Rubber Capacity Structure (by Product), 2016
Global Synthetic Rubber Capacity (by Region), 2010-2016
Global Synthetic Rubber Output (by Region), 2008-2016
Global Synthetic Rubber Consumption (by Region), 2008-2016
Global Synthetic Rubber Output and Consumption, 2015-2021E
Global Share of China’s Synthetic Rubber Capacity (by Product), 2016
China’s Synthetic Rubber Capacity and YoY Growth, 2013-2017
China’s Synthetic Rubber Output and YoY Growth, 2007-2016
China’s Synthetic Rubber Apparent Consumption and Self-sufficiency Rate, 2007-2016
China’s Synthetic Rubber Import Volume and YoY Growth, 2007-2017
China’s Synthetic Rubber Import Value and YoY Growth, 2007-2017
China’s Synthetic Rubber Export Volume and YoY Growth, 2007-2017
China’s Synthetic Rubber Export Value and YoY Growth, 2010-2017
China’s Synthetic Rubber Capacity (by Product), 2012-2017
China’s Synthetic Rubber Output (by Variety), 2014&2016
Top 10 Synthetic Rubber Provinces in China (by Output), 2016
Top 10 Synthetic Rubber Provinces in China (by Output), Jan-May 2017
China’s Synthetic Rubber Output (by Product), 2014-2021E
China’s BR Capacity and YoY Growth, 2007-2017
China’s BR Output and YoY Growth, 2007-2017
China’s BR Operating Rate, 2016-2017
China’s BR Import Volume and YoY Growth, 2007-2017
China’s BR Export Volume and YoY Growth, 2007-2017
China’s BR Apparent Consumption and Self-sufficiency Rate, 2007-2017
China’s BR Demand Structure (by Purpose), 2011-2017
Pattern of BR Enterprises in China (by Capacity), 2017
China’s BR Market Price Trend, 2007-2017
China’s SBR Capacity (by Product), 2007-2017
China’s SBR Output and YoY Growth, 2007-2017
China’s SBR Import Volume and YoY Growth, 2010-2016
China’s SBR Export Volume and YoY Growth, 2010-2016
China’s SBR Apparent Consumption and Self-sufficiency Rate, 2007-2017
China’s SBR Demand Structure (by Purpose), 2017
Market Share of SBR Enterprises in China (by Capacity), 2016-2017
Weekly Market Average Price of SBR in China, 2012-2017
China’s EPR Output and YoY Growth, 2007-2017
China’s EPR Import Volume and YoY Growth, 2007-2016
China’s EPR Export Volume and YoY Growth, 2007-2016
China’s EPR Apparent Consumption and Self-sufficiency Rate, 2007-2017
China’s EPR Demand Structure (by Purpose), 2017
Monthly Market Average Price of EPDM in China (by Product), 2016-2017
China’s IIR Output and YoY Growth, 2007-2017
China’s IIR Import Volume and YoY Growth, 2007-2016
China’s IIR Export Volume and YoY Growth, 2007-2016
China’s IIR Apparent Consumption and Self-sufficiency Rate, 2007-2017
China’s IIR Demand Structure (by Purpose), 2017
Market Price Trend of Ordinary IIR in China, 2016-2017
Price Trend of HIIR in China, 2016-2017
China’s NBR Capacity and Capacity Utilization, 2008-2017
China’s NBR Output and YoY Growth, 2007-2017
China’s NBR Import Volume and YoY Growth, 2007-2017
China’s NBR Export Volume and YoY Growth, 2007-2017
China’s NBR Apparent Consumption and Self-sufficiency Rate, 2007-2017
China’s NBR Demand Structure (by Purpose), 2016
China’s NBR Capacity Structure (by Enterprise), 2016
China’s NBR Price Trend, 2014-2017
China’s NBR Price Trend, 2017
China’s Butadiene Capacity and Capacity Utilization, 2010-2017
China’s Butadiene Output and YoY Growth, 2007-2017
China’s Butadiene Production Process Structure, 2016
China’s Butadiene Import Volume and YoY Growth, 2007-2016
China’s Butadiene Export Volume and YoY Growth, 2007-2016
China’s Butadiene Apparent Consumption and Self-sufficiency Rate, 2007-2017
Downstream Consumption of Butadiene, 2011-2017
Price Trend of Butadiene in East China, 2016-2017
China’s Butadiene Market Price, 2017
China’s Butadiene Capacity Structure (by Enterprise), 2010-2017
China’s Styrene Capacity and Capacity Utilization, 2010-2017
China’s Styrene Output and YoY Growth, 2007-2017
China’s Styrene Capacity Distribution (by Region), 2016
China’s Styrene Import Volume and YoY Growth, 2007-2017
China’s Styrene Import Value and YoY Growth, 2007-2016
China’s Styrene Export Volume and YoY Growth, 2007-2017
China’s NBR Export Value and YoY Growth, 2007-2016
China’s Styrene Apparent Consumption and Self-sufficiency Rate, 2007-2017
China’s Styrene Demand Structure (by Purpose), 2017
Styrene Market Average Price in East China, 2017
China’s Rubber Additive Output and YoY Growth, 2009-2021E
China’s Rubber Additive Output (by Product), 2016
China’s Rubber Additive Demand Structure (by Purpose), 2017
Average Price of Rubber Additive in China, 2016-2017
China’s Tyre Cost Structure, 2016
Global Tyre Market Size, 2013-2020E
Global Car Tyre Market Size, 2014-2020E
Geographical Distribution of Global Tyre Shipments, 2017
China’s Car Tyre Output, 2007-2016
Monthly Operating Rate of Full-steel Tyres in China, 2015-2016
Monthly Operating Rate of Semi-steel Tyres in China, 2015-2016
New Capacity of Tyre Outer Cover in China, 2006-2016
Sinopec’s Revenue and YoY Growth, 2008-2017
Sinopec’s Net Income and YoY Growth, 2008-2017
Sinopec’s Revenue (by Sector), 2010-2017
Sinopec’s Gross Margin (by Sector), 2008-2016
Sinopec’s Synthetic Rubber Output and YoY Growth, 2008-2017
Sinopec’s Synthetic Rubber Sales Volume and YoY Growth, 2008-2016
Sinopec’s Synthetic Rubber Revenue and YoY Growth, 2008-2016
Milestones of YPC (Nanjing) Rubber, 2005-2017
Main SBR Products of YPC (Nanjing) Rubber
PetroChina’s Revenue and YoY Growth, 2008-2017
PetroChina’s Net Income and YoY Growth, 2008-2017
PetroChina’s Revenue (by Sector), 2008-2016
PetroChina’s Revenue (by Region), 2008-2016
PetroChina’s Gross Margin (by Sector), 2008-2016
PetroChina’s Synthetic Rubber Output and YoY Growth, 2008-2017
Revenue and Net Income of Yuhuang Chemical, 2009-2016
Revenue of Yuhuang Chemical (by Sector), 2009-2016
Gross Margin of Yuhuang Chemical (by Division), 2009-2016
Synthetic Rubber Capacity, Output and Sales Volume of Yuhuang Chemical, 2010-2016
Synthetic Rubber Revenue and Average Price of Yuhuang Chemical, 2010-2016
Distribution of TSRC’s Subsidiaries, 2016
List of TSRC’s Subsidiaries
TSRC’s Revenue and Net Income, 2010-2016
TSRC’s Synthetic Rubber Capacity Utilization, 2010-2016
TSRC’s Synthetic Rubber Sales Volume (by Region), 2008-2016
TSRC’s Synthetic Rubber Revenue (by Region), 2008-2016
Revenue and Net Income of Lande Fine Chemical, 2009-2016
Revenue and YoY Growth of Zhenjiang Nantex Chemical Industry, 2012-2016
Properties and Applications of Synthetic Rubber (by Variety)
China’s Synthetic Rubber Capacity (by Enterprise), 2015-2017
Capacity and Share of Top 20 Synthetic Rubber Enterprises in China, 2016
China’s Expansion Plan for Main Synthetic Rubber Products, after 2017
Balance between China’s Synthetic Rubber Production and Demand, 2011-2021E
China’s BR Capacity (by Enterprise), 2012-2017
Output and Market Share of Top 8 BR Manufacturers in China (by Output), 2016
Ongoing and Proposed BR Projects in China, 2017
Balance between China’s BR Supply and Demand, 2015-2021E
China’s SBR Capacity (by Enterprise), 2012-2017
Balance between China’s SBR Supply and Demand, 2015-2021E
China’s EPR Capacity Distribution (by Enterprise), 2012-2017
Ongoing and Proposed EPR Projects in China, 2017-2020E
China’s EPR Supply and Demand, 2015-2021E
China’s IIR Capacity Distribution (by Enterprise), 2012-2017
Ongoing and Proposed IIR Projects in China, 2017 -2021E
Balance between China’s IIR Supply and Demand, 2015-2021E
Global NBR Capacity and Structure (by Enterprise), 2016
China’s NBR Import and Export Volume (by Product), 2010-2016
China’s NBR Capacity (by Enterprise), 2010-2017
Balance between China’s NBR Supply and Demand, 2015-2021E
China’s Butadiene Capacity Distribution (by Enterprise), 2010-2017
Ongoing and Proposed Butadiene Projects in China, 2017 -2021E
Butadiene Supply and Demand in China, 2015-2021E
China’s Styrene Capacity Distribution (by Enterprise), 2010-2017
Ongoing and Proposed Styrene Projects in China, 2017 -2021E
Balance between China’s Styrene Supply and Demand, 2015-2021E
Top 9 Rubber Additive Enterprises in China (by Revenue), 2016
Output of Top 15 Tyre Enterprises in China, 2013-2016
Tyre Prices of Major Tyre Enterprises in China, 2016
Distribution of Yuhuang Chemical’s Main Subsidiaries, 2016
TSRC’s Revenue Structure (by Product), 2013-2016
TSRC’s Procurement Structure by Supplier, 2014-2016
TSRC’s Capacity, Output and Output Value (by Product), 2013-2016
TSRC’s Synthetic Rubber Capacity (by Enterprise / Product), 2016
Neoprene Products of Shanna Synthetic Rubber
Synthetic Rubber Products of Hangzhou Zhechen Rubber
Project Investment and Capacity of Tianjin Lugang Petroleum Rubber
Neoprene Products of Chongqing Changshou Chemical
NBR Products of Ningbo Shunze Rubber (by Grade), 2016
Global and China Synthetic Rubber Industry Report, 2021-2027
Synthetic rubber is a polymer product made of coal, petroleum and natural gas as main raw materials and polymerized with dienes and olefins as monomers, which is typically divided into general synthet...
Global and China Carbon Fiber Industry Report, 2021-2026
Carbon fiber is a kind of inorganic high performance fiber (with carbon content higher than 90%) converted from organic fiber through heat treatment. As a new material with good mechanical properties,...
China Coal Tar Industry Report, 2020-2025
Coal tar is a thick dark liquid which is a by-product of the production of coke and coal gas from coal. It can be classified by the dry distillation temperature into low-temperature coal tar, medium-t...
Global and China Dissolving Pulp Industry Report, 2019-2025
In 2018, global dissolving pulp capacity outstripped 10 million tons and its output surged by 14.0% from a year ago to 7.07 million tons, roughly 70% of the capacity. China, as a key supplier of disso...
Global and China 1, 4-butanediol (BDO) Industry Report, 2019-2025
1,4-butanediol (BDO), an essential organic and fine chemical material, finds wide application in pharmaceuticals, chemicals, textile and household chemicals.
As of the end of 2018, the global BDO cap...
Global and China Carbon Fiber and CFRP Industry Report, 2019-2025
Among the world’s three major high performance fibers, carbon fiber features the highest strength and the highest specific modulus. It is widely used in such fields as aerospace, sports and leisure.
...
Global and China Natural Rubber Industry Report, 2019-2025
In 2018, global natural rubber industry continued remained at low ebb, as a result of economic fundamentals. Global natural rubber price presented a choppy downtrend and repeatedly hit a record low in...
Global and China Ultra High Molecular Weight Polyethylene (UHMWPE) Industry Report, 2019-2025
Ultra high molecular weight polyethylene (UHMWPE), a kind of linear polyethylene with relative molecular weight of above 1.5 million used as an engineering thermoplastic with excellent comprehensive p...
China Polyether Monomer Industry Report, 2019-2025
China has seen real estate boom and issued a raft of policies for continuous efforts in improving weak links in infrastructure sector over the years. Financial funds of RMB1,663.2 billion should be al...
Global and China Needle Coke Industry Report, 2019-2025
Needle coke with merits of good orientation and excellent conductivity and thermal conductivity, is mainly used in graphite electrodes for electric steelmaking and lithium battery anode materials.
A...
Global and China Viscose Fiber Industry Report, 2019-2025
Over the recent years, the developed countries like the United States, Japan and EU members have withdrawn from the viscose fiber industry due to environmental factor and so forth, while the viscose f...
China Coal Tar Industry Report: Upstream (Coal, coke), Downstream (Phenol Oil, Industrial Naphthalene, Coal Tar Pitch), 2019-2025
Coal tar is a key product in coking sector. In 2018, China produced around 20 million tons of coal tar, a YoY drop of 2.4% largely due to a lower operating rate of coal tar producers that had to be su...
Global and China Synthetic Rubber (BR, SBR, EPR, IIR, NBR, Butadiene, Styrene, Rubber Additive) Industry Report, 2018-2023
In 2018, China boasted a total synthetic rubber capacity of roughly 6,667kt/a, including 130kt/a new effective capacity. Considering capacity adjustment, China’s capacity of seven synthetic rubbers (B...
Global and China Dissolving Pulp Industry Report, 2018-2022
With the commissioning of new dissolving pulp projects, the global dissolving pulp capacity had been up to about 8,000 kt by the end of 2017. It is worth noticing that the top six producers including ...
Global and China Carbon Fiber and CFRP Industry Report, 2018-2022
As a new generation of reinforced fiber boasting intrinsic properties of carbon material and excellent processability of textile fiber, carbon fiber is the one with the highest specific strength and s...
Global and China Ultra High Molecular Weight Polyethylene (UHMWPE) Industry Report, 2017-2021
Ultra High Molecular Weight Polyethylene (UHMWPE), a kind of linear polyethylene with relative molecular weight of above 1.5 million and an engineering thermoplastic with excellent comprehensive prope...
China Coal Tar Industry Report, 2017-2021
Coal tar, one of by-products in raw coal gas generated from coal pyrolysis in coking industry, accounts for 3%-4% of the output of coal as fired and is a main raw material in coal chemical industry.
...
Global and China Aramid Fiber Industry Report, 2017-2021
Global aramid fiber output totaled 115kt with capacity utilization of 76.0% in 2016. As industries like environmental protection and military develop, the output is expected to rise to 138kt and capac...