In trading on Monday, shares of Penn National Gaming, Inc. (NASDAQ:PENN) crossed above their 200 day moving average of $37.24, changing hands as high as $38.10 per share. Penn National Gaming, Inc. shares are currently trading up about 3.1% on the day. The chart below shows the one year performance of PENN shares, versus its 200 day moving average:
Looking at the chart above, PENN's low point in its 52 week range is $27.51 per share, with $44.29 as the 52 week high point — that compares with a last trade of $38.03.
According to the ETF Finder at ETF Channel, PENN makes up 2.82% of the Dynamic Leisure and Entertainment Portfolio ETF (AMEX:PEJ) which is trading up by about 2.3% on the day Monday.
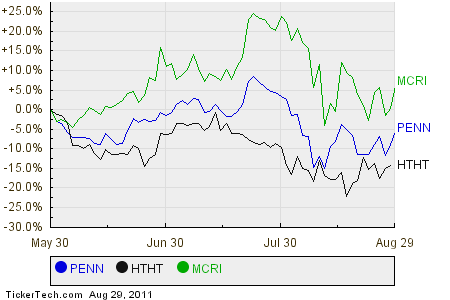
PENN operates in the Hotels, Lodging, Restaurants & Travel sector, among companies like China Lodging Group Ltd. (NASDAQ:HTHT) which is up about 3.3% today, and Monarch Casino & Resort, Inc. (NASDAQ:MCRI) trading up by about 3.8%. Below is a three month price history chart comparing the stock performance of PENN, versus HTHT and MCRI.