Global and China Wind Farm O&M Industry Report, 2017-2021
-
Feb.2017
- Hard Copy
- USD
$2,400
-
- Pages:116
- Single User License
(PDF Unprintable)
- USD
$2,200
-
- Code:
CYH059
- Enterprise-wide License
(PDF Printable & Editable)
- USD
$3,500
-
- Hard Copy + Single User License
- USD
$2,600
-
As the wind power installed capacity grows and the warranty period of a large number of wind turbines is coming to an end, wind farm O & M has become the focus of the industry. In 2016, the global wind farm O & M market size jumped 12% year on year to about USD10.75 billion; in 2021, the size will rise to USD18.612 billion.
China is the world's largest wind farm O & M market, with the market size of about USD2.716 billion and making up 25.3% of the global total in 2016. Given a rising number of wind turbines whose warranty period expires, China’s wind farm O & M market size is anticipated to keep an AAGR of 13% during 2017-2021 and hit USD5.021 billion by 2021.
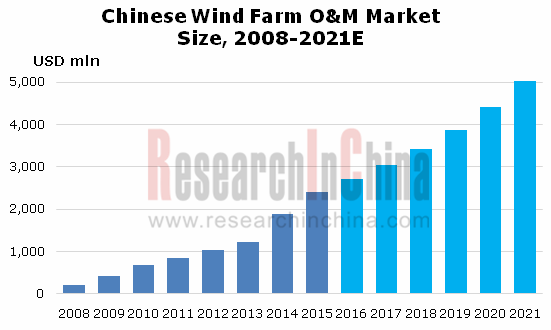
Source: Global and China Wind Farm O&M Industry Report, 2017-2021 byResearchInChina
At present, Chinese wind farm O & M market still centers on regular maintenance and breakdown maintenance, which share more than 45% together. With the continuous introduction of new technologies and products, state maintenance will be the main development trend of the future wind farm O & M.
Currently, players in the Chinese wind farm O&M market can be mainly divided into three types: wind turbine manufacturers, wind farm developers and third-party O&M companies. In 2016, wind farm developers represented by Concord New Energy and Longyuan Power enjoyed the lion’s share --74%, followed by wind turbine manufacturers such as Goldwind, Ming Yang Wind Power, United Power and SinovelWind Group with 15% and third-party O&M companies (still a small scale) including EULIKIND, Han Energy Technology and CLCP with 11%.
Additionally, under the impetus of the Internet, big data, intelligent manufacturing and other policies, the major companies have begun to deploy wisdom O & M systems in the past two years. Goldwind launched the integrated digital wisdom wind farm O & M management model in 2016 to serve a number of wind farms around the world with operational services. United Power has built a remote data monitoring center based on the cloud platform in Beijing. Sharing, intelligence and concentration will be the main direction of the future wind farm O & M.
Global and China Wind Farm O&M Industry Report, 2017-2021 by ResearchInChina focuses on the following:
 Global wind power installed capacity and distribution; China's wind power installed capacity, regional structure, offshore wind power development and corporate structure;
Global wind farm O & M market size and geographical distribution; development of European wind farm O & M market;
Chinese wind farm O & M market size, cost analysis and competitive landscape and development trends;
Operation and development strategies of 18 major global and Chinese wind farm O & M companies.
1 Overview of Wind Farm O&M
1.1 Definition
1.2 Classification
2 Global and Chinese Wind Power Market
2.1 Global Wind Power Market
2.1.1 Wind Power Installed Capacity and Distribution
2.1.2 Germany
2.1.3 Spain
2.1.4 USA
2.1.5 India
2.2 Chinese Wind Power Market
2.2.1 Overview
2.2.2 Installed Capacity and Grid Connection
2.2.3 Offshore Wind Power
2.2.4 Feed-In Tariff
2.2.5 Pattern of Wind Turbine Manufacturers
2.2.6 Pattern of Wind Farm Developers
3 Global Wind Farm O&M Market
3.1 Market Size
3.2 Regional Structure
3.3 Cost Analysis
3.4 European Market
3.4.1 Market Size
3.4.2 Competitive Landscape
3.5 Corporate Pattern
4 Chinese Wind Farm O&M Market
4.1 Development
4.2 Market Size
4.3 Cost Analysis
4.4 Competitive Landscape
4.5 Offshore Wind Farm O&M
4.6 Development Trends
4.6.1 Market Trends
4.6.2 Development of Wisdom O & M
5 Major Global and Chinese Wind Farm O&M Companies
5.1 Vestas
5.1.1 Profile
5.1.2 Operation
5.1.3 Wind Farm O&M Business
5.1.4 Business in China
5.2 Gamesa
5.2.1 Profile
5.2.2 Operation
5.2.3 Wind Farm O&M Business
5.2.4 Business in China
5.3 Suzlon
5.3.1 Profile
5.3.2 Operation
5.3.3 Wind Farm O&M Business
5.3.4 Business in China
5.4 GE
5.4.1 Profile
5.4.2 Operation
5.4.3 Business in China
5.4.4 Wind Farm O&M Business
5.5 Siemens
5.5.1 Profile
5.5.2 Operation
5.5.3 Business in China
5.5.4 Wind Farm O&M Business
5.6 Longyuan Power
5.6.1 Profile
5.6.2 Operation
5.6.3 Wind Farm O&M Business
5.7 Goldwind
5.7.1 Profile
5.7.2 Operation
5.7.3 Wind Farm O&M Business
5.8 Ming Yang Wind Power
5.8.1 Profile
5.8.2 Operation
5.8.3 Wind Farm O&M Business
5.9 EULIKIND
5.9.1 Profile
5.9.2 Operation
5.9.3 Wind Farm O&M Business
5.10 Concord New Energy
5.10.1 Profile
5.10.2 Operation
5.10.3 Wind Farm O&M Business
5.11 United Power
5.11.1 Profile
5.11.2 Operation
5.11.3 Wind Farm O&M Business
5.12 CLCP
5.12.1 Profile
5.12.2 Operation
5.13 Sinovel Wind Group
5.13.1 Profile
5.13.2 Operation
5.13.3 Wind Farm O&M Business
5.14 Han Energy Technology
5.14.1 Profile
5.14.2 Operation
5.15 Gideon
5.15.1 Profile
5.15.2 Wind Farm O&M Business
5.16 Sharpower
5.16.1 Profile
5.16.2 Wind Farm O&M Business
5.17 East Environment Energy
5.17.1 Profile
5.17.2 Operation
5.17.3 Wind Farm O&M Business
5.18 EUM Wind Power Technologies Service (Beijing)
Major Business Sectors in Wind Power Service Industry
Structure of Global Wind Farm O&M Market by Type of Service, 2013 vs 2021E
Global Newly-installed Wind Power Capacity, 2008-2021E
Global Cumulative Installed Wind Power Capacity, 2008-2021E
Cumulative Installed Wind Power Capacityin Top 10 Countries and Percentages, 2016
Global Wind Power Installed Capacity (by Region), 2016
Global Offshore Wind Power Installed Capacity, 2011-2016
Newly-installed and Cumulative Wind Power Capacity in Germany, 1992-2016
Installed Wind Power Capacity in Germany (by Region), 2016
Cumulative Installed Wind Power Capacity in Spain, 2005-2016
Cumulative Installed Wind Power Capacity in USA, 2004-2016
Cumulative Installed Wind Power Capacity in USA (by Region), 2016
Cost Per Kw.h of Mainstream Wind Power Turbines in the United States, 2006-2016
Annual Wind Capacity Addition in India, 2012-2018E
Increasing Comfort of Global Institutional Customers in India Wind, 2016
Development Course of Chinese Wind Turbine Generators, 1980-2020E
Average Power of Newly-installed and Cumulatively-installed Wind Power Generation Units in China, 1991-2016
Installed Wind Power Capacity in China, 2007-2016
Grid-connected Installed Wind Power Capacity in China, 2009-2016
Newly-installed Wind Power Capacity Share (by Region) in China, 2015-2016
Newly-installed Wind Power Capacity Trend (by Region) in China, 2012-2016
Newly-installed Capacity Share of Wind Power Generating Units with Varied Power in China, 2016
Cumulative Installed Capacity of Wind Power Generating Units with Varied Power in China, 2016
Newly-installed Capacity of 1.5MW and 2.0MW Units, 2006-2016
Wind Power Development Goal and Layout in China, 2010-2050E
Newly-installed and Cumulative Offshore Wind Capacity in China, 2007-2016
China’s First Franchise Offshore Wind Projects
Cumulative Installed Wind Power Capacity of Chinese Offshore Wind Turbine Manufacturers, 2016
Cumulative Installed Capacity of Offshore Wind Power by Generating Units with Varied Power in China, 2016
Benchmark Feed-In Tariff for Wind Power in China, 2016-2018
Newly-installed Capacity of Chinese Wind Turbine Manufacturers, 2016
Market Share of Chinese Wind Turbine Manufacturers, 2016
Domestic Market Concentration of Chinese Wind Turbine Manufacturers, 2013-2016
Cumulative Installed Capacity of Chinese Wind Power Manufacturers, 2016
Cumulative Market Share of Chinese Wind Power Manufacturers, 2016
Market Share of Cumulative Wind Power Installed Capacity of Chinese Wind Farm Developers, 2016
Cumulative Wind Power Installed Capacity and Market Share of Chinese Wind Farm Developers, 2016
Newly-installed Wind Power Capacity of Chinese Wind Farm Developers, 2016
Global Wind Farm O&M Market Size, 2008-2021E
Global Wind Farm O&M Market Size Structure (by Region), 2015 vs 2025E
Cost Growth Trend of Wind Farm O&M
Cost Structure of Wind Power Service, 2014&2021
European Wind Farm O&M Market Size, 2005-2020E
European Wind Farm O&M Market Size (by Country), 2005-2020E
Newly-added Installed Wind Power Capacity Coming into O&M in Europe (by Country), 2012-2020E
Share of European Wind Farm O&M Market (by Type of Farm), 2011&2020E
Share of European Wind Farm O&M Market (by Country and Type of Service Provider), 2016
M&A Events of Major Wind Farm O&M Enterprises in the World, 2015-2016
Number of Wind Turbines Out of Warranty, 2013-2021E
Chinese Wind Farm O&M Market Size, 2008-2017
Annual Operating Costs of A 50MW Wind Farm
Cost Structure of Wind Power in China
Operating Costs Structure of Onshore Wind Power in China
Cost Per Kw.h Downtrend of Onshore Wind Power(Subdued Topography)in China, 2015-2025E
Cost Per Kw.h Downtrend of Onshore Wind Power(Accidented Topography) in China, 2015-2025E
Cost Per Kw.h Decline of Offshore Wind Power in China, 2015-2025E
Prices of Wind Power Generating Units in China, 2004-2050E
Wind Farm O&M Market Share (by Type of Companies) in China, 2016
SWOT Analysis of Three Types of Competitors in Chinese Wind Farm O&M Market
Wind Farm O&M Business of Major Wind Power Companies in China, 2016
Name List of Main Wind Farm O&M Enterprises (Type of Wind Farm Developers) in China
Name List of Main Wind Farm O&M Enterprises (Type of Wind Turbine Producers) in China
Name List of Key Third-party Wind Farm O&M Enterprises in China
Cost Estimation of Offshore Wind Power in China, 2016
Global Wind Farm O&M Market Size, 2016-2021E
China Wind Farm O&M Market Size, 2016-2021E
Cost Roadmap of Onshore Wind Power in China, 2025E
Global Footprint of Vestas
Revenue and Net Income of Vestas, 2009-2016
Order Intake of Vestas, 2015-2016
Average Selling Price of Order Intake of Vestas, 2016-2016
Revenue Structure of Vestas (by Business), 2012-2016
Data about Key Orders of Vestas, 2012-2016
Wind Turbine Shipments of Vestas (by Region), 2014-2015
Revenue of Vestas (by Region), 2015-2016
Order Intake of Vestas (by Region), 2015-2016
Order Intake of Vestas by Country, 2016
Wind Farm O&M Order Backlog of Vestas, 2009-2016
Vestas Service Revenue (Onshore and Offshore), 2012-2016
Wind Farm O&M Orders of Vestas, 2016
Capacity of Wind Turbines Served by Vestas (by Region), 2016
Wind Turbine Shipment of Vestas in China, 2008-2015
Subsidiaries of Vestas in China, 2016
Revenue and Net Income of Gamesa, 2009-2016
Order Book of Gamesa, 2015-2016
Monthly Orders of Gamesa, 2016
Order Book of Gamesa (by Region), 2014-2016
Revenue Structure of Gamesa (by Product), 2013-2016
Revenue Structure of Gamesa (by Region), 2013-2014
Wind Turbine Sales Volume Structure of Gamesa (by Region), 2016
Quarterly Sales Volume of Gamesa, 2015-2016
Wind Farm O&M Business Revenue of Gamesa, 2010-2016
Wind Farm O&M Fleet and Order Book of Gamesa, 2015-2016
Gamesa Merger with Siemens Wind Power moving forward
Operation of Gamesa in China, 2015
Revenue of Gamesa in China, 2008-2016
Percentage of Gamesa’s Wind Turbine Sales Volume in China, 2012-2015
Business Structure of SuzlonGroup
R&D Bases of Suzlon
Installed Capacity (by Region) of Suzlon, FY2016
Revenue and Net Income of Suzlon, FY2010-FY2017
Order Book of Suzlon as of End-2016
Wind Turbine Installations of Suzlon (by Quarter), FY2015-FY2017
Revenue Structure of Suzlon (by Region), FY2014-FY2016
OMS Business Revenue of Suzlon, FY2009-FY2017
OMS Capability of Suzlon, 2016
OMS Revenue of Suzlon, FY2017Q1-Q3
Revenue of Suzlon in China, FY2014-FY2016
Revenue and Net Income of GE, 2009-2015
Operating Revenue Structure of GE (by Business), 2015-2016
Operating Revenue Structure of GE (by Region), 2011-2015
GE’s Flexible Wind Farm Service Solutions
Digital Enterprise of Siemens
Revenue and Net Income of Siemens, FY2010-FY2017
Operation of Siemens, FY2015-FY2016
Operating Revenue Structure of Siemens (by Business), FY2014-FY2017
Operating Revenue Structure of Siemens (by Region), FY2014-FY2017
Operating of Siemens in China, 2015
Revenue of Siemens in China, FY2009-FY2016
Strategy of Siemens in China
Revenue of Wind Power Division of Siemens, FY2011-FY2017
Wind Power Business Operation of Siemens, FY2017Q1
Order Backlog of Siemens’ Wind Power Division, FY2011-FY2017
Siemens’ Acquisition on Gamesa in 2016
Wind Farm O&M System of Siemens
Revenue and Net Income of Longyuan Power, 2009-2016
Revenue Structure of Longyuan Power (by Business), 2013-2016
Gross Margin of Longyuan Power (by Business), 2012-2015
Six Wind Farm Bases of Longyuan Power
O&M Costs of Longyuan Power, 2014-2016
Revenue and Net Income of Goldwind, 2009-2016
Wind Turbine Sales Volume of Goldwind (by Type), 2011-2016
Operating Revenue Structure of Goldwind (by Product), 2014-2016
Operating Revenue Structure of Goldwind (by Region), 2015-2016
Gross Margin of Goldwind (by Product), 2011-2016
Wind Farm Service Revenue of Goldwind, 2010-2016
Revenue and Net Income of Tian Yuan New Energy Technology, 2010-2016
Main Production Bases and Capacity of Ming Yang Wind Power, End-2015
Revenue and Net Income of Ming Yang Wind Power, 2009-2016
Wind Turbine Shipment of Ming Yang Wind Power, 2008-2015
Revenue Structure of Ming Yang Wind Power (by Business), 2012-2015
Revenue Structure of Ming Yang Wind Power (by Region), 2012-2013
Wind Farm O&M Business System of Ming Yang Wind Power
Wind Farm O&M Revenue of Ming Yang Wind Power, 2009-2015
Regions Covered by EULIKIND’s Services
Revenue and Net Income of EULIKIND, 2014-2016
Revenue Structure of EULIKIND (by Business), 2014-2016
Gross Margin of EULIKIND (by Business), 2014-2016
Name List and Revenue Contribution of EULIKIND’S Top 5 Customers, 2015
Revenue and Net Income of Concord New Energy, 2009-2016
Revenue Structure of Concord New Energy (by Business), 2013-2016
Revenue Structure of Concord New Energy (by Region), 2013-2016
Wind Farm O&M Revenue of Concord New Energy, 2013-2016
Revenue and Net Income of United Power, 2012-2015
Wind Turbine Sales Volume of United Power, 2011-2014
Wind Farm EPC Construction Flow of United Power
Revenue and Net Income of CLCP, 2013-2016
Revenue Structure of CLCP (by Business), 2014-2016
Revenue and Net Income of Sinovel Wind Group, 2013-2016
Development History of Han Energy Technology, 2008-2016
Revenue and Net Income of Han Energy Technology, 2013-2016
Revenue Structure of Han Energy Technology(by Product), 2015-2016
Key Wind Farm O&M Projects of Gideon, 2006-2016
Revenue and Net Income of East Environment Energy, 2012-2016
Operating Revenue Structure of East Environment Energy(by Business), 2012-2016
Wind Farm O&M System of East Environment Energy
Global and China Wind Farm O&M Industry Report, 2017-2021
As the wind power installed capacity grows and the warranty period of a large number of wind turbines is coming to an end, wind farm O & M has become the focus of the industry. In 2016, the global...
Global and China Electrical Energy Storage (EES) Industry Report, 2016-2020
Energy storage finds widespread application in power system, involving power generation, transmission, distribution, and end users. Global cumulative installed capacity of electrical energy storage (E...
Global and China Wind Farm Operation and Maintenance Industry Report, 2015-2018
In 2014, the global wind farm O & M market size hit USD9.25 billion, representing a year-on-year growth rate of 25.8%; by 2018, the market size is expected to reach USD13.78 billion. The mainstrea...
China Energy Storage for Grid System Industry Report, 2015-2018
Energy storage finds wide application in electric power system, involving all aspects of power generation, transmission, distribution and end user. Technically, energy storage for grid system can be d...
China Energy Conservation Service Industry Report, 2015
Energy conservation service industry provides service and support for enterprises and projects in terms of energy conservation and emission reduction. An Energy Service Company, more commonly referred...
China Natural Gas Fueling Station Equipment Industry Report, 2015-2018
According to different fuels used by natural gas stations, gas station equipment can be divided into compressed natural gas (CNG) station equipment and liquefied natural gas (LNG) station equipment. T...
China Filling Station and Gas Station Industry Report,2015-2018
Filling Stations By the end of 2014, China had run a total of 99,000 filling stations, each of which served 1,456 civilian cars; Shandong, Hebei, Henan, Guangdong and Jiangsu ranked top five by the nu...
China Biodiesel Industry Report, 2014-2017
Biodiesel refers to a renewable diesel fuel made from oil crops, animal fats, food waste oil that can substitute petroleum diesel and has environmental protection, safety, renewability and other advan...
China Filling Station And Refueling Station Industry Report,2013-2016
By the end of 2012, China has had a total of 96,313 filling stations, an increase of 875 or up 0.92% compared to 2011, including 51,854 SOE filling stations (53.8% of the total), 42,425 private fillin...