China Filling Station And Refueling Station Industry Report,2013-2016
-
Jan./2014
- Hard Copy
- USD
$2,400
-
- Pages:112
- Single User License
(PDF Unprintable)
- USD
$2,300
-
- Code:
WLQ010
- Enterprise-wide License
(PDF Printable & Editable)
- USD
$3,500
-
- Hard Copy + Single User License
- USD
$2,600
-
By the end of 2012, China has had a total of 96,313 filling stations, an increase of 875 or up 0.92% compared to 2011, including 51,854 SOE filling stations (53.8% of the total), 42,425 private filling stations (44.1%) and 2,034 filling stations with foreign capital (2.1%).
China’s filling station market in recent years has shown two main characteristics. First, because of the vigorous growth of car ownership (a CAGR of 16.24% in 2007-2012), the average number of cars served by each filling station is consequently growing rapidly (CAGR of 15.74% in 2007-2012).
Second, the rapid development of non-oil business in Chinese filling stations, which is specifically manifested as convenience stores, lubricating oil stores, asset leasing, advertising, car washing, car repairing, catering, weighbridge, ATMs, communications, lotteries and other multiple business forms. In 2009-2012 the number of Chinese filling stations conducting non-oil business rose from 21,000 to 37,000, and sales value of non-oil business surged from RMB6 billion to RMB19.6 billion at a CAGR of 48.4%.
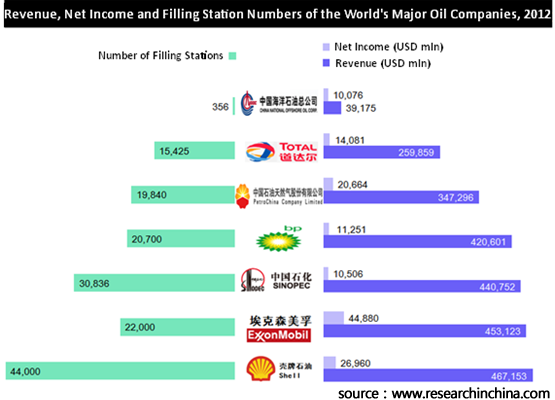
In 2008-2012 CAGR for revenue and net income of China’s three major oil companies was much higher than other oil companies worldwide. The top three - PetroChina, CNOOC and Sinopec in terms of revenue CAGR were respectively 22.54%, 21.27% and 20.53%.
?

???? Overview of filling station industry (including definition, classification, major clients and consumption habits, business model and strategy of filling stations at home and abroad, etc.)
???? China refined oil and filling station market (including gasoline and diesel production and sales volume; price trend; refined oil enterprises; number, distribution and competition pattern of filling stations; etc.)
???? China motor vehicle and filling station market (involving production and ownership of cars, motorcycles and other motor vehicles; average number of motor vehicles and cars served by each filling station; filling station market in China’s four municipalities; etc.)
???? Global and China?refueling station market (embracing market overview; global and China natural gas vehicle ownership; number, competition pattern and development prospect of global and China natural gas station, etc.)
???? Analysis (revenue, revenue structure, net income, gross margin, refined oil sales, filling station business, etc.) on leading companies (such as Shell Oil Company, BP, Sinopec, PetroChina, etc.) in global and China filling station industry.
1. Overview of Filling Station Industry
1.1 Definition and Classification
1.1.1 Definition
1.1.2 Classification
1.2 Major Clients and Consumption Characteristics
1.3 Business Model and Strategy of Filling Stations at home and Abroad
1.3.1 Business Model (By Entities)
1.3.1.1 COCO
1.3.1.2 CODO
1.3.1.3 DODO
1.3.1.4 Franchise
1.3.2 Business Model of Filling Station in Europe (by Business)
1.3.3 Business Model of Filling Station in the United States (by Business)
1.3.4 Business Model of Filling Station in Japan (by Business)
1.3.5 Business Strategy of Filling Station in China
2. China Refined Oil and Filling Station Market
2.1 Refined Oil Production and Sales
2.2 Refined Oil Production and Sales by Segmented Products
2.2.1 Diesel
2.2.2 Gasoline
2.2.3 Kerosene
2.3 Refined Oil Prices
2.3.1 Gasoline
2.3.2 Diesel
2.4 Refined Oil Enterprises
2.4.1 Market Situation
2.4.2 Distribution Enterprises
2.4.3 Employees
2.4.4 Operation
2.5 Filling Station
2.5.1 Number and Distribution
2.5.2 Non-oil Business
2.5.3 Filling Station Chain
2.5.4 Competition Pattern
3. China Motor Vehicle and Filling Station Market
3.1 Motor Vehicle Ownership
3.1.1 Overall Market
3.1.2 Regional Market
3.2 Vehicle Production
3.2.1 Overall Market
3.2.2 Vehicle Production (by Models)
3.2.3 Vehicle Production (by Power)
3.3 Car Ownership
3.3.1 Overall Market
3.3.2 Regional Market
3.4 Motorcycle Production and Ownership
3.4.1 Motorcycle Production
3.4.2 Motorcycle Ownership
3.5 Filling Station and Motor Vehicle Market
3.5.1 Difference between Filling Station and Motor Vehicle Numbers
3.5.2 Average Number of Motor Vehicles Served by Each Filling Station
3.6 Regional Filling Station Markets
3.6.1 Beijing
3.6.1.1 Civilian Vehicle Ownership
3.6.1.2 Gasoline and Diesel Consumption
3.6.1.3 Number of Filling Stations
3.6.2 Tianjin
3.6.2.1 Civilian Vehicle Ownership
3.6.2.2 Gasoline and Diesel Consumption
3.6.2.3 Number of Filling Stations
3.6.3 Shanghai
3.6.3.1 Civilian Vehicle Ownership
3.6.3.2 Gasoline and Diesel Consumption
3.6.3.3 Number of Filling Stations
3.6.4 Chongqing
3.6.4.1 Civilian Vehicle Ownership
3.6.4.2 Gasoline and Diesel Consumption
3.6.4.3 Number of Filling Stations
4. Global and Chinese Refueling Station Market
4.1 Market Overview
4.1.1 Overview
4.1.2 Natural Gas Station
4.1.3 LPG Station
4.2 Natural Gas Vehicles
4.2.1 Market Overview
4.2.2 Global Market
4.2.3 Chinese Market
4.3 Natural Gas Station
4.3.1 Global Market
4.3.2 Chinese Market
4.4 Competition Pattern
4.5 Development Prospect
5. Key Filling Station Enterprises Abroad
5.1 Shell
5.1.1 Profile
5.1.2 Business Performance
5.1.3 Revenue Structure
5.1.4 Filling Station Business
5.1.5 LNG Business
5.1.6 Filling Station Business in China
5.2 BP
5.2.1 Profile
5.2.2 Business Performance
5.2.3 Revenue Structure
5.2.4 Filling Station Business
5.2.5 Filling Station Business in China
5.3 ExxonMobil
5.3.1 Profile
5.3.2 Business Performance
5.3.3 Revenue Structure
5.3.4 Filling Station Business
5.4 Total
5.4.1 Profile
5.4.2 Business Performance
5.4.3 Filling Station Business
5.4.4 Filling Station Business in China
6. Key Filling Station Enterprises in China
6.1 Sinopec
6.1.1 Profile
6.1.2 Business Performance
6.1.3 Revenue Structure
6.1.4 Gross Margin
6.1.5 Gasoline, Diesel and Natural Gas Sales
6.1.6 Filling Station Business
6.1.7 Business Plan
6.1.8 Development Prospect
6.2 PetroChina
6.2.1 Profile
6.2.2 Business Performance
6.2.3 Revenue Structure
6.2.4 Gross Margin
6.2.5 Gasoline, Diesel and Natural Gas Sales
6.2.6 Filling Station Business
6.2.7 Business Plan
6.3 CNOOC
6.3.1 Profile
6.3.2 Business Performance
6.3.3 Revenue Structure
6.3.4 Filling Station Business
6.3.5 Development Prospect
7. Summary and Forecast
7.1 Filling Stations and Refueling Stations
7.1.1 Number of Filling Stations and Refueling Stations
7.1.2 Number of Cars Served by Filling Stations and Refueling Stations
7.2 Comparison of Listed Companies
7.2.1 Revenue
7.2.2 Net Income
7.2.3 Net Profit Margin
7.2.4 Number of Filling Stations
Classification of Filling Station by Grade
Consumption Characteristics and Habits of Filling Station Clients
China’s Refined Oil Production and YoY Growth, 2006-2013
China’s Refined Oil Sales Volume and YoY Growth, 2006-2013
China’s Refined Oil Apparent Consumption and YoY Growth, 2006-2013
China’s Diesel Production and YoY Growth, 2006-2013
China’s Diesel Sales Volume and YoY Growth, 2006-2013
China’s Diesel Apparent Consumption and YoY Growth, 2006-2013
Proportion of Diesel Production and Apparent Consumption in Refined Oil in China, 2006-2013
China’s Gasoline Production and YoY Growth, 2006-2013
China’s Gasoline Sales Volume and YoY Growth, 2006-2013
China’s Gasoline Apparent Consumption and YoY Growth, 2006-2013
Proportion of Gasoline Production and Apparent Consumption in Refined Oil in China, 2006-2013
China’s Kerosene Production and YoY Growth, 2006-2013
China’s Kerosene Sales Volume and YoY Growth, 2006-2013
China’s Kerosene Apparent Consumption and YoY Growth, 2006-2013
Proportion of Kerosene Production and Apparent Consumption in Refined Oil in China, 2006-2013
China’s Gasoline Retail Prices (Main Grades), 2009-2013
China’s Diesel Retail Prices (Main Grades), 2009-2013
Number of Refined Oil Wholesale, Storage and Retail Enterprises in China, 2006-2012
Number of State-owned, Private and Foreign Refined Oil Enterprises in China, 2012
Number of Employees Working for State-owned, Private and Foreign Refined Oil Wholesale, Storage and Retail Enterprises in China, 2012
China’s Diesel /Gasoline /Kerosene Wholesale Quantity, Storage Capacity, Retail Sales and YoY Growth, 2012
Number of Filling Stations in China and YoY Growth, 2006-2016
Regional Distribution of Filling Stations in China, 2012
Number of Filling Stations Conducting Non-oil Business in China and Sales from Non-oil Business, 2009-2012
Store Number of Filling Station Chains in China, 2006-2012
Employee Number of Filling Station Chains in China, 2006-2012
Business Area of Filling Station Chains in China and YoY Growth, 2006-2012
Sales of Filling Station Chains in China and YoY Growth, 2006-2012
Number and Market Share of State-owned, Private and Foreign Filling Stations in China, 2010&2012
10 Most Powerful Companies in China Filling Station Industry, 2012
Entry Time and Layout Area of Foreign Companies in China Filling Station Market
China’s Motor Vehicle Ownership and YoY Growth, 2006-2016
China’s Motor Vehicle Ownership Structure, 2013
China’s Motor Vehicle Ownership and Market Share by Provinces / Municipalities, 2013
China’s Vehicle Production and YoY Growth, 2006-2013
China’s Vehicle Production Structure (by Models), 2006-2013
China’s Car Production and YoY Growth, 2006-2013
China’s Truck Production and YoY Growth, 2006-2013
China’s Highway Bus Production and YoY Growth, 2006-2013
China’s Vehicle Production Structure (by Power), 2006-2012
China’s Gasoline Vehicle Production and YoY Growth, 2006-2012
China’s Diesel Vehicle Production and YoY Growth, 2006-2012
China’s Vehicle Ownership and YoY Growth, 2006-2016
China’s Civilian Vehicle Ownership and YoY Growth, 2006-2016
Proportion of China’s Civilian Vehicle Ownership in Motor Vehicle Ownership, 2006-2016
Average Household Vehicle Ownership per Million Urban Households in China and YoY Growth, 2006-2016
Top 10 Chinese Cities by Vehicle Ownership, 2013
China’s Civilian Vehicle Ownership and Market Share by Provinces / Municipalities, 2012
Average Household Vehicle Ownership per Million Urban Households in China (by Provinces / Municipalities), 2012
China’s Motorcycle Production and YoY Growth, 2006-2013
China’s Motorcycle Ownership and YoY Growth, 2006-2016
Average Motorcycle Ownership per Million Urban and Rural Households in China, 2006-2016
Number of Filling Stations and Motor Vehicle/Car /Civilian Vehicle Ownerships in China, 2006-2016
Growth of Filling Station Numbers and Growth of Motor Vehicle/Car / Civilian Vehicle Ownerships in China, 2007-2016
Number of Motor Vehicles, Cars and Civilian Vehicles Served by Each Filling Station in China, 2006-2016
Beijing’s Civilian Vehicle Ownership and YoY Growth, 2006-2016
Beijing’s Gasoline Consumption and YoY Growth, 2006-2016
Beijing’s Diesel Consumption and YoY Growth, 2006-2016
Number of Filling Stations and Civilian Vehicles Served by Each Filling Station in Beijing, 2008-2016
Tianjin’s Civilian Vehicle Ownership and YoY Growth, 2006-2016
Tianjin’s Gasoline Consumption and YoY Growth, 2006-2016
Beijing’s Diesel Consumption and YoY Growth, 2006-2016
Number of Filling Stations and Civilian Vehicles Served by Each Filling Station in Tianjin, 2010-2016
Shanghai’s Civilian Vehicle Ownership and YoY Growth, 2006-2016
Shanghai’s Gasoline Consumption and YoY Growth, 2006-2016
Shanghai’s Diesel Consumption and YoY Growth, 2006-2016
Number of Filling Stations and Civilian Vehicles Served by Each Filling Station in Shanghai, 2010-2016
Chongqing’s Civilian Vehicle Ownership and YoY Growth, 2006-2016
Chongqing’s Gasoline Consumption and YoY Growth, 2006-2016
Chongqing’s Diesel Consumption and YoY Growth, 2006-2016
Number of Filling Stations and Civilian Vehicles Served by Each Filling Station in Chongqing, 2011-2016
Classification of Natural Gas Station
Advantages and Disadvantages of LNG and CNG
Global Natural Gas Vehicle Ownership and YoY Growth, 2006-2016
Natural Gas Vehicle Ownership of the World’s Major Countries, 2006-2011
Global Natural Gas Vehicle Ownership Growth Rate by Regions, 2006-2011
China’s Natural Gas Vehicle Ownership and YoY Growth, 2006-2016
Number of Global Natural Gas Stations and YoY Growth, 2007-2016
Number of Natural Gas Stations in the World’s Major Countries, 2007-2011
Global Natural Gas Station Ownership Growth Rate by Regions, 2008-2011
Average Quantity of Cars Served by Each Natural Gas Station Worldwide, 2007-2016
Number of Natural Gas Stations in China and YoY Growth, 2007-2016
Average Quantity of Cars Served by Each Natural Gas Station in China, 2007-2016
Revenue and YoY Growth of Shell, 2008-2013
Net Income and YoY Growth of Shell, 2008-2013
Revenue Structure of Shell (by Business), 2010-2012
Revenue Structure of Shell (by Region), 2010-2012
Number of Shell Filling Stations (by Region), 2008-2012
Number of Shell Filling Stations in China (by Provinces / Municipalities)
Revenue and YoY Growth of BP, 2008-2013
Net Income and YoY Growth of BP, 2008-2013
Revenue Structure of BP (by Business), 2008-2013
Number of BP Filling Stations (by Region), 2010-2012
Revenue and YoY Growth of ExxonMobil, 2008-2013
Net Income and YoY Growth of ExxonMobil, 2008-2013
Revenue Structure of ExxonMobil (by Region), 2010-2012
Revenue and YoY Growth of Total, 2008-2013
Net Income and YoY Growth of Total, 2008-2013
Number of Total Filling Stations (by Region), 2012
Revenue and YoY Growth of Sinopec, 2008-2013
Net Income and YoY Growth of Sinopec, 2008-2013
Revenue Structure of Sinopec (by Business), 2008-2013
Gross Margin of Sinopec (by Business), 2008-2013
Gasoline Sales Volume and YoY Growth of Sinopec, 2006-2013
Diesel Sales Volume and YoY Growth of Sinopec, 2006-2013
Natural Gas Sales Volume and YoY Growth of Sinopec, 2006-2013
Number and Market Share of Sinopec Filling Stations, 2006-2016
Average Daily Refueling Capacity per Sinopec Filling Station and YoY Growth, 2006-2016
Revenue and YoY Growth of Sinopec, 2013-2016
Revenue and YoY Growth of PetroChina, 2008-2013
Net Income and YoY Growth of PetroChina, 2008-2013
Revenue Structure of PetroChina (by Business), 2008-2013
Revenue Structure of PetroChina (by Region), 2008-2013
Gross Margin of PetroChina (by Business), 2008-2013
Gasoline Sales Volume and YoY Growth of PetroChina, 2006-2013
Diesel Sales Volume and YoY Growth of PetroChina, 2006-2013
Natural Gas Sales Volume and YoY Growth of PetroChina, 2006-2013
Number and Market Share of PetroChina Filling Stations, 2006-2016
Average Daily Refueling Capacity per PetroChina Filling Station and YoY Growth, 2006-2016
Revenue and YoY Growth of PetroChina, 2013-2016
Revenue and YoY Growth of CNOOC, 2008-2013
Net Income and YoY Growth of CNOOC, 2008-2013
Revenue Structure of CNOOC (by Business), 2008-2013
CNOOC Marketing Network Distribution by End-2012
Number of CNOOC Filling Stations and YoY Growth, 2009-2012
Revenue and YoY Growth of CNOOC, 2013-2016
Comparison between Filling Station and Natural Gas Station Numbers in China, 2007-2016
Comparison between Filling Station and Natural Gas Station Number Growth in China, 2007-2016
Comparison between Numbers of Vehicles Served by Each Filling Station and Natural Gas Station in China, 2007-2016
Comparison between Revenue of Global and China’s Major Oil Companies, 2008-2013
Comparison between Revenue Growth of Global and China’s Major Oil Companies, 2009-2013
Comparison between Net Income of Global and China’s Major Oil Companies, 2008-2013
Comparison between Net Income Growth of Global and China’s Major Oil Companies, 2009-2013
Comparison between Net Profit Margin of Global and China’s Major Oil Companies, 2008-2013
Comparison between Filling Station Numbers of China’s Major Oil Companies, 2012
Global and China Wind Farm O&M Industry Report, 2017-2021
As the wind power installed capacity grows and the warranty period of a large number of wind turbines is coming to an end, wind farm O & M has become the focus of the industry. In 2016, the global...
Global and China Electrical Energy Storage (EES) Industry Report, 2016-2020
Energy storage finds widespread application in power system, involving power generation, transmission, distribution, and end users. Global cumulative installed capacity of electrical energy storage (E...
Global and China Wind Farm Operation and Maintenance Industry Report, 2015-2018
In 2014, the global wind farm O & M market size hit USD9.25 billion, representing a year-on-year growth rate of 25.8%; by 2018, the market size is expected to reach USD13.78 billion. The mainstrea...
China Energy Storage for Grid System Industry Report, 2015-2018
Energy storage finds wide application in electric power system, involving all aspects of power generation, transmission, distribution and end user. Technically, energy storage for grid system can be d...
China Energy Conservation Service Industry Report, 2015
Energy conservation service industry provides service and support for enterprises and projects in terms of energy conservation and emission reduction. An Energy Service Company, more commonly referred...
China Natural Gas Fueling Station Equipment Industry Report, 2015-2018
According to different fuels used by natural gas stations, gas station equipment can be divided into compressed natural gas (CNG) station equipment and liquefied natural gas (LNG) station equipment. T...
China Filling Station and Gas Station Industry Report,2015-2018
Filling Stations By the end of 2014, China had run a total of 99,000 filling stations, each of which served 1,456 civilian cars; Shandong, Hebei, Henan, Guangdong and Jiangsu ranked top five by the nu...
China Biodiesel Industry Report, 2014-2017
Biodiesel refers to a renewable diesel fuel made from oil crops, animal fats, food waste oil that can substitute petroleum diesel and has environmental protection, safety, renewability and other advan...
China Filling Station And Refueling Station Industry Report,2013-2016
By the end of 2012, China has had a total of 96,313 filling stations, an increase of 875 or up 0.92% compared to 2011, including 51,854 SOE filling stations (53.8% of the total), 42,425 private fillin...