Global and China Touch Screen (Panel)Industry Report, 2014-2015
-
Dec.2014
- Hard Copy
- USD
$2,600
-
- Pages:151
- Single User License
(PDF Unprintable)
- USD
$2,400
-
- Code:
ZYW193
- Enterprise-wide License
(PDF Printable & Editable)
- USD
$3,900
-
- Hard Copy + Single User License
- USD
$2,800
-
The report covers the followings:
1, Development trends of touch screen technology
2, Trends of touch screen market
3, Analysis on the touch screen industry
4, Study on 22 major touch screen vendors
5, Research on 5 touch screen glass vendors
The core of the touch screen market is reflected in smartphones and Tablet PCs, both of which will be in trouble in the next three years. The smartphone market has obviously been saturated and slowed down. China exceeds the United States to see the highest smartphone penetration rate. However, the Chinese smartphone market where a person often holds two smartphones is the first one that suffers recession in the world. From January to October of 2014, China's smartphone shipment dropped down 10.4% year on year to 312 million. China's sluggish economy is also a reason for the decline.
The Tablet PC market witnesses saturation as well. Impacted by bigger and bigger mobile phone screens, the market of Tablet PCs featured with simple functions stopped growth to descend in 2014. In terms of willingness-to-buy, adults would like to buy Tablet PCs for children, marking low replacement frequency. In the next few years, the Tablet PC market will be in a mild recession, which even can not be reversed by Apple’s upcoming 12.9-inch Tablet PCs.
Touch laptops may disappear completely, especially clamshell ones which are mainly used in offices with meaningless touch function. 2in1 laptops are inferior to clamshell laptops in performance, but are much expensive than Tablet PCs and clamshell laptops, so the 2in1 laptop market will shrink.
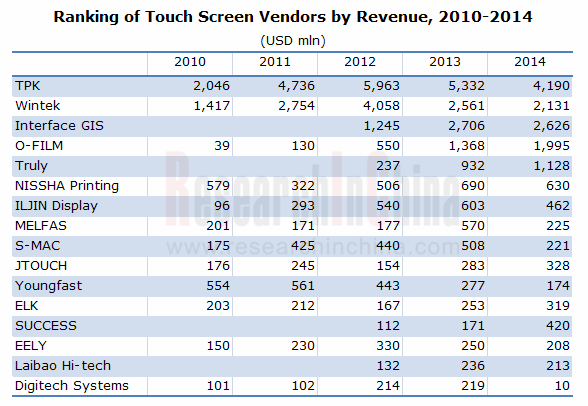
For Out-Cell touch screen vendors, In-Cell and On-Cell threaten their market, the downstream market halted, and the Out-Cell touch screen capacity is excess dramatically. In 2014, the Out-Cell touch screen market witnessed a fierce price war, the market size shrunk by 16.2%, especially South Korean and Taiwanese vendors suffered the hugest losses and some of them lost the revenue by 50%, let alone bankrupt small vendors.
Wintek (annual revenue: more than USD2 billion) and Digitech Systems (annual revenue: over USD200 million) were also listed in the considerable collapsed Out-Cell touch screen vendors in 2014. In 2015, the Out-Cell touch screen market will still see significant oversupply, particularly the field of touch screens used for Tablet PCs and laptops; meanwhile, the market will decline by 10.3%.
In-Cell and On-Cell vendors will triumph. Their price disadvantage will gradually vanish with more mature technology and high output. 50% of touch screens will adopt In-Cell or On-Cell in 2016, much higher than 31% in 2014.
1. Overview of Touch Screen
1.1 Touch Screen Structure
1.2 Glass-to-glass (G/G)
1.3 Glass-to-film-to-film (G/F/F)
1.4 G1F
1.5 TOC
1.6 ON-CELL
1.7 IN-CELL
1.8 Development Trends of Medium-sized Touch Screen
1.9 Development Trends of Laptop Touch Screen
1.10 AIO PC Touch Screen
1.11 Advantages of Metal Mesh
1.12 Metal Mesh Supply Chain
1.13 Silver Nanofiber Wire
2 Touch Screen Market and Industry
2.1 Global Mobile Phone Market
2.2 Global Smartphone Market
2.3 Chinese Mobile Phone Market
2.4 Tablet PC Market
2.5 Development Trends of Global Mobile Phone Display
2.6 Development Trends of Chinese Mobile Phone Display
2.7 Global Mobile Phone Display Industry
2.8 Supply Relationship between Mobile Phone Display Vendors and Mobile Phone Brand Vendors
3 Touch Screen Industry
3.1 Touch Screen Market Size
3.2 ITO Film Market Size
3.3 ITO Film Supply Chain
3.4 ITO Film Industry
3.5 Ranking of Touch Screen Vendors
3.6 Supply Relationship between Touch Screen Vendors and Clients
4. Major Touch Screen Vendors
4.1 Innolux
4.2 Truly
4.3 LG Display
4.4 Samsung Display
4.5 Sharp
4.6 Wintek
4.7 Young Fast
4.8 JTOUCH
4.9 SMAC
4.10 ILJIN Display
4.11 Melfas
4.12 ELK
4.13 Digitech Systems
4.14 Sintek Photronic
4.15 Cando
4.16 TPK
4.17 Mutto Optronics
4.18 Laibao Hi-tech
4.19 Shenzhen O-Film Tech
4.20 GIS
4.21 Success Electronics
4.22 NISSHA Printing
5 Touch Screen Glass Vendors
5.1 Aimcore
5.2 Token
5.3 G-tech Optoelectronics
5.4 Shenzhen Lens
5.5 Boerni
Glass-to-glass (G/G) Projected Capacitive Touch Screen (P-cap Touch)
Glass-to-film-to-film (G/F/F) Projected Capacitive Touch Screen
G1F Touch
TOC Touch Screen
Sheet-based TOC
Piece-based TOC
Medium-sized Touch Screen by Technology, 2011-2015E
Laptop Touch Screen Shipment by Technology, 2012-2016E
AIO PC Touch Screen Shipment by Technology, 2012-2016E
Silver Nanofiber Wire Supply Chain
Global Mobile Phone Shipment, 2007-2015E
Global 3G/4G Mobile Phone Shipment by Region, 2011-2014
Worldwide Mobile Phone Sales to End Users by Vendor in 2013 (Thousands of Units)
Worldwide Smartphone Sales to End Users by Vendor in 2013 (Thousands of Units)
Worldwide Smartphone Sales to End Users by Operating System in 2013 (Thousands of Units)
Shipment of Global Top 13 Smartphone Vendors, 2013-2015E
China’s Mobile Phone Monthly Shipment, Jan-Oct 2014
Share of Major Vendors in Chinese Smartphone Market, 2014
Share of Major Vendors in Chinese 4G Mobile Phone Market, 2014
Global Tablet PC Shipment, 2011-2016E
Market Share of Main Tablet PC Brands, 2013
Output of Global Tablet PC Vendors, 2012-2013
Development Trends of Global Smartphone Display Size, 2013-2017E
Development Trends of Global Smartphone Touch Technology, 2013-2017E
Development Trends of Global Smartphone Display Technology, 2013-2017E
Development Trends of Global Smartphone Display Resolution, 2013-2017E
Chinese Mobile Phone Market by Size, 2014
Development Trends of China's Smartphone Display Size, 2013-2017E
Chinese Smartphone Market by Resolution, 2014
Development Trends of China's Smartphone Display Resolution, 2013-2017E
Chinese Mobile Phone Market by PPI, 2014
Development Trends of China's Smartphone Display Technology, 2013-2017E
Shipment of Major Global Small and Medium-Sized Display Vendors, 2013-2014
Market Share of Major Mobile Phone Display Vendors in China, 2014
Share of Major Suppliers of Samsung's Mobile Phone Display, 2014
Share of Major Suppliers of APPLE's Mobile Phone Display, 2014
Share of Major Suppliers of HUAWEI's Mobile Phone Display, 2014
Share of Major Suppliers of LENOVO's Mobile Phone Display, 2014
Share of Major Suppliers of ZTE's Mobile Phone Display, 2014
Share of Major Suppliers of COOLPAD's Mobile Phone Display, 2014
Share of Major Suppliers of OPPO's Mobile Phone Display, 2014
Share of Major Suppliers of XIAOMI's Mobile Phone Display, 2014
Share of Major Suppliers of Vivo's Mobile Phone Display, 2014
Touch Screen Industry Chain
Global Touch Screen Market Size, 2010-2016E
Global Touch Screen Market Size (Shipment), 2010-2016E
Touch Screen Material Market Size, 2012-2017E
Shipment of ITO FILM Market, 2011-2016E
ITO FILM Market Size, 2011-2016E
ITO Film Structure
ITO Film Supply Chain
Comparison between Major ITO Film Vendors in Performance
Market Share of Major Global ITO Film Vendors, 2013
Ranking of Touch Screen Vendors by Revenue, 2010-2014
Operating Profit Margin of Touch Screen Vendors, 2012-2013
Market Share of Samsung's Mobile Phone Touch Screen Suppliers, 2012-2013
Market Share of Samsung's Tablet PC Touch Screen Suppliers, 2012-2013
Share of Nokia's Major Touch Screen Suppliers, 2014
Share of LG's Major Touch Screen Suppliers, 2012
Share of HTC's Major Touch Screen Suppliers, 2012
INNOLUX's Organizational Structure
INNOLUX's Revenue and Operating Margin, 2010-2014
INNOLUX's Revenue, Gross Margin and EBITDA Margin, Q4 2012-Q3 2014
INNOLUX's Total Debt and Debt Ratio, Q4 2012-Q3 2014
INNOLUX's Inventory, Q4 2012-Q3 2014
INNOLUX's Area Shipment and TFT- LCD ASP Trends, Q4 2012-Q3 2014
INNOLUX's Small & Medium Size Unit Shipment and Sales, Q4 2012-Q3 2014
INNOLUX's Sales Breakdown by Application, Q4 2012-Q3 2014
INNOLUX's Sales Breakdown by Size, Q4 2012-Q3 2014
Profile of INNOLUX's TFT-LCD Fabs
Profile of Touch Sensor Fabs
Truly's Revenue and Operating Margin, 2005-2014
Truly's Quarterly Revenue and Gross Margin, Q1 2013-Q4 2014
Truly's LCD Revenue by Technology, 2006-2011
Truly's Semiconductor Revenue by Business, 2012-2015E
Truly's Semiconductor Shipment by Product, 2012-2015E
Truly's Semiconductor ASP by Product, 2012-2015E
Truly's Mobile Phone LCD Major Customers
Major Customers of Truly's Automotive Displays
Truly's Touch Screen Capacity
Truly's Major CCM Customers
Revenue and Operating Margin of LG Display, 2009-2015E
Quarterly Revenue and Gross Margin of LG Display, Q1 2013-Q3 2014
Statements of Financial Position of LG DISPLAY IFRS, 2012-2014
Shipment of LG Display by Application, 2009-2013
Revenue of LG Display by Application, 2009-2013
Revenue of LG Display by Region, 2011-2013
Quarterly Shipment and ASP of LG Display, Q3 2013-Q3 2014
Quarterly Revenue of LG Display by Application, Q3 2013-Q3 2014
Quarterly Producible of LG Display by Area, Q3 2013-Q3 2014
Capacity of LG Display's Fabs
Capacity of LG Display's Fabs, 2011-2013
Footprint of LG Display
Manufacturing Base Footprint of LG Display
Revenue and Operating Margin of Samsung's DP Division, 2010-2015E
Revenue of Samsung's DP Division by Product, 2012-2015E
Revenue and Operating Profit of Samsung's DP Division, 2012-2015E
Samsung's Production Lines
Sharp's Revenue and Operating Margin, FY2008-FY2015
Sharp's Revenue by Business, FY2013-FY2015
Sharp's Operating Margin by Business, FY2013-FY2015
Sharp's Mobile Phone Panel Resolution, 2013-2014
Sharp’s Production Lines
Wintek's Revenue and Gross Margin, 2003-2013
Wintek's Revenue and Operating Margin, 2003-2013
Wintek's Monthly Revenue, Nov 2012-Nov 2014
Wintek's Global Distribution
Wintek's Revenue by Technology, 2006-2011
Wintek's Revenue by Customer, 2009-2012
Wintek's Sales Volume, Revenue and ASP, 2010-2011
Wintek's Capacity, Output and Sales Volume, 2012-2013
Wintek's Capacitive Touch Screen Capacity
Wintek's Touch Screen Cover Glass Capacity
Wintek's ATT Structure
Wintek's ATT Process
Comparison between Wintek's ATT and Traditional Capacitive G / G Touch Screen
Revenue and Operating Margin of Young Fast, 2005-2014
Monthly Revenue and Growth Rate of Young Fast, Nov 2011- Nov 2014
Revenue of Young Fast by Customer, 2010-2013
Capacity \ Output \ Sales Volume of Young Fast, 2008-2013
JTOUCH's Revenue and Operating Margin, 2006-2014
JTOUCH's Monthly Revenue and Growth Rate, Nov 2012-Nov 2014
JTOUCH's Capacity \ Output \ Sales Volume, 2008-2013
JTOUCH's Revenue by Region, 2008-2011
S-MAC's Revenue and Operating Margin, 2005-2014
S-MAC's Production Process
S-MAC's Quarterly Revenue and Operating Margin, Q1 2013-Q4 2014
S-MAC's Quarterly Revenue by Business, Q1 2013-2014
Organizational Structure of ILJIN Display
Revenue and Operating Margin of ILJIN Display, 2008-2014
Quarterly Revenue and Operating Margin of ILJIN Display, Q1 2012-Q4 2014
Revenue of ILJIN Display by Business, Q1 2011-Q4 2013
7-inch TSP Output of ILJIN Display, Q1 2010-Q4 2013
Revenue and Operating Margin of Melfas, 2007-2014
Revenue of Melfas by Product, 2007-2014
Quarterly Revenue and Operating Margin of Melfas, Q1 2013-Q4 2014
ELK's Revenue and Operating Margin, 2006-2014
ELK's Revenue by Application, 2012-2013
ELK's Revenue Customer Distribution, 2012-2013
Revenue and Operating Margin of Digitech Systems, 2007-2013
Revenue of Digitech Systems by Product, 2009-2012
Organizational Structure of Sintek Photronic
Revenue and Operating Margin of Sintek Photronic, 2004-2014
Monthly Revenue and Growth Rate of Sintek Photronic, Nov 2012-Nov 2014
Cando's Revenue and Operating Margin, 2004-2014
Cando's Monthly Revenue and Growth Rate, Nov 2012-Nov 2014
TPK's Organizational Chart
TPK's Revenue, Gross Margin and Operating Margin, 2007-2014
TPK's Quarterly Revenue and Operating Margin, Q1 2012-Q3 2014
TPK's Quarterly Revenue and Gross Margin, Q1 2011-Q3 2014
TPK's Quarterly Revenue by Size, Q1 2013-Q3 2014
TPK's Monthly Revenue and Growth Rate, Nov 2012-Nov 2014
Touch Screen Capacity, Output and Sales Volume of TPK Holding, 2008-2013
TPK's Revenue by Application, 2011-2013
Relationship between TPK Holding and Affiliated Companies
Revenue and Growth Rate of Mutto Optronics, May 2010-May 2012
Revenue and Operating Margin of Mutto Optronics, 2008-2013
Revenue of Mutto Optronics by Customer, 2012
Revenue and Net Income of Laibao Hi-tech, 2005-2014
Revenue by Business of Laibao Hi-tech, 2012-H1 2014
Revenue and Operating Margin of Shenzhen O-Film Tech, 2007-2015E
Revenue of Shenzhen O-Film Tech by Product, 2009-2015E
Quarterly Revenue of Shenzhen O-Film Tech, Q1 2009-Q3 2014
Quarterly Gross Margin of Shenzhen O-Film Tech, Q1 2009-Q3 2014
Customer Structure of Shenzhen O-Film Tech, 2012-2014
Structure of GIS
Revenue and Operating Margin of GIS, 2011-2016E
Revenue and Gross Margin of GIS, 2011-2016E
Capacity, Output and Capacity Utilization Rate of GIS, 2013
Sales Volume of GIS, 2012-2013
% of Mobile Phone Touch in Total Revenue of GIS and Gross Margin, 2012-2014
% of Tablet PC Touch in Total Revenue of GIS and Gross Margin, 2012-2014
Number of Employees of GIS, Sep 30, 2014
Employees of GIS by Educational Background, Sep 30, 2014
Employees of GIS by Region, Sep 30, 2014
R & D Organizational Structure of GIS
Production Organizational Structure of GIS
Mobile Phone Touch Cost Structure, 2012-2014
Tablet PC Touch Cost Structure, 2012-2014
Financial Summary of Subsidiaries of GIS, 2013-2014
Revenue and Operating Profit of Success Electronics, 2008-2014
Revenue of Success Electronics by Product, 2012-2014
NISSHA's Revenue and Operating Margin, FY2005-2015
NISSHA's Revenue by Business, FY2009-FY2015
NISSHA's Touch Panel Revenue by Application, FY2009-FY2015
Quarterly Revenue and Operating Margin of NISSHA, Q4 2012-Q3 2014
Quarterly Revenue and Operating Margin of NISSHA’s Touch Panel Business, Q1 2012-Q3 2014
Aimcore's Organizational Structure
Profile of Aimcore's Departments
Aimcore's Revenue and Gross Margin, 2006-2014
Aimcore's Revenue and Growth Rate, Nov 2012-Nov 2014
Token's Organizational Structure
Token's Revenue and Operating Margin, 2007-2014
Revenue and Operating Margin of G-tech Optoelectronics, 2007-2014
Monthly Revenue and Growth Rate of G-tech Optoelectronics, Nov 2012-Nov 2014
Revenue of G-tech Optoelectronics by Product, 2010-2013
Global Distribution of G-tech Optoelectronics
Business Models of G-tech Optoelectronics
Main Products of G-tech Optoelectronics
Major Customers of G-tech Optoelectronics
Customer Distribution of Shenzhen Lens, 2013
Revenue, Operating Profit and Net Income of Shenzhen Lens, 2011-2014
Assets and Liabilities of Shenzhen Lens, 2011-2013
Cash Flow of Shenzhen Lens, 2011-2013
Key Financial Indicators of Shenzhen Lens, 2011-2013
Shareholder Structure of Shenzhen Lens
Organizational Structure of Shenzhen Lens
Revenue and Net Income of Major Subsidiaries of Shenzhen Lens, 2013
Supply Structure of Major Suppliers of Shenzhen Lens, 2013
Global and China PCB Industry Chain Panorama (Copper Clad Laminate, Copper Foil, Electronic Resin, Electronic Fabric, Special Equipment) Industry Research Report, 2026
PCB: The Core "Skeleton" and "Nerve Center" of Electronic Devices
Printed Circuit Board (PCB) refers to a circuit board that forms copper circuit patterns on a copper-clad laminate according to a pre...
Global and China CMOS Camera Module (CCM) Industry Report, 2020-2026
The global CCM market has been ballooning thanks to expeditious penetration of multi-camera phones and advances in automotive ADAS, being worth $22.723 billion with a year-on-year spike of 16.6% in 20...
Global and China Multi-Layer Ceramic Capacitor (MLCC) Industry Report, 2020-2025
Electronic components like MLCC enjoy a rosy prospect alongside the burgeoning electronic manufacturing, the thriving internet and the prevalence of smart hardware.
MLCC was much sought after and it...
Global and China Voice Coil Motor (VCM) Industry Report, 2019-2025
VCM (voice circle motor or voice coil actuator), a part for smartphone camera, shares around 6% of smartphone camera industry chain value.
Globally, popularity of smartphones such as those with mult...
Global and China Aluminum Electrolytic Capacitor Industry Report, 2019-2025
Chinese aluminum electrolytic capacitor market has been expanding amid a transfer of its downstream industries to China like home appliance illumination, cellphones and computers as well as automatic ...
Global and China Flexible Printed Circuit (FPC) Industry Report, 2019-2025
Flexible printed circuit (FPC) products make their way into consumer electronics like smartphone and tablet PC, in the form of modules for display, touch control, fingerprint recognition, etc. The vol...
Global and China GaAs Industry Report, 2019-2025
Gallium arsenide (GaAs), one of the most mature compound semiconductors, is an integral part of smartphone power amplifier (PA). In 2018, GaAs-based radio frequency (RF) seized over half of the GaAs w...
Global and China Advanced Packaging Industry Report, 2019-2025
The global semiconductor packaging and testing market is enlarging with the prevalence of consumer electronics, automotive semiconductors and the Internet of Things (IoT), with its size edging up 2.5%...
Global and China MLCC Electronic Ceramics Industry Report, 2019-2025
MLCC is mainly used in audio and video equipment, mobile phones, computers and automobiles. The prospective boom of MLCC formula powder hinges on demand: 1) The accelerated renewal of consumer electro...
Global and China OLED Industry Report, 2019-2025
OLED, a new-generation display technology, features simple display structure, green consumables and flexibility and can be rolled up, which makes it easier to transport and install without considering...
Global and China Camera Module Industry Report, 2019-2025
Affected by factors like the maturity of mobile phone markets worldwide and the prolonged replacement of mobile phone by users, the mobile phone market has undergone a slowdown in growth rate. From Q4...
Global and China Multi-Layer Ceramic Capacitor (MLCC) Industry Report, 2018-2023
MLCC finds most application in consumer electronics, automobile and industrial fields and gets beefed up remarkably with the approaching 5G era of cellphones and tablet PCs, the advances in automotive...
Global and China Aluminum Electrolytic Capacitor Industry Report, 2018-2023
Aluminum electrolytic capacitor, a core electronic component, is widely used in consumer electronics, computers and peripherals, industry, electric power, lighting and automobiles.
Global aluminum e...
Global and China CMOS Camera System Industry Report, 2017-2021
Global CCM (CMOS Camera Module) market was worth USD16.611 billion in 2015, a year-on-year rise of 3.8% from 2014, the slowest rate since 2010. Global market fell modestly in 2016 due to a drop in shi...
Global and China Organic Light-Emitting Diode (OLED) Industry Report, 2017-2021
Global OLED market size approximated USD15.7 billion in 2016, a 20.8% rise from a year earlier. Stimulated by reports that Apple will adopt OLED screen for multiple iPhone models in 2017-2018, OLED sc...
Global and China CMOS Camera System Industry Report, 2016-2020
Global and China CMOS Camera System Industry Report, 2016-2020 covers the following:1. Analysis of CMOS Image Sensor (CIS) Industry and Market, with 7 vendors involved.2. Analysis of CMOS Camera Lens ...
Global and China Multi-layer Ceramic Capacitor (MLCC) Industry Report, 2017-2020
The rapid development of consumer electronics and industrial intelligentization has greatly promoted the booming of passive components including multi-layer ceramic capacitor (MLCC). In 2015, China’s ...
Global PCB Industry Report, 2015-2020
Global PCB Industry Report, 2015-2020 highlights the followings:1. Global PCB Market and Status Quo of the Industry2. Global Downstream Markets of PCB3. Mobile Phone PCB Trends4. Tablet PC/Laptop Comp...