Global and China 1,4-butanediol (BDO) Industry Report, 2017-2021
-
Aug.2017
- Hard Copy
- USD
$3,000
-
- Pages:100
- Single User License
(PDF Unprintable)
- USD
$2,800
-
- Code:
ZHP062
- Enterprise-wide License
(PDF Printable & Editable)
- USD
$4,400
-
- Hard Copy + Single User License
- USD
$3,200
-
1,4-butanediol (BDO) is a key raw material for organic and fine chemicals, capable of generating various derivatives like THF, PTMEG and GBL. BDO and its derivatives find wide application in PBT plastics, spandex, polyurethane, pharmaceuticals and cosmetics.
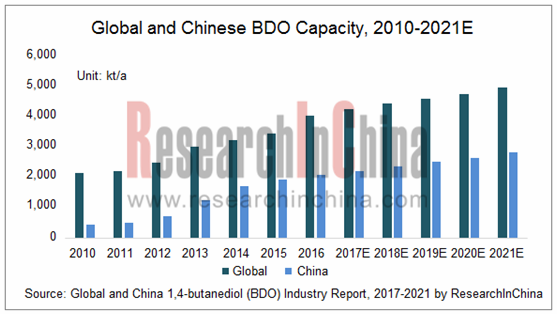
Spurred by downstream demand, global BDO capacity enlarged steadily in recent years and reached 3,990kt/a in 2016, with a CAGR of 13.5% during 2010-2016. However, saturating of BDO demand in American and European markets will retard expansion of BDO capacity worldwide. It is predicted that global BDO capacity will grow at a pace of 3%-6% during 2017-2021.
Global BDO capacity largely lies in Asia, especially in China which seized 2,079kt/a BDO capacity (a 52.1% share of global total) in 2016, with a CAGR of 35.3% during 2010-2016, being the key contributor to global BDO capacity growth. Nevertheless, most Chinese players have been in the red for a long time for excessive expansion of BDO capacity in China further intensified oversupply in the market and slowdown of downstream demand growth led to operating rate below 50%. As a result, China’s BDO capacity expansion will gear down with a growth rate of 5%-8% during 2017-2021.
Global BDO market has a relatively stable competitive pattern and a high concentration due to high technical barriers and limited sources of raw materials. Main producers include: foreign companies such as BASF, LyondellBasell and ISP; Taiwan-based Dairen Chemical and Nan Ya Plastics; Markor Chem, Xinjiang Tianye, Shanxi Sanwei, etc. in Mainland China. As of June 2017, the world’s top3 players by capacity were BASF, Dairen Chemical and Markor Chem, together sharing 39.0% of global total capacity.
China’s BDO price presented a fluctuating downtrend due to overcapacity in recent years. The price did not pick up until the end of 2016, and returned to the level of 2014 (around RMB12,200/ton) in June 2017. Tight supply constituted the main reason for recovery in price: explosion of an abandoned catalytic storage tank of SINOPEC Great Wall Energy and Chemical, halted production of the company’s BDO plants for almost three months in the second half of 2016; Markor Chem and Xinjiang Tianye then stopped production and overhauled their BDO plants in succession.
By downstream application, PTMEG, PBT and GBL took up 92% of total BDO demand in China in 2016, of which PTMEG had the biggest demand, a 43% share of the total. Pulled by capacity expansion, PTMEG’s demand for BDO will grow at a rate of about 10% during 2017-2021.
Global and China 1,4-butanediol (BDO) Industry Report, 2017-2021 highlights the following:
 BDO industry (definition, production technology, industry chain, etc.);
Global BDO market (overview, market size, market structure, competitive pattern, price trend, etc.);
China’s BDO industry (policy, market size, import and export, competitive pattern, price trend, development trend, etc.);
BDO upstream sectors including coal, methanol and calcium carbide (market size, import and export, competitive pattern, price, etc.);
BDO downstream sectors including PTMEG, PBT, GBL, etc. (market size, market structure, import and export, price, competitive pattern, etc.);
5 foreign and 23 Chinese BDO producers (operation, BDO business, etc.).
1 Profile of BDO
1.1 Properties and Purposes
1.2 Process
2 Overview of Global BDO Industry
2.1 Status Quo
2.2 Market Size
2.2.1 Supply
2.2.2 Demand
2.3 Competitive Landscape
2.4 Price
3 Overview of China BDO Industry
3.1 Policy
3.2 Market Size
3.2.1 Supply
3.2.2 Demand
3.3 Competitive Landscape
3.4 Import & Export
3.5 Price
3.6 Development Trend
4 Status Quo of Upstream Sectors
4.1 Coal
4.1.1 Market Size
4.1.2 Structure
4.1.3 Price
4.1.4 Import & Export
4.2 Methanol
4.2.1 Industry Status
4.2.2 Competitive Pattern
4.2.3 Price
4.3 Calcium Carbide
5 Development of BDO Downstream Sectors
5.1 THF/PTMEG
5.1.1 Market Size
5.1.2 Market Structure
5.1.3 Import & Export
5.1.4 Price
5.1.5 Competitive Pattern
5.2 PBT
5.2.1 Market Size
5.2.2 Market Structure
5.2.3 Import & Export
5.2.4 Price
5.2.5 Competitive Pattern
5.3 GBL
5.4 Others
6 Major Overseas BDO Manufacturers
6.1 BASF
6.1.1 Profile
6.1.2 Operation
6.1.3 BDO Business
6.1.4 Business in China
6.2 Dairen Chemical
6.2.1 Profile
6.2.2 BDO Business
6.2.3 Advantages and Outlook
6.3 LyondellBasell
6.3.1 Profile
6.3.2 Operation
6.3.3 BDO Business
6.3.4 Business in China
6.4 Ashland
6.4.1 Profile
6.4.2 Operation
6.4.3 BDO Business
6.4.4 Business in China
6.5 Nan Ya Plastics
6.5.1 Profile
6.5.2 Operation
6.5.3 BDO Business
6.5.4 Outlook
7 Major BDO Manufacturers in Mainland China
7.1 Markor Chem
7.1.1 Profile
7.1.2 Operation
7.1.3 BDO Business
7.2 Shanxi Sanwei
7.2.1 Profile
7.2.2 Operation
7.2.3 Clients and Suppliers
7.2.4 BDO Business
7.2.5 Development Strategy
7.3 Sinopec Yizheng Chemical Fibre
7.3.1 Profile
7.3.2 BDO Business
7.4 Fujian Meizhouwan
7.4.1 Profile
7.4.2 BDO Business
7.5 Nanjing Bluestar
7.5.1 Profile
7.5.2 BDO Business
7.6 HNCC
7.6.1 Profile
7.6.2 BDO Business
7.7 Other Companies
7.7.1 Yunnan Yunwei
7.7.2 Shaanxi BDO
7.7.3 Sichuan Tianhua
7.7.4 Jianfeng Chemical
7.7.5 Guodian Younglight
7.7.6 Henan Kaixiang
7.7.7 Inner Mongolia Zhongyuan
7.7.8 Sinopec Sichuan Vinylon Works
7.7.9 Zhongjia Huachen Energy
7.7.10 Jiangshan Chemical
7.7.11 Xinjiang Tianye
7.7.12 Yanchang Petroleum
7.7.13 Hengyuan Coal Industry and Electricity Power
7.7.14 Shandong Weijiao
7.7.15 Shaanxi Ronghe Chemical
7.7.16 Xinjiang Blue Ridge Tunhe Chemical Industry Joint Stock
7.7.17 Xinjiang Guotai Xinhua Mining
1,4-butanediol (BDO) Industry Chain
Advantages and Disadvantages of BDO Production Process
Application of Global BDO Production Technology
Global BDO Capacity and Growth Rate, 2010-2021
Major BDO Manufacturers Worldwide and Their Capacity, 2017
Global BDO Demand and Growth Rate, 2010-2021
Capacity Share of Major BDO Manufacturers in the World, 2017
BDO Anti-dumping Cases in China
BDO Capacity and Growth Rate in China, 2010-2021
BDO Output and Operating Rate in China, 2010-2021
BDO Manufacturers and Their Capacity in China, 2017
BDO Capacity Structure (by Production Process) in China, 2017
BDO Demand and Growth Rate in China, 2010-2021
BDO Downstream Consumption Structure in China, 2016/2021E
Major BDO Downstream Users, 2016
Competitive Pattern of China BDO Market, 2017
Import/Export Volume of Other Diols in China, 2009-2017
Average Import/Export Price of Other Diols in China, 2009-2017
Import Sources of Other Diols (by Import Volume) in China, 2016
Export Destinations of Others Diols (by Export Volume) in China, 2016
Main Other Diols Importing Regions and Import Structure in China, 2016
Main Other Diols Exporting Regions and Export Structure in China, 2016
Price Trend of BDO in China, 2014-2017
Ex-factory Prices of Major BDO Producers on July 21, 2017
Distribution of Anthracite Reserves in China
Anthracite Output and YoY Growth in China, 2009-2017
Apparent Consumption of Anthracite in China, 2009-2017
Anthracite Output Structure in China by Region, 2015
Price Trend of Thermal Coal in China, 2010-2016
Price Trend of Anthracite in China, 2010-2016
Growth in Average Price of Anthracite in China, 2016-2017
Import Volume of Anthracite in China, 2009-2016
Export Volume of Anthracite in China, 2009-2016
Global Methanol Capacity Structure by Region, 2016
Methanol Capacity and Output in China, 2010-2017
New/Expanded Capacity of Chinese Methanol Companies, 2017
Operating Rate of Methanol Industry in China, 2015-2016
Capacity and Capacity Structure of Global Major Methanol Companies, 2016
Price Trend of Methanol in China, 2016
Price Trend of Methanol in China, 2017
Calcium Carbide Capacity in China, 2005-2017
Calcium Carbide Output in China, 2011-2017
Apparent Consumption of Calcium Carbide in China, 2011-2017
Price Trend of Calcium Carbide in China, 2016-2017
Applications of BDO
Status Quo of Main BDO Downstream Industries in June 2017
Demand for PTMEG Used BDO in China, 2016-2021E
Global PTMEG Capacity, 2010-2021
Geographical Distribution of Global PTMEG Capacity, 2016
PTMEG Capacity in China, 2010-2021
PTMEG Output and Operating Rate in China, 2010-2021E
PTMEG Apparent Consumption and Self-sufficiency Rate in China, 2010-2021E
PTMEG Consumption Structure in China, 2016
PTMEG Import/Export Volume in China, 2008-2016
Average PTMEG Import/Export Price in China, 2008-2016
Distribution of PTMEG Import Sources (by Import Volume) in China, 2016
Distribution of PTMEG Export Destinations (by Export Volume) in China, 2016
Price Trend of PTMEG in China, 2010-2017
Capacity Share of Major PTMEG Manufacturers in the World, 2016
Technical Indicators of PBT Products
Demand for PBT Used OBD, 2010-2021E
Global PBT Capacity Structure by Region, 2016
Capacity of Major PBT Producers in China, 2016
PBT Output in China, 2010-2021E
PBT Demand in China, 2010-2021E
Global PBT Consumption Structure, 2016
PBT Demand Structure in China, 2016
PBT Import/Export Volume in China, 2008-2016
Average PBT Import/Export Price in China, 2008-2016
Distribution of PBT Import Sources (by Import Volume) in China, 2016
Distribution of PBT Export Destinations (by Export Volume) in China, 2016
Price Trend of PBT in China, 2016-2017
Competitive Pattern of Global PBT Market, 2016
Major GBL Manufacturers and Their Capacity in China, 2016
Global Presence of BASF
Revenue and Net Income of BASF, 2009-2017
Revenue Structure of BASF (by Division), 2016
Capacity of Main Products of BASF’s Chemical Division, 2016
Revenue and EBITDA of BASF’s Chemical Division, 2015-2016
Revenue Breakdown of BASF’s Chemical Division (by Product), 2015-2016
Intermediates Sales Structure of BASF (by Region), 2016
Address, Capacity and Process of BDO Facilities of BASF, 2013
BASF’s Layout in China
Main Products and Capacity of Dairen Chemical, 2016
Address and Capacity of BDO Plants of Dairen Chemical, 2016
BDO Industry Chain of Dairen Chemical
Revenue and Net Income of LyondellBasell, 2011-2016
Revenue Structure of LyondellBasell (by Division), 2014-2016
Revenue and Operating Income of Intermediate and Derivative Division of LyondellBasell, 2011-2016
Main Products and Capacity of Intermediate and Derivative Division of LyondellBasell, 2016
Revenue and Net Income of Ashland, FY2010-FY2016
Revenue Structure of Ashland (by Division), FY2011-FY2016
Revenue Structure of Ashland’s Functional Material Division (by Market), 2016
Revenue Structure of Ashland’s Functional Material Division (by Product), 2016
Revenue Structure of Ashland’s Functional Material Division (by Region), 2016
Address, Capacity and Process of BDO Facilities of ISP, 2016
Main Products of Nan Ya Plastics
Revenue and Net Income of Nan Ya Plastics, 2009-2016
Nan Ya Plastics’ Revenue from Main Products and % of Total Revenue, 2016
Nan Ya Plastics’ Revenue from BDO and % of Total Revenue, 2009-2016
BDO Capacity and Output of Nan Ya Plastics, 2008-2016
BDO Sales Volume and Sales/Output Ratio of Nan Ya Plastics, 2009-2016
Proportion of BDO Self-used Volume and External Sales Volume in Total Sales Volume of Nan Ya Plastics, 2011-2016
Revenue of Markor Chem, 2012-2017
BDP Process of Markor Chem
BDO Capacity, Output, Sales Volume and Sales Price of Markor Chem, 2010-2016
Revenue and Net Income of Shanxi Sanwei, 2009-2017
Revenue Structure of Shanxi Sanwei (by Product), 20124-2016
Revenue Structure of Shanxi Sanwei (by Region), 2012-2016
Gross Margin of Main Products of Shanxi Sanwei, 2010-2016
Shanxi Sanwei’s Revenue from Top 5 Clients and % of Total Revenue, 2011-2016
Name List and Revenue Contribution of Shanxi Sanwei’s Top 5 Clients, 2016
Shanxi Sanwei’s Procurement from Top 5 Suppliers and % of Total Procurement, 2011-2016
Name List and Procurement Contribution of Shanxi Sanwei’s Top 5 Suppliers, 2016
Development Course of BDO Business of Shanxi Sanwei
Capacity of BDO and Downstream Products of Shanxi Sanwei, 2016
Capacity of Main Products of Fujian Meizhouwan, 2016
Capacity of Main Products of Yunnan Yunwei, 2016
Revenue and Net Income of Yunnan Yunwei, 2009-2016
Global and China Synthetic Rubber Industry Report, 2021-2027
Synthetic rubber is a polymer product made of coal, petroleum and natural gas as main raw materials and polymerized with dienes and olefins as monomers, which is typically divided into general synthet...
Global and China Carbon Fiber Industry Report, 2021-2026
Carbon fiber is a kind of inorganic high performance fiber (with carbon content higher than 90%) converted from organic fiber through heat treatment. As a new material with good mechanical properties,...
China Coal Tar Industry Report, 2020-2025
Coal tar is a thick dark liquid which is a by-product of the production of coke and coal gas from coal. It can be classified by the dry distillation temperature into low-temperature coal tar, medium-t...
Global and China Dissolving Pulp Industry Report, 2019-2025
In 2018, global dissolving pulp capacity outstripped 10 million tons and its output surged by 14.0% from a year ago to 7.07 million tons, roughly 70% of the capacity. China, as a key supplier of disso...
Global and China 1, 4-butanediol (BDO) Industry Report, 2019-2025
1,4-butanediol (BDO), an essential organic and fine chemical material, finds wide application in pharmaceuticals, chemicals, textile and household chemicals.
As of the end of 2018, the global BDO cap...
Global and China Carbon Fiber and CFRP Industry Report, 2019-2025
Among the world’s three major high performance fibers, carbon fiber features the highest strength and the highest specific modulus. It is widely used in such fields as aerospace, sports and leisure.
...
Global and China Natural Rubber Industry Report, 2019-2025
In 2018, global natural rubber industry continued remained at low ebb, as a result of economic fundamentals. Global natural rubber price presented a choppy downtrend and repeatedly hit a record low in...
Global and China Ultra High Molecular Weight Polyethylene (UHMWPE) Industry Report, 2019-2025
Ultra high molecular weight polyethylene (UHMWPE), a kind of linear polyethylene with relative molecular weight of above 1.5 million used as an engineering thermoplastic with excellent comprehensive p...
China Polyether Monomer Industry Report, 2019-2025
China has seen real estate boom and issued a raft of policies for continuous efforts in improving weak links in infrastructure sector over the years. Financial funds of RMB1,663.2 billion should be al...
Global and China Needle Coke Industry Report, 2019-2025
Needle coke with merits of good orientation and excellent conductivity and thermal conductivity, is mainly used in graphite electrodes for electric steelmaking and lithium battery anode materials.
A...
Global and China Viscose Fiber Industry Report, 2019-2025
Over the recent years, the developed countries like the United States, Japan and EU members have withdrawn from the viscose fiber industry due to environmental factor and so forth, while the viscose f...
China Coal Tar Industry Report: Upstream (Coal, coke), Downstream (Phenol Oil, Industrial Naphthalene, Coal Tar Pitch), 2019-2025
Coal tar is a key product in coking sector. In 2018, China produced around 20 million tons of coal tar, a YoY drop of 2.4% largely due to a lower operating rate of coal tar producers that had to be su...
Global and China Synthetic Rubber (BR, SBR, EPR, IIR, NBR, Butadiene, Styrene, Rubber Additive) Industry Report, 2018-2023
In 2018, China boasted a total synthetic rubber capacity of roughly 6,667kt/a, including 130kt/a new effective capacity. Considering capacity adjustment, China’s capacity of seven synthetic rubbers (B...
Global and China Dissolving Pulp Industry Report, 2018-2022
With the commissioning of new dissolving pulp projects, the global dissolving pulp capacity had been up to about 8,000 kt by the end of 2017. It is worth noticing that the top six producers including ...
Global and China Carbon Fiber and CFRP Industry Report, 2018-2022
As a new generation of reinforced fiber boasting intrinsic properties of carbon material and excellent processability of textile fiber, carbon fiber is the one with the highest specific strength and s...
Global and China Ultra High Molecular Weight Polyethylene (UHMWPE) Industry Report, 2017-2021
Ultra High Molecular Weight Polyethylene (UHMWPE), a kind of linear polyethylene with relative molecular weight of above 1.5 million and an engineering thermoplastic with excellent comprehensive prope...
China Coal Tar Industry Report, 2017-2021
Coal tar, one of by-products in raw coal gas generated from coal pyrolysis in coking industry, accounts for 3%-4% of the output of coal as fired and is a main raw material in coal chemical industry.
...
Global and China Aramid Fiber Industry Report, 2017-2021
Global aramid fiber output totaled 115kt with capacity utilization of 76.0% in 2016. As industries like environmental protection and military develop, the output is expected to rise to 138kt and capac...