Global and China Animation Industry Report, 2019-2025
-
Jun.2019
- Hard Copy
- USD
$3,000
-
- Pages:121
- Single User License
(PDF Unprintable)
- USD
$2,800
-
- Code:
JAF017
- Enterprise-wide License
(PDF Printable & Editable)
- USD
$4,200
-
- Hard Copy + Single User License
- USD
$3,200
-
Up to date, the global animation market is still firmly dominated by the United States and Japan, followed by South Korea that springs up. The global animation output value approximates USD250 billion, and records as much as USD500 billion or so if peripheral products are taken into account. The Japanese animation market was worth over JPY2 trillion for the first time in 2017, thanks to the foreign animation boom and business diversification. South Korea's animation sales in 2017 was estimated to be KRW1 trillion (about RMB6 billion), of which KRW724 billion (about RMB4.3 billion) might come from online animation whose market size is expected to report KRW1 trillion by 2020.
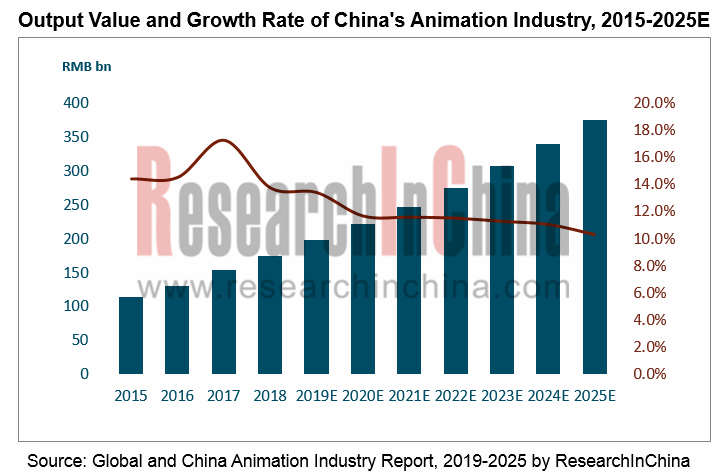
China's animation industry has been progressing apace over the recent years, with its output value surging from RMB88.2 billion in 2013 to RMB174.7 billion in 2018 and expectedly outnumbering RMB200 billion in 2019 and standing at RMB375 billion by 2025.
The output value of animation is largely contributed by the upstream content market and the downstream derivative market, of which the market of derivatives hit about RMB76.4 billion in 2017, doubling that of the former. In Japan, the market size of derivatives is generally 8-10 times that of the broadcast market, indicating great growth potentiality of Chinese animation derivative market.
Users’ habit of paying for animation content is still being cultivated. In 2018, paid works accounted for 22% of the top 50 animation works on air by view. Joint broadcast and exclusive broadcast of premium content shared the paid head content, 71% of which was covered by iQIYI that performed well in the animation payment field. In the future, animation will be integrated into the paid content along with dramas and movies.
With the better living standards of adolescents and the widespread ACG (anime, comics and games) culture in China, there is an enormous number of pan-ACG users in China, hitting nearly 350 million in 2018 (including more than 200 million online animation users). The huge user base triggers huge demand for animations.
The animation industry has always been a hot spot for investment, but it is primarily dominated by strategic investors including platform giants (such as Tencent, iQiyi, NetEase and Bilibili) as well as film and television companies (mainly Enlight Media and Wanda Media). Among them, Bilibili and Tencent have become important players in the animation investment, and they have invested in a number of companies with IP capacity or animation production capabilities.
The report highlights the following:
 Definition, industry chain, business model, development characteristics, etc. of animation industry;
Animation industry policy, industry status, scale, etc. of global and segmented markets (USA, Japan, South Korea);
Development environment, market size, competition pattern, industrial base, etc. of China’s animation industry;
China's animation industry chain, upstream, midstream and downstream enterprises, and user preference survey data;
Scale, structure, trends, etc. of China’s animation production and distribution markets (TV animation, animated film, anime games, new media animation);
Scale, pattern, etc. of China’s derivatives market (animation toys, animation clothing, theme park, brand licensing);
Operation, development strategy, etc. of 8 foreign and 10 Chinese animation related enterprises.
1. Overview of Animation Industry
1.1 Definition
1.2 Industrial Chain
1.3 Business Model
1.4 Economic Characteristics
1.5 Development Features
2. Global Animation Industry Development
2.1 Overview
2.1.1 Support Policy
2.1.2 Market Pattern
2.2 United States
2.2.1 Overview
2.2.2 Development History
2.2.3 Industrial Chain Analysis
2.3 Japan
2.3.1 Overview
2.3.2 Development History
2.3.3 Industrial Chain Analysis
2.3.4 Production Costs
2.4 South Korea
3. China Animation Industry Development
3.1 Development Environment
3.1.1 Policy Environment
3.1.2 Industry Environment
3.2 Market Size
3.2.1 Output Value
3.2.2 User Scale
3.3 Enterprises Analysis
3.3.1 Major Participants
3.3.2 Production Type
3.3.3 Media Type
3.3.4 Integrated Type
3.4 Competition Pattern
3.4.1 Foreign Enterprises’ Layout in China
3.4.2 Capital Interest
3.5 Animation Industry Base
4. Structure of and Analysis on China's Animation Industry Chain
4.1 Industry Chain: Upstream, Midstream, Downstream
4.2 Upstream Producers
4.2.1 Content Production
4.2.2 Animation Production
4.3 Midstream Service Providers
4.3.1 Anime Release and Broadcast
4.3.2 Animation Derivative Industry
4.4 Downstream Users
5. Animation Production and Distribution Markets in China
5.1 TV Animation
5.1.1 Scale
5.1.2 Structure
5.2 Animated Film
5.2.1 Scale
5.2.2 Pattern
5.3 Cartoon Game
5.4 Comic
5.5 New Media Market
5.5.1 Overview
5.5.2 Characteristics
5.5.3 Profit Model
5.5.4 Industrial Subject
5.5.5 Market Demand
5.5.6 Market Size
5.5.7 Trends
6. China Animation Derivative Industry
6.1 Overview
6.2 Animation Toy
6.2.1 Scale
6.2.2 Pattern
6.3 Animation Apparel
6.3.1 Scale
6.3.2 Pattern
5.3.3 Enterprise
6.4 Theme Park
6.4.1 Overview
6.4.2 Major Enterprises
6.5 Brand Authorizing
6.5.1 Market Scale
6.5.2 Characteristics and Existing Problems
6.5.3 Trends
7. Typical Enterprises in Global Animation Industry
7.1 Disney
7.1.1 Profile
7.1.2 Main Business
7.1.3 Development Course
7.1.4 Operation
7.1.5 Business Model
7.1.6 Competitive Advantages
7.2 Bandai Namco Group
7.2.1 Profile
7.2.2 Development Course
7.2.3 Operation
7.2.4 Development Strategy
7.3 Hasbro
7.3.1 Profile
7.3.2 Development Course
7.3.3 Brand Introduction
7.3.4 Operation
7.3.5 Development Plan
7.4 Toei Animation
7.4.1 Profile
7.4.2 Development Course
7.4.3 Operation
7.5 Others
7.5.1 DreamWorks
7.5.2 Pixar Animation
7.5.3 Sotsu
7.5.4 Studio Ghibli
8. Typical Enterprises in China's Animation Industry
8.1 Guangdong Alpha Animation And Culture Co., Ltd.
8.1.1 Profile
8.1.2 Development Course
8.1.3 Operation
8.1.4 R & D Expense
8.1.5 Competitive Advantages
8.1.6 Strategic Layout
8.1.7 Performance Forecast
8.2 Meisheng Cultural & Creative Corp., Ltd.
8.2.1 Profile
8.2.2 Development Course
8.2.3 Products
8.2.4 Operation
8.2.5 Development Strategy
8.2.6 Performance Forecast
8.3 Huawei Technology Co., Ltd.
8.3.1 Profile
8.3.2 Development History
8.3.3 Operation
8.3.4 R & D Expense
8.3.5 Development Strategy
8.3.6 Performance Forecast
8.4 Fantawild Holdings Inc.
8.4.1 Profile
8.4.2 Operation
8.4.3 Business
8.4.4 Strategy
8.5 Taomee Holdings Limited
8.5.1 Profile
8.5.2 Development Course
8.5.3 Business
8.6 Zhejiang Zhongnan Animation Co. Ltd
8.6.1 Profile
8.6.2 Operation
8.6.3 Major Customers & Suppliers
8.6.4 R & D Investment
8.6.5 Development Strategy
8.7 JY Animation
8.7.1 Profile
8.7.2 Operation
8.7.3 Major Customers & Suppliers
8.7.4 R & D Investment
8.7.5 Development Strategy
8.8 Others
8.8.1 Toonmax Media Co., Ltd.
8.8.2 Tencent Animation
8.8.3 CCTV Animation.Com
8.8.4 Uyoung Media
Industrial Chain of Animation Industry
Business Model of Animation Industry
Characteristics of "Industrial Culturalization" and " Cultural Industrialization"
Themes included in Classic Cartoon Images in America and Japan
Broadcast of Classic Cartoon Images
Correlation Effects of Animation Industry
Support Policy and Influence of Animation Industry in Developed Nations
Support Measures of Overseas Animation Industry
Three Tiers of Global Animation Industry
Major Countries’ Animation Development
Development History of American Animation Industry
Number of Animated Films Released in the United States, 2000-2018
Animation Industrial Chain in United States
Production Costs of Major U.S. Animation Studios
Authorization Scale of Major Global Animation Companies, 2018
Japan’s Animation Market Size, 2010-2018
Overseas Revenue of Japan’s Animation Industry and Proportion, 2010-2018
Japan’s Animation Market Structure in A Broad Sense, 2010-2018
Japan’s Animation Market Structure in A Narrow Sense, 2010-2018
Production Duration of Kid/Family Animation and Late-night TV Animation in Japan, 2010-2017
Box Office Earnings of Theatrical Animation in Japan, 2010-2017
Number of Theatrical Animation Works and Their Production Minutes in Japan, 2010-2017
Japan’s Revenue from Animation Videogram, 2010-2017
Japan’s Revenue from Animation Distribution via the Internet, 2010-2017
Distribution of Japanese Animation Studios
Development History of Japanese Animation Industry
Japanese Animation Industry Chain
Investment Chain of Animation Industry in Japan
Mid-term Production Price of Japanese Animation Companies (by Process), 2018
Scale of South Korea’s Main Animation and Derivatives Exports, 2013-2018
Policies on China Animation Industry
Structure of Chinese Residents’ Consumption Expenditure in China, 2018
Investments in China’s Culture and Entertainment Industry, 2013-2018
Total Value of Animation Industry and Growth Rate in China, 2015-2025E
ACG User Scale in China, 2013-2018
Distribution of Chinese Animation Enterprises, 2018
Major Participants in Animation Industry
Representative Companies in China Animation Industrial Chain
Major Animation Images and Producers in China, 2013-2018
Government Subsidies in China Animation Industry
China’s Animation Production Costs, 2015-2018
Six Animation Satellite TV Channels in China
Major Listed Companies in Animation Derivative Industry
Revenue and Net Income of Major Chinese Animation Derivatives Enterprises, 2014-2018
Growth in Revenue and Net Income of Major Chinese Animation Derivatives Enterprises, 2014-2018
Structure of Animation Content Consumer Market in China, 2018
Number of Chinese Animation Companies Securing Financing, 2010-2018
Financing of China Animation Industry, 2016-2018
Types of Animation Industry Bases in China
Animation Industrial Base List in China
Operation Mode of China Animation Industry Base
China’s Animation Industry Chain
Chinese Original Animation Companies and Their Representative Works
Chinese Original Animation Production Companies and Their Contract Products
Distribution Channels of Chinese Animation Products
Main Business Models of Chinese Original Animation Companies
Scale of Users Interested in Weibo Animation, 2016-2018
Gender Ratio of Weibo Animation Users, 2017-2018
Educational Background of Weibo Animation Users
Age of Weibo Animation Users, 2017-2018
Geographical Distribution of Weibo Animation Users
Primary Interest Distribution of Weibo Animation Users
Secondary Interest Distribution of Weibo Animation Users
Women's Favorite Top 10 Weibo Animation Genres
Men's Favorite Top 10 Weibo Animation Genres
Monthly Average Consumption of Weibo Animation Users
Years That Weibo Animation Users Spent on Animation
Weekly Average Time That Weibo Animation Users Spent on Animation
Monthly Average Consumption of Weibo Animation Users
City Distribution of Male Animation Users Born after 1995
Number of China-made Cartoons, 2013-2018
Duration of China-made Cartoons, 2015-2025E
Quantity Structure of Chinese TV Animation (by Theme), 2018
Duration Structure of Chinese TV Animation (by Theme), 2018
Broadcast Time of TV Animation in China, 2011-2018
China’s TV Animation Imports and Exports, 2017
Animated Film Production in China, 2015-2025E
Animated Film Screenings in China, 2012-2019
Animated Film Viewers in China, 2012-2019
Animated Film Releases in China, 2010-2019
Box Office Earnings of China Animated Film Market, 2010-2019
Box Office Earnings from China-made Animated Films as a Percentage of Total from Animated Films, 2010-2025E
Number of China-made Animated Films with the Box Office of over RMB50 million, 2010-2018
Regional Structure of Animated Films in China, 2018
Online Games Market Size in China, 2011-2025E
Structure of Online Games Market Size in China, 2013-2019
Number of Comic Readers in China, 2015-2025E
Top 10 Chinese Comic Works on ac.qq.com
New Media Distribution Channel of Animation
Payment Models of Comic Content in China
Introduction of Mainstream Independent Animation Websites in China
China’s Smartphone Ownership by Age
Network Animation Coverage (by Age), 2018
China’s Internet Comics User Scale, 2015-2025E
China’s Animation Derivatives Market Size, 2015-2025E
China’s Animation Derivatives Market Share by Segment, 2016/2018
China’s Animation Toy Market Size and YoY, 2015-2025E
Competition Pattern of China’s Animation Toy Market, 2018
China’s Animation Apparel Market Size, 2015-2025E
Supply Structure of Animation Apparel in China, 2018
China’s Exported Animation Apparel as a Percentage of Export Destination Consumption Amount, 2018
Domestic Animation Apparel Enterprises in China
Distribution of Disneyland Parks in the World
Passenger Flow of Shanghai Disney Resort
Shenzhen Huaqiang’s Theme Parks
China’s Animation Brand Licensing Market Size, 2015-2025E
China’s Brand Licensing Market Structure, 2018
Profile of Disney
Main Business Units of Disney
Global Business Distribution of Disney
Development History of Disney
Selected Financials of Disney, FY2012-FY2018
Revenue and Operating Income of Disney by Business, FY2014-2018
Revenue Structure of Disney by Region, FY2014-2018
Animation Business Architecture of Disney
Value Chain of Disney Brand
Industry Structure of Disney Brand
Business Model of Disney
Business Units of Bandai Namco Group
Business Model of Bandai Namco Group
Development History of Bandai Namco Group
Milestones of Bandai Namco Group
Selected Financials of Bandai Namco Group, FY2011-FY2018
Revenue and Operating Income of Bandai Namco Group (by Business), FY2015-FY2018
Development Plan of Bandai Namco Group, FY2019
Revenue Structure of Bandai Namco Group by Region, FY2019
Medium Term Development Planning of Bandai Namco Group
Development Goals of Bandai Namco Group
Introduction of Hasbro
Business Industrial Chain of Hasbro
Development History of Bandai Namco Group
Development Phases of Hasbro Brands
Brands of Hasbro
Selected Financials of Hasbro, 2013-2018
Revenue Breakdown of Hasbro by Product, 2014-2018
Revenue Breakdown of Hasbro by Business, 2014-2018
Branding Plan of Hasbro
Key Promotion Brands of Hasbro, 2015
Operations of Toei Animation
Global Presence of Toei Animation
Development History of Toei Animation
Production Process of Cartoon Images of Toei Animation
Revenue of Toei Animation by Business, FY2011-FY2018
Revenue of Toei Animation by Market Segment, FY2011-FY2018
Revenue of Toei Animation (by Region), FY2011-FY2018
Box Office Results of Dreamworks Movies, 1998-2018
Development History of Pixar Animation Studios
Box Office of Animated Films of Pixar Animation
Pixar Movies to Be Released, 2017-2025E
Basic Information of Sotsu
Business Introduction of Sotsu
Development History of Sotsu
Revenue and Net Income of Sotsu, FY2012-FY2018
Box Office of Animated Films of Studio Ghibli
Development History of Guangdong Alpha Animation and Culture, 2011-2019
Revenue and Net Income of Guangdong Alpha Animation and Culture, 2009-2018
Revenue Structure of Guangdong Alpha Animation and Culture (by Business), 2010-2018
Animation Toy Output and Sales Volume of Guangdong Alpha Animation and Culture, 2014-2018
Revenue Structure of Guangdong Alpha Animation and Culture (by Region), 2006-2018
Gross Margin of Guangdong Alpha Animation and Culture (by Business), 2010-2018
R&D Costs and % of Total Revenue of Guangdong Alpha Animation and Culture, 2011-2018
Development History of Business Industrial Chain of Guangdong Alpha Animation and Culture
Capital Distribution of Guangdong Alpha Animation and Culture, 2010-2019
Revenue and Net Income of Guangdong Alpha Animation and Culture, 2016-2020E
Development History of Meisheng Cultural & Creative
Meisheng Cultural & Creative’s Apparel Products
Revenue and Net Income of Meisheng Cultural & Creative, 2013-2018
Revenue Structure of Meisheng Cultural & Creative (by Business), 2017-2018
Revenue Structure of Meisheng Cultural & Creative (by Region), 2013-2018
Operational Data of Major Subsidiaries of Meisheng Cultural & Creative, 2018
Revenue and Net Income of Meisheng Cultural & Creative, 2016-2020E
Development History of Huawei Technology
Revenue and Net Income of Huawei Culture, 2013-2019
Revenue Structure of Huawei Culture (by Business), 2014-2018
Revenue Structure of Huawei Culture (by Region), 2013-2018
Operational Data of Major Subsidiaries of Huawei Culture, 2018H1
R&D Costs and % of Total Revenue of Huawei Culture, 2013-2019
Revenue and Net Income of Huawei Culture, 2016-2020E
Industrial Bases of Fantawild
Revenue and Net Income of Fantawild, 2014-2019
Revenue Structure of Fantawild (by Business), 2014-2019
Top 5 Clients of Fantawild, 2018
Top 5 Suppliers of Fantawild, 2018
Theme Park Distribution of Fantawild in China
Culture Content Products and Service of Fantawild
Development Plan of Fantawild
Development History of Taomee
Business Introduction of Taomee
Partners of Zoland Animation
Revenue and Net Income of Zhejiang Zoland Animation, 2013-2019
Revenue and Gross Margin of Zhejiang Zoland Animation (by Business), 2013-2019
Zhejiang Zoland Animation’s Revenue from Top 5 Customers and % of Total Revenue, 2018
Top 5 Suppliers of Zhejiang Zoland Animation, 2018
R&D Costs and % of Total Revenue of Zhejiang Zoland Animation, 2013-2019
Revenue and Net Income of JY Animation, 2013-2019
Revenue and Gross Margin of JY Animation (by Business), 2013-2019
JY Animation’s Revenue from Top 5 Customers and % of Total Revenue, 2018
Top 5 Suppliers of JY Animation, 2018
R&D Costs and % of Total Revenue of JY Animation, 2013-2019
Business Structure of Toonmax Media
Partners of Toonmax Media
Development Overview of CCTV Animation Co., Ltd
Development History of Uyoung Media
Main Businesses of Uyoung Media
Major IP Works of Uyoung Media
Global and China Animation Industry Report, 2019-2025
Up to date, the global animation market is still firmly dominated by the United States and Japan, followed by South Korea that springs up. The global animation output value approximates USD250 billion...
Global and China Animation Industry Report, 2017-2021
In 2016, the global animation industry recorded output value of approximately USD220 billion, of which, the United States made the greatest contribution and claimed about 38% market share, with animat...
Global and China Animation Industry Report, 2015
Chinese animation industry has maintained the momentum of robust growth from 2014 on, thanks to the government's supportive policies on animation industry and booming Internet-based new media distribu...
Global and China Animation Industry Report, 2014
China’s animation industry output value continued to grow and exceeded RMB90 billion in 2013, showing a year-on-year increase of around 21.0%. Despite the overall sustained growth, each link of the in...
China Digital Publishing Industry Report, 2013-2014
As an emerging publishing industry, digital publishing is characterized by digitization of content production, management process and product form as well as networked communication channels.With the ...
China TV Drama Industry Report,2013-2016
In recent years, a series of favorable policies issued by the Chinese government in finance, intellectual property protection and culture industries stimulate the rapid expansion of Chinese TV drama m...
China TV Shopping Industry Report, 2013
In 2009, the State Administration of Radio Film and Television (SARFT) released Opinions on TV Shopping Channel Construction and Management and Notice concerning Strengthening Management over TV Shopp...
Global and China Animation Industry Report, 2012-2015
So far, the output value of global animation industry has reached US$222.8 billion, and animation-related derivatives have exceeded US$500 billion. The animation industry has gradually become a pillar...
China Film Industry Report, 2012-2015
From January to October of 2012, China film industry gained the box office of RMB13.27 billion. Taking into account the contribution of the traditional Lunar New Year holiday, China’s film box office ...
China TV Drama Industry Report, 2011-2012
TV drama industry is a policy-sensitive sector in China. From 2006 to 2010, the value of Chinese drama transactions increased from RMB4.85 billion to RMB5.92 billion, with a CAGR of just 5.11%. As the...
China TV Shopping Industry Report, 2011
TV shopping entered China in the early 1990s, and ushered in its first golden era from 1996 to 2000, during which, there emerged more than 1,000 TV shopping companies, with industry revenue already ab...
Global and China Animation Industry Report, 2011
In 2010, the total output value of animation industry in China increased by 27.8% year-on-year to RMB47.084 billion. In 2015, the total output value is expected to reach RMB 120 billion, and the marke...
China Film Industry Report, 2011
In 2010, the consolidated revenue of China film industry approximated RMB16 billion, an increase of 48%. Currently, box office, which was about RMB 5.7 billion in H1 2011, is still the main revenue so...
China Advertising Industry Report, 2010-2011
The sustained economic growth ensures the healthy development of advertising industry in China. The advertising market size of China totaled RMB343.7 billion in 2010, up 22.5% from a year earlier. How...
China Film Industry Report, 2009-2010
Currently, China’s film industry is experiencing a golden period. No matter what film production, box office, financing and cinema construction witness the explosive growth. In 2009, Chinese mainland ...
China Advertising Industry Report, 2009-2010
Chinese traditional media witnessed steady progression in 2009, while online advertising outshined the others, characterizing high degree of brand penetration, high accuracy, huge target audience, etc...
China Listed Media Companies Report, 2008-2009
With the continuous development of economy and society, China has become the largest media consumer market in the world and China's media output has exceeded the media giant -- the United States. But,...
China Mobile Multimedia Broadcasting (CMMB) Industry Chain Report, 2008
CMMB industry chain involved the CMMB chip, CMMB operation, CMMB terminal, etc. By Jan 2009, the quantity of CMMB chip manufacturers in China has amounted to eight, including Innofidei, Telepath, Spre...