China Bus Industry Report, 2015-2018
-
Aug.2015
- Hard Copy
- USD
$2,400
-
- Pages:105
- Single User License
(PDF Unprintable)
- USD
$2,200
-
- Code:
YSJ089
- Enterprise-wide License
(PDF Printable & Editable)
- USD
$3,400
-
- Hard Copy + Single User License
- USD
$2,600
-
In 2014-2015, although macro-economy would have certain impact on bus market, city buses, new energy buses, and light-duty buses, which were driven by downstream market, presented a rise in demand, thus leading to growth of overall bus market in China. In 2014, the sales volume of buses (including bus chassis) in China came to 606,900 vehicles, up 8.37% from a year earlier.
In 2014, the new energy bus became a new sport light in bus market, with sales volume hitting 27,000 vehicles, up 160% from a year earlier. In terms of power type, the plug-in hybrid bus gained in popularity in the market with its lower prices and high cost performance. And therefore it accounted for the largest share in new energy bus market, at 47.5% in 2014. Spurred by technology maturity and polices, the battery electric bus developed rapidly, representing 47% in 2014, an increase of 31 percentage points from 2013. However, the ordinary hybrid bus, which was not brought into the national subsidy list, occupied an increasingly lower market share, to 5.5% in 2014. It is expected to gradually withdraw from the market in the future.
In 2014, school bus market failed to meet market expectations, with the sales volume dropping by 14.9% year on year. In 2014, there were a total of 38 school bus manufacturers in China, a decrease of 11 from the end of 2012. That was because there had been no encouraging policies and financial support, so that quite a few enterprises chose to retreat from the market. In October 2014, the Ministry of Education brought school bus safety under control as major educational emergencies, which can be viewed as a breakthrough in school bus policy, thus bolstering the market. In the first months of 2015, the sales volume of school buses increased by 22% year on year on year to 9,400 vehicles. The market is expected to grow rapidly if good policies are introduced in the future.
Competitive Landscape of Bus Market in China, Jan-May 2015
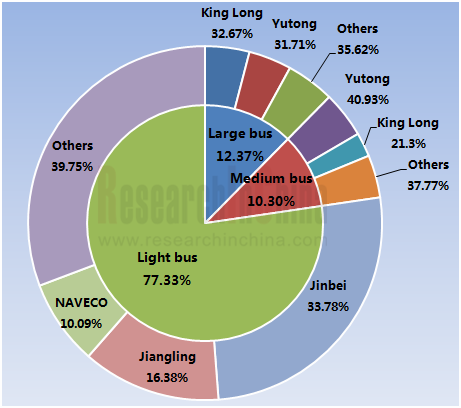
Source: China Bus Industry Report, 2015-2018E by ResearchInChina
As the largest large and medium-sized bus manufacturer in China, Yutong Bus sold 27,398 and 7,531 large-sized buses respectively in 2014 and Jan.-May 2015, which accounted for the market share of 33.65% and 31.71%, separately; the sales volume of medium-sized buses totaled 25,880 vehicles and 8,552 vehicles, respectively, with the market share of 41.28% and 40.93%. Yutong took the leading position in many bus market segments, For example, the company made up a market share of over 30% in school bus market and of over 25% in new energy bus market. In May 2015, Yutong Bus displayed its high-end medium-sized business bus—T7, which is positioned as high and mid-end business bus. In future, the product is expected to break the monopoly of Toyota Coaster in this market.
Shenyang Jinbei Automotive, the largest light-duty bus producer in China, saw the sales volume of 116,500 and 54,000 light-duty buses respectively in 2014 and Jan.-May 2015, which accounted for the market share of 30.24% and 33.78%. In the field of light-duty bus, the company’s leading products are HAISE and Grace. While consolidating the leading position in light-duty bus, Jinbei is extending its business to car market. At present, a complete product lineup centering on cars, light-duty buses and light-duty tracks is taking shape.
The report mainly deals with the following:
 Market size, market structure, competitive landscape, import and export, and trends of China’s overall bus market (including chassis);
Market size, market structure, and competitive landscape of large, medium, and light bus market in China;
Market size, market structure, competitive landscape, and prospects of school buses in China;
Market Size, competitive landscape, related policies, technology roadmap, and industrial investment of new energy buses in China;
China’s bus industry chain, including the supply relationship of main upstream spare parts (transmission, wheel hub, and new energy batteries) and downstream market demand;
Development of Chinese bus manufacturers, including their financial data, bus production and sales, new energy bus business, capacity, cost structure, latest developments, etc.
1 Industry Overview
1.1 Product Introduction
1.2 Product Classification
1.3 Policies
2 Overall Bus Market in China
2.1 Market Size
2.2 Market Structure
2.2.1 By Type
2.2.2 By Application
2.3 Competitive Landscape
2.3.1 Market Share
2.3.2 Performance Comparison
2.4 Imports & Exports
2.4.1 Overall Market
2.4.2 Market Segment
2.4.3 By Country
2.5 School Bus Market
2.5.1 Market Size
2.5.2 Market Structure
2.5.3 Main Applications
2.5.4 Regional Market
2.5.5 Competitive Landscape
2.5.6 Development Prospects
2.6 High-grade Bus
2.7 Trends
3 Bus Market Segments in China
3.1 Large Bus Market
3.1.1 Market Size
3.1.2 Competitive Landscape
3.1.3 Market Structure
3.2 Medium Bus Market
3.2.1 Market Size
3.2.2 Competitive Landscape
3.2.3 Market Structure
3.3 Light Bus Market
3.3.1 Market Size
3.3.2 Competitive Landscape
3.3.3 Market Structure
4 New Energy Bus Market
4.1 Market Size
4.2 Competitive Landscape
4.3 Policies
4.3.1 Policies for Reducing and Exempting Taxes
4.3.2 Policies on Fiscal Subsidies
4.3.3“Oil Reduction & Electricity Compensation” Policy
4.4 Technology Roadmap
4.5 Investment
5 Bus Industry Chain
5.1 Upstream Raw Material Market
5.2 Key Components
5.2.1 Transmission
5.2.2 Wheel Hub
5.2.3 New Energy Battery
5.3 Downstream Demand Market
5.3.1 Passenger Transport
5.3.2 Tourism
5.3.3 School Children
6 Major Enterprises
6.1 Zhengzhou Yutong Bus Co., Ltd.
6.1.1 Profile
6.1.2 Financial Survey
6.1.3 Operating Revenue Structure
6.1.4 Production and Sales
6.1.5 New Energy Bus
6.1.6 Production Capacity
6.1.7 R&D Costs
6.1.8 Cost Structure
6.1.9 Matching Accessories
6.1.10 Latest Development
6.1.11 Prospects
6.2 Xiamen King Long Motor Group Co., Ltd.
6.2.1 Profile
6.2.2 Financial Survey
6.2.3 Operating Revenue Structure
6.2.4 Operation of Major Subsidiaries
6.2.5 Production and Sales
6.2.6 New Energy Bus
6.2.7 Production Capacity
6.2.8 R&D Costs
6.2.9 Cost Structure
6.2.10 Latest Development
6.2.11 Prospects
6.3 Zhongtong Bus and Holding Co., Ltd.
6.3.1 Profile
6.3.2 Financial Survey
6.3.3 Operating Revenue Structure
6.3.4 Production and Sales
6.3.5 New Energy Bus
6.3.6 Production Capacity
6.3.7 R&D Costs
6.3.8 Cost Structure
6.3.9 Latest Development
6.3.10 Prospects
6.4 Beiqi Foton Motor Co., Ltd.
6.4.1 Profile
6.4.2 Financial Survey
6.4.3 Operating Revenue Structure
6.4.4 Production and Sales
6.4.5 New Energy Bus
6.4.6 Production Capacity
6.4.7 R&D Costs
6.4.8 Prospects
6.5 Anhui Ankai Automobile Co., Ltd.
6.5.1 Profile
6.5.2 Financial Survey
6.5.3 Operating Revenue Structure
6.5.4 Production and Sales
6.5.5 New Energy Bus
6.5.6 Production Capacity
6.5.7 R&D Costs
6.5.8 Cost Structure
6.6 Liaoning SG Automotive Group Co., Ltd.
6.6.1 Profile
6.6.2 Financial Survey
6.6.3 Operating Revenue Structure
6.6.4 Production and Sales
6.6.5 New Energy Business
6.6.6 Cost Structure
6.7 Yangzhou Asiastar Bus Co., Ltd.
6.7.1 Profile
6.7.2 Financial Survey
6.7.3 Operating Revenue Structure
6.7.4 Production and Sales
6.7.5 New Energy Bus
6.7.6 R&D Costs
6.7.7 Cost Structure
6.8 BYD Company Co., LTD
6.8.1 Profile
6.8.2 Financial Survey
6.8.3 Operating Revenue Structure
6.8.4 Production and Sales
6.8.5 New Energy Bus
6.8.6 Latest Development
6.8.7 Prospects
6.9 Anhui Jianghuai Automobile Co., Ltd.
6.9.1 Profile
6.9.2 Financial Survey
6.9.3 Operating Revenue Structure
6.9.4 Production and Sales
6.9.5 R&D Costs
6.9.6 Cost Structure
6.9.7 Prospects
6.10 Shenyang Jinbei Automotive Co., Ltd.
6.10.1 Profile
6.10.2 Financial Survey
6.10.3 Operating Revenue Structure
6.10.4 Production and Sales
6.10.5 R&D Costs
6.10.6 Cost Structure
6.10.7 Prospects
6.11 Jiangling Motors Co., Ltd.
6.11.1 Profile
6.11.2 Financial Survey
6.11.3 Operating Revenue Structure
6.11.4 Production and Sales
6.11.5 R&D Costs
6.11.6 Prospects
6.12 Dongfeng Automobile Co., Ltd.
6.12.1 Profile
6.12.2 Financial Survey
6.12.3 Operating Revenue Structure
6.12.4 Production and Sales
6.12.5 R&D Costs
6.12.6 Cost Structure
6.12.7 Prospects
6.13 NAVECO Ltd.
6.13.1 Profile
6.13.2 Production and Sales
6.13.3 Latest Development
6.14 Hebei Baoding Changan Bus Co., Ltd.
6.14.1 Profile
6.14.2 Production and Sales
6.14.3 Latest Development
6.15 SAIC Motor Commercial Vehicle Co., Ltd.
6.15.1 Profile
6.15.2 Financial Survey
6.15.3 Production and Sales
6.15.4 Latest Development
6.16 Fujian New Forta Automobile Co., Ltd.
6.16.1 Profile
6.16.2 Production and Sales
China’s Bus Production and Sales, 2005-2018E
China’s Bus Market Structure, 2005-2018E
China’s Bus Market Structure by Length, 2014
China’s Bus Market Structure by Application, 2014-2015
Top 10 Chinese Bus Enterprises, 2014
Top 10 Chinese Bus Enterprises, 2015
Revenue of Major Chinese Bus Manufacturers, 2014-2015
Net Income of Major Chinese Bus Manufacturers, 2014-2015
Gross Margin of Major Chinese Bus Manufacturers, 2014-2015
Import & Export Volume and Value of Buses in China, 2009-2015
Import Volume and Value of Buses in China by Type, 2009-2015
Export Volume and Value of Buses in China by Type, 2009-2015
China’s Bus Import Origins, 2014
China’s Bus Import Origins, 2015
China’s Top 10 Bus Export Destinations, 2014
China’s Top 10 Bus Export Destinations, 2015
Number of Registered School Buses in China, 2009-2014
Market Structure of School Buses in China by Length, 2012-2014
Market Structure of School Buses (length ≥ 5m) in China by Application, 2014
Number of Registered School Buses in China by Province/Municipality, 2014
Number of Registered School Buses in Major Cities, 2014
Number of Registered School Buses in Markets at All Levels, 2014
Number of Registered School Buses of Major Manufacturers in China, 2014
Top 10 School Bus Modes in China by Registration, 2014
Sales Volume of High-end Buses in China, 2015H1
Sales Volume of High-end Buses in China, 2009-2015
Sales Volume of High-end Buses in China by Price Range, 2009-2015H1
Sales Volume of High-end Buses in China by Major Regions, 2015H1
Output of Large-sized Buses and Chassis in China, 2005-2018E
Sales Volume of Large-sized Buses and Chassis in China, 2005-2018E
TOP 10 Large-sized Bus Manufacturers in China, 2014
Market Share of Large-sized Bus Chassis Manufacturers in China, 2014
TOP 10 Large-sized Bus Manufacturers in China, 2015
Market Share of Large-sized Bus Chassis Manufacturers in China, 2015
Market Structure of Large-sized Buses in China by Application, 2014-2015
Output of Medium-sized Buses and Chassis in China, 2005-2018E
Sales Volume of Medium-sized Buses and Chassis in China, 2005-2018E
TOP10 Medium-sized Bus Manufacturers in China, 2014
Market Share of Medium-sized Bus Chassis Manufacturers in China, 2014
TOP10 Medium-sized Bus Manufacturers in China, 2015
Market Share of Medium-sized Bus Chassis Manufacturers in China, 2015
Market Structure of Medium-sized Buses in China by Application, 2014-2015
Output of Light-duty Buses and Chassis in China, 2005-2018E
Sales Volume of Light-duty Buses and Chassis in China, 2005-2018E
TOP 10 Light-duty Bus Manufacturers in China, 2014
Market Share of Light-duty Bus Chassis Manufacturers in China, 2014
TOP 10 Light-duty Bus Manufacturers in China, 2015
Market Share of Light-duty Bus Chassis Manufacturers in China, 2015
Market Structure of Light-duty Buses in China by Application, 2014-2015
Output of New Energy Buses in China, 2011-2018E
Output Proportion of New Energy Buses in China by Power Type, 2014
Number of China’s New Energy Vehicles Exempt from Purchase Tax
China’s Subsidy Standards for New Energy Buses, 2014-2015 (the Central Government)
Raw Material Costs of Major Chinese Bus Enterprises, 2014
Market Share of Major Chinese Commercial Vehicle Transmission Manufacturers, 2014
Major Commercial Vehicle Transmission Manufacturers in China
Major Bus Wheel Hub Suppliers in China
Passenger Transport of Roads in China, 2004-2015
Passenger Transport of High-speed Rail in China, 2008-2013
Tourism Rate of Chinese Residents, 2008-2013
Number of Tourists during the Golden Week in China, 2008-2015
Enrolments in Kindergarten, Primary and Secondary Schools, 2009-2013
Main Financial Indexes of Yutong Bus, 2010-2015
Operating Revenue Structure of Yutong Bus by Business, 2013-2014
Operating Revenue Structure of Yutong Bus by Region, 2013-2014
Bus Production and Sales of Yutong Bus by Product, 2009-2015
New Energy Bus Sales Volume of Yutong Bus, 2012-2014
R&D Costs of Yutong Bus, 2009-2014
Product Cost Structure of Yutong Bus, 2013-2014
Revenue, Net Income, and Gross Margin of Yutong Bus, 2015-2018E
Main Financial Indexes of Kinglong Motor Group, 2010-2015
Operating Revenue Structure of Kinglong Motor Group by Region, 2013-2014
Revenue and Net Income of Kinglong’s Major Subsidiaries, 2013-2014
Bus Output of Kinglong’s Major Subsidiaries, 2009-2015
Bus Sales Volume of Kinglong’s Major Subsidiaries, 2009-2015
R&D Costs of Kinglong Motor Group, 2010-2014
Cost Structure of Kinglong Motor Group, 2013-2014
Revenue, Net Income, and Gross Margin of Kinglong Motor Group, 2015-2018E
Main Financial Indexes of Zhongtong Bus, 2010-2015
Operating Revenue Structure of Zhongtong Bus by Business, 2013-2014
Operating Revenue Structure of Zhongtong Bus by Region, 2013-2014
Sales Volume of Zhongtong Bus, 2014
R&D Costs of Zhongtong Bus, 2012-2014
Cost Structure of Zhongtong Bus, 2013-2014
Revenue, Net Income, and Gross Margin of Zhongtong Bus, 2015-2018E
Main Financial Indexes of Foton, 2010-2015
Operating Revenue Structure of Foton by Business, 2013-2014
Operating Revenue Structure of Foton by Region, 2013-2014
Bus Production and Sales of Foton by Type, 2009-2015
R&D Costs of Foton, 2010-2014
Revenue, Net Income, and Gross Margin of Foton, 2015-2018E
Main Financial Indexes of Anhui Ankai Automobile, 2010-2015
Operating Revenue Structure of Anhui Ankai Automobile by Business, 2013-2014
Operating Revenue Structure of Anhui Ankai Automobile by Region, 2013-2014
Bus Production and Sales of Anhui Ankai Automobile, 2009-2015
R&D Costs of Anhui Ankai Automobile, 2010-2014
Cost Structure of Anhui Ankai Automobile, 2013-2014
Main Financial Indexes of SG Automotive Group, 2010-2015
Operating Revenue Structure of SG Automotive Group by Business, 2013-2014
Operating Revenue Structure of SG Automotive Group by Region, 2013-2014
Bus Production and Sales of Dandong Huanghai Motors, 2009-2015
Cost Structure of SG Automotive Group, 2013-2014
Main Financial Indexes of Asiastar, 2010-2015
Operating Revenue Structure of Asiastar by Business, 2013-2014
Operating Revenue Structure of Asiastar by Region, 2013-2014
Bus Production and Sales of Asiastar, 2009-2015
R&D Costs of Asiastar, 2010-2014
Cost Structure of Asiastar, 2013-2014
Main Financial Indexes of BYD, 2010-2015
Operating Revenue Structure of BYD by Business, 2013-2014
Operating Revenue Structure of BYD by Region, 2013-2014
Bus Production and Sales of BYD, 2011-2015
Revenue, Net Income, and Gross Margin of BYD, 2015-2018E
Main Financial Indexes of JAC, 2010-2015
Operating Revenue Structure of JAC by Business, 2013-2014
Operating Revenue Structure of JAC by Region, 2013-2014
Bus Production and Sales of JAC, 2009-2015
R&D Costs of JAC, 2010-2014
Cost Structure of JAC, 2013-2014
JAC’s Revenue, Net Income, and Gross Margin, 2015-2018E
Main Financial Indexes of Shenyang Jinbei Automotive, 2010-2015
Operating Revenue Structure of Shenyang Jinbei Automotive by Business, 2013-2014
Operating Revenue Structure of Shenyang Jinbei Automotive by Region, 2013-2014
Bus Production and Sales of Shenyang Jinbei Automotive, 2009-2015
R&D Costs of Shenyang Jinbei Automotive, 2012-2014
Cost Structure of Shenyang Jinbei Automotive. 2013-2014
Revenue, Net Income, and Gross Margin of Shenyang Jinbei Automotive of Shenyang Jinbei Automotive, 2015-2018E
Main Financial Indexes of JMC, 2010-2015
Operating Revenue Structure of JMC by Business, 2013-2014
Operating Revenue Structure of JMC by Region, 2013-2014
Bus Production and Sales of JMC, 2009-2015
R&D Costs of JMC, 2010-2014
JMC’s Revenue, Net Income, and Gross Margin, 2015-2018E
Main Financial Indexes of Dongfeng Motor Corporation, 2010-2015
Operating Revenue Structure of Main Financial Indexes of Dongfeng Motor Corporation by Business, 2013-2014
Operating Revenue Structure of Main Financial Indexes of Dongfeng Motor Corporation by Region,2013-2014
Bus Production and Sales of Main Financial Indexes of Dongfeng Motor Corporation, 2009-2015
R&D Costs of Dongfeng Motor Corporation, 2010-2014
Cost Structure of Dongfeng Motor Corporation, 2013-2014
Revenue, Net Income, and Gross Margin of Dongfeng Motor Corporation, 2015-2018E
Revenue of SAIC Commercial Vehicle, 2011-2014
Bus Production and Sales of SAIC Commercial Vehicle, 2011-2015
Automotive AIOS Research Report, 2026
Automotive AIOS Research: Mass Production Solutions Are Implemented
Mass Production Solutions Are Implemented on A Small Scale.
In 2026, AIOS starts small-scale implementation, helping to improve v...
Automotive Telematics Service Provider (TSP) Research Report, 2026
TSP Research: Leading providers collectively turn to AI agents to provide all-scenario active services
Telematics Service Providers (TSPs) are the core hub of the telematics industry chain, connectin...
Automotive Smart Interior Research Report, 2026
Smart Interior Research: As Technologies like Interactive Starlight Headliner, Hidden Display and Surface Projection Are Launched, Automotive Interiors Become Ever More Intelligent
The Automotive Sma...
Research Report on AI Applications in Cockpits, 2026
AI Application in Cockpits: AI Services Become More Comprehensive, Convenient, and Refined.
In the first half of 2026, cockpit AI functions underwent initial upgrades across multiple dimensions, inc...
Software-Defined Vehicles in 2026: OEM Software Development and Supply Chain Deployment Strategy Research Report
Research on OEMs’ Software Strategies: R&D Focus, Development Strategies and Supplier Building Models of 30 OEMs
In this paper, we adopt a research framework covering 13 subsystems and 48 sub-di...
Passenger Car Chassis Domain Control and Chassis Cross-Domain Integration Research Report, 2026
Chassis Control Research: Mass Production of Full Chassis-by-Wire Solutions Starts
1. A Cluster of Full Chassis-by-Wire Solutions Make Their Debut, and EMB Enters Mass Production and Adoption for the...
Central Domain Control (Powertrain, Chassis, Body) and Motion Controller Research Report, 2026
Central Domain Control and Motion Control Research: XYZ Coordinated Control and Full X-by-Wire Actuation System
With the gradual penetration of L3+ autonomous driving, the chassis control system is ...
48V Low-voltage Power Distribution Network (PDN) Architecture and Supply Chain Panorama Research Report, 2026
Research on 48V Low-Voltage Power Distribution Network (PDN): An Active 48V Supply Chain, with Priority Deployment in High-Power Scenarios Such as Steer-by-Wire Chassis
The automotive 48V low-voltage...
AI-Defined Vehicle (AIDV) OEMs' Deployment Strategies Research Report, 2026
AIDV Research: Deployment Strategies of 22 OEMs
The AI-Defined Vehicle (AIDV) OEMs' Deployment Strategies Research Report, 2026, released by ResearchInChina, analyzes the AI deployment strategies of ...
OEMs’ Passenger Car Model Planning Research Report, 2026
Vehicle Model Planning Research: Chinese OEMs Launch Sub-Brands Intensively, While Multinational OEMs Apply the Brakes to Electrification Strategies
ResearchInChina released the OEMs’ Passenger Car M...
Autonomous Driving Simulation and World Model Research Report, 2026
Autonomous driving simulation research: "Simulation test + world model"-driven test system has become R&D infrastructure.
The "Autonomous Driving Simulation and World Model Research Report, 2026"...
Cockpit-Driving Integration Central Domain Controller SoC and AI Supercomputing Architecture Research Report, 2026
Cockpit-Driving integration and AI supercomputing research: The One Chip solution is rapidly installed in vehicles, and AI supercomputing architectures are moving towards full-domain integration.
AI ...
Intelligent Driving End-to-End Large Model Research Report, 2026
Research on Intelligent Driving Large Models: A Critical Period for Technological Competition and Paradigm Integration
As autonomous driving technology rapidly iterates from L2 to L3?L4, intelligent...
Automotive Digital Key Industry Trend Report, 2026
Digital Key Research: Automotive BLE, UWB and SLE Hardware Layout
The Automotive Digital Key Industry Trend Report, 2026, released by ResearchInChina, analyzes and predicts the digital key market, co...
Monthly Report on Automotive New Technology (May 2026)
UHD gaze technology, full-color LiDAR, UWB, etc. promote the upgrade of intelligent driving perception capabilities
This report is published once a month and is available for annual subscription.The...
In-Cabin Monitoring Systems (DMS, OMS, etc.) Research Report, 2026
In-Cabin Monitoring System Research: DMS to Become Mandatory in 2027, Expected to be Installed in Over 14 Million Vehicles
ResearchInChina released the In-Cabin Monitoring Systems (DMS, OMS, etc.) Re...
Automotive Service-Oriented Architecture (SOA) and Cross-Domain Middleware Industry Report, 2026
Research on automotive SOA and cross-domain middleware: The era of AI atomic services and AI cross-domain fusion agents is coming.
Automotive SOA evolves towards AI + full SOA servitization Driv...
Automotive Display, Center Console and Cluster Industry Report, 2026
Automotive Display Research: Multi-Screen Application Slows Down, While OLED and MiniLED Are Introduced in Vehicles Quickly
In 2026, automotive displays will no longer excessively pursue the number a...