China Bus Industry Report, 2016-2020
-
July 2016
- Hard Copy
- USD
$2,500
-
- Pages:130
- Single User License
(PDF Unprintable)
- USD
$2,300
-
- Code:
YSJ098
- Enterprise-wide License
(PDF Printable & Editable)
- USD
$3,700
-
- Hard Copy + Single User License
- USD
$2,700
-
Affected by multiple factors like the slowdown in macro-economic growth, the slashed local fiscal expenditure and the substitution effect of high-speed rail passenger transport, Chinese bus market declined during 2015-2016. In 2015, China produced 590,900 buses (including chassis) and sold 595,400 ones, down 2.69% and 1.90% year on year respectively. In the first half of 2016, the bus output and sales volume amounted to 255,700 and 253,800 respectively, down 9.44% and 9.48% year on year correspondingly.
The market segments feature the followings:
Among seat buses, tour buses and light seat buses witness rapid growth. In 2015-2016, the construction of the high-speed railway network led to the contraction of medium and long-distance bus lines and departure frequencies as well as slow growth of medium and large seat buses. At the same time, the tourism market propelled the demand for tour buses which maintained fast growth. Thanks to the national policy on the development of urban and rural integrated transportation, the demand for medium and short-haul light seat buses commuting between urban and rural areas jumped, with the growth rate of as high above 40% in 2015.
Transit buses benefit from the fast-growing new energy. In 2015-2016, transit buses grew radically under the boost of new energy vehicles. From January to May of 2016, China's output of new energy buses (BEV + PHEV) totaled 25,997, a year-on-year surge of 125.65%. Wherein, the output of BEVs (battery electric vehicles) soared by 225.74% year on year, becoming the absolute mainstream. In the future, new energy transit buses will be the highlight of the bus market as the new energy trend becomes more obvious.
Chinese Bus Market Structure, 2015-2016
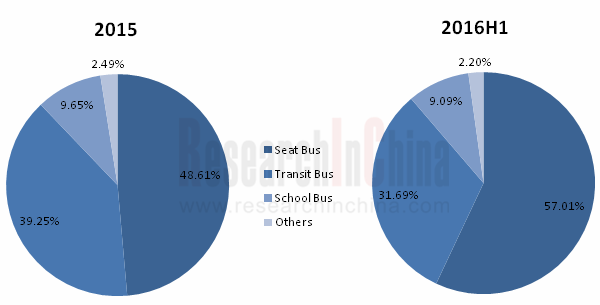
Source: ResearchInChina
The rising demand for new energy buses has stimulated Chinese bus companies to promote such buses. As the largest large and medium-sized bus manufacturer in China, Yutong Bus sold 20,446 new energy buses in 2015, including 13,885 battery electric buses and 6,561 plug-in buses. In addition, the company obtained China's first fuel cell bus production qualification in 2015, which may facilitate its leading-edge development in the field of fuel cell buses in the future.
Xiamen King Long Motor Group started relatively late in new energy buses, but its three wholly-owned subsidiaries: Higer Bus, Xiamen King Long United Automotive Industry, and Xiamen Golden Dragon Bus hold adequate technical reserves and have robust competitive strength. In 2015, Xiamen King Long Motor Group produced a total of 19,435 new energy buses, and sold 18,434 ones consisting of 12,323 battery electric buses (skyrocketing 1041% year on year) and 6,111 plug-in buses (up 165% year on year). The Group's new energy bus battery and motor systems are purchased from main suppliers such as CATL, Microvast and Jing-Jin Electric Technologies (Beijing), while its electronic control systems are the result of its independent R & D and design.
The report mainly deals with the following:
 Market size, market structure, competitive landscape, import and export, and trends of China’s overall bus market (including chassis);
Market size, market structure, and competitive landscape of large, medium, and light bus market in China;
Market size, market structure and status quo of seat buses, transit buses, school buses, natural gas buses and other market segments in China;
Market Size, competitive landscape, related policies, technology roadmap, and industrial investment of new energy buses in China;
Telematics and active safety technology development of China bus industry;
China’s bus industry chain, including the supply relationship of main upstream spare parts (transmission, wheel hub, and new energy batteries) and downstream market demand;
Development of Chinese bus manufacturers, including their financial data, bus production and sales, new energy bus business, capacity, cost structure, latest developments, etc.
1 Industry Overview
1.1 Product Introduction
1.2 Product Classification
1.3 Policies
2 Overall Bus Market in China
2.1 Market Size
2.2 Market Structure
2.3 Competitive Landscape
2.3.1 Market Share
2.3.2 Performance Comparison
2.4 Import & Export
2.4.1 Overall Market
2.4.2 Market Segment
2.4.3 By Country
2.5 Market Segments
2.5.1 Seat Bus
2.5.2 Transit Bus
2.5.3 School Bus
2.6 Natural Gas Bus
2.7 Bus Active Safety and Telematics
2.7.1 Policy and Planning
2.7.2 Technical Standards
2.7.3 Layout of Enterprises
2.8 Market Trends
2.8.1 Technology Trends
2.8.2 Market Trends
3 Bus Market Segments in China
3.1 Large Bus Market
3.1.1 Market Size
3.1.2 Competitive Landscape
3.1.3 Market Structure
3.2 Medium Bus Market
3.2.1 Market Size
3.2.2 Competitive Landscape
3.2.3 Market Structure
3.3 Light Bus Market
3.3.1 Market Size
3.3.2 Competitive Landscape
3.3.3 Market Structure
4 New Energy Bus Market
4.1 Market Size
4.2 Competitive Landscape
4.3 Policies
4.3.1 Policies on Fiscal Subsidies
4.3.2“Oil Reduction & Electricity Compensation” Policy
4.3.3 Promotion and Assessment Methods
4.4 Technology Roadmap
4.5 Fuel Cell Bus
5 Bus Industry Chain
5.1 Upstream Raw Material Market
5.2 Key Components
5.2.1 Transmission
5.2.2 Wheel Hub
5.2.3 New Energy Battery
5.3 Downstream Demand Market
5.3.1 Passenger Transport
5.3.2 High Speed Rail
5.3.3 Tourism
6 Major Enterprises
6.1 Zhengzhou Yutong Bus Co., Ltd.
6.1.1 Profile
6.1.2 Financial Performance
6.1.3 Operating Revenue Structure
6.1.4 Output and Sales Volume
6.1.5 New Energy Bus
6.1.6 Production Capacity
6.1.7 R&D Costs
6.1.8 Cost Structure
6.1.9 Components & Parts
6.1.10 Dynamics
6.1.11 Prospects
6.2 Xiamen King Long Motor Group
6.2.1 Profile
6.2.2 Financial Performance
6.2.3 Operating Revenue Structure
6.2.4 Operation of Major Subsidiaries
6.2.5 Output and Sales Volume
6.2.6 New Energy Bus
6.2.7 Production Capacity
6.2.8 R&D Costs
6.2.9 Cost Structure
6.2.10 Dynamics
6.2.11 Prospects
6.3 Zhongtong Bus and Holding Co., Ltd.
6.3.1 Profile
6.3.2 Financial Performance
6.3.3 Operating Revenue Structure
6.3.4 Output and Sales Volume
6.3.5 New Energy Bus
6.3.6 R&D Costs
6.3.7 Cost Structure
6.3.8 Dynamics
6.3.9 Prospects
6.4 Beiqi Foton Motor Co., Ltd.
6.4.1 Profile
6.4.2 Financial Performance
6.4.3 Operating Revenue Structure
6.4.4 Output and Sales Volume
6.4.5 New Energy Bus
6.4.6 Production Capacity
6.4.7 R&D Costs
6.4.8 Prospects
6.5 Anhui Ankai Automobile Co., Ltd.
6.5.1 Profile
6.5.2 Financial Performance
6.5.3 Operating Revenue Structure
6.5.4 Output and Sales Volume
6.5.5 New Energy Bus
6.5.6 Production Capacity
6.5.7 R&D Costs
6.5.8 Cost Structure
6.6 Liaoning SG Automotive Group Co., Ltd.
6.6.1 Profile
6.6.2 Financial Performance
6.6.3 Operating Revenue Structure
6.6.4 Output and Sales Volume
6.6.5 New Energy Business
6.6.6 Cost Structure
6.7 Yangzhou Yaxing Motor Coach Co., Ltd.
6.7.1 Profile
6.7.2 Financial Performance
6.7.3 Operating Revenue Structure
6.7.4 Output and Sales Volume
6.7.5 New Energy Bus
6.7.6 R&D Costs
6.7.7 Cost Structure
6.8 BYD Company Co., Ltd.
6.8.1 Profile
6.8.2 Financial Performance
6.8.3 Operating Revenue Structure
6.8.4 Output and Sales Volume
6.8.5 New Energy Bus
6.8.6 Dynamics
6.8.7 Prospects
6.9 Anhui Jianghuai Automobile Co., Ltd.
6.9.1 Profile
6.9.2 Financial Performance
6.9.3 Operating Revenue Structure
6.9.4 Output and Sales Volume
6.9.5 R&D Costs
6.9.6 Cost Structure
6.9.7 Prospects
6.10 Shenyang Jinbei Automotive Co., Ltd.
6.10.1 Profile
6.10.2 Financial Performance
6.10.3 Operating Revenue Structure
6.10.4 Output and Sales Volume
6.10.5 R&D Costs
6.10.6 Cost Structure
6.10.7 Prospects
6.11 Jiangling Motors Co., Ltd.
6.11.1 Profile
6.11.2 Financial Performance
6.11.3 Operating Revenue Structure
6.11.4 Output and Sales Volume
6.11.5 R&D Costs
6.11.6 Prospects
6.12 Dongfeng Motor Corporation
6.12.1 Profile
6.12.2 Financial Performance
6.12.3 Operating Revenue Structure
6.12.4 Output and Sales Volume
6.12.5 R&D Costs
6.12.6 Cost Structure
6.12.7 Prospects
6.13 NAVECO Ltd.
6.13.1 Profile
6.13.2 Output and Sales Volume
6.13.3 Dynamics
6.14 Hebei Baoding Changan Bus Co., Ltd.
6.14.1 Profile
6.14.2 Output and Sales Volume
6.14.3 Dynamics
6.14.4 Operating Goals
6.15 SAIC Maxus Co., Ltd.
6.15.1 Profile
6.15.2 Output and Sales Volume
6.15.3 New Energy Business
6.15.4 Dynamics
6.16 Fujian New Forta Automobile Co., Ltd.
6.16.1 Profile
6.16.2 Output and Sales Volume
Output and Sales Volume of Buses in China, 2005-2020E
Market Structure of Buses in China, 2005-2020E
TOP10 Bus Manufacturers in China, 2014
TOP10 Bus Manufacturers in China, 2015
TOP10 Bus Manufacturers in China, 2016
Revenue of Major Bus Manufacturers in China, 2014-2016
Net Income of Major Bus Manufacturers in China, 2014-2016
Gross Margin of Major Bus Manufacturers in China, 2014-2016
Import & Export Volume and Value of Buses in China, 2009-2015
Import Volume and Value of Buses in China by Type, 2009-2016
Export Volume and Value of Buses in China by Type, 2009-2016
China’s Bus Import Sources, 2015
China’s Bus Import Sources, 2016
China’s Top 10 Bus Export Destinations, 2015
China’s Top 10 Bus Export Destinations, 2016
Sales Volume of Buses in China by Purpose, 2014-2015
Sales Structure of Major Bus Manufacturers in China by Purpose, 2016
Market Structure of Large and Medium-sized Seat Buses in China by Purpose, 2015
Sales Volume of Buses in China by Type, 2014-2015
Sales Volume of School Buses in China, 2009-2015
Natural Gas Bus Sales Volume of Major Enterprises, 2015
Output and Sales Volume of Natural Gas Buses in China, 2014-2016
Intelligent Operation System of Major Bus Manufacturers in China
Output of Large Buses and Chassis in China, 2005-2020E
Sales Volume of Large Buses and Chassis in China, 2005-2020E
TOP10 Large Bus Manufacturers in China, 2014
Market Share of Large Bus Chassis Manufacturers in China, 2014
TOP10 Large Bus Manufacturers in China, 2015
Market Share of Large Bus Chassis Manufacturers in China, 2015
TOP10 Large Bus Manufacturers in China, 2016
Market Share of Large Bus Chassis Manufacturers in China, 2016
Market Structure of Large Buses in China by Purpose, 2014-2015
Output of Medium-sized Buses and Chassis in China, 2005-2020E
Sales Volume of Medium-sized Buses and Chassis in China, 2005-2020E
TOP10 Medium-sized Bus Manufacturers in China, 2014
Market Share of Medium-sized Bus Chassis Manufacturers in China, 2014
TOP10 Medium-sized Bus Manufacturers in China, 2015
Market Share of Medium-sized Bus Chassis Manufacturers in China, 2015
TOP10 Medium-sized Bus Manufacturers in China, 2016
Market Share of Medium-sized Bus Chassis Manufacturers in China, 2016
Market Structure of Medium-sized Buses in China by Purpose, 2014-2015
Market Structure of Medium-sized Buses in China by Length, 2014-2015
Output of Light Buses and Chassis in China, 2005-2020E
Sales Volume of Light Buses and Chassis in China, 2005-2020E
TOP10 Light Bus Manufacturers in China, 2014
Market Share of Light Bus Chassis Manufacturers in China, 2014
TOP10 Light Bus Manufacturers in China, 2015
Market Share of Light Bus Chassis Manufacturers in China, 2015
TOP10 Light Bus Manufacturers in China, 2016
Market Share of Light Bus Chassis Manufacturers in China, 2016
Market Structure of Light Buses in China by Length, 2014-2015
Monthly Output of New Energy Buses in China, 2015-2016
Market Structure of New Energy Buses in China, 2015-2016
Output of New Energy Buses in China, 2011-2020E
TOP10 New Energy Bus Manufacturers in China by Output, 2015
TOP10 New Energy Bus Manufacturers in China by Output, 2016
TOP10 Battery Electric Bus Manufacturers in China by Output, 2015
TOP10 Battery Electric Bus Manufacturers in China by Output, 2016
TOP10 Plug-in Hybrid Electric Bus Manufacturers in China by Output, 2015
TOP10 Plug-in Hybrid Electric Bus Manufacturers in China by Output, 2016
Subsidy Standard for Electric Buses, 2016
Electric Bus Subsidy Standard from China’s Central Government Budget, 2014-2015
Subsidy Standard for Fuel Cell Cars in China, 2016
Cost of Raw Materials of Major Bus Manufacturers in China, 2014-2015
Market Share of Major Commercial Vehicle Transmission Manufacturers in China
Major Suppliers of Commercial Vehicle Transmission in China
Wheel Hub Suppliers of Major Bus Manufacturers in China
Highway Passenger Transportation in China, 2004-2016
High-speed Rail Mileage in China, 2013-2015
Passenger Capacity of High-speed Rail in China, 2013-2015
Total Tourism Revenue in China, 2001-2015
Number of Tourists during the Chinese Golden Week Holiday, 2008-2016
Main Financial Indicators of Yutong Bus, 2010-2016
Operating Revenue Structure of Yutong Bus by Business, 2013-2015
Operating Revenue Structure of Yutong Bus by Region, 2013-2015
Output and Sales Volume of Yutong Bus by Product, 2009-2016
Sales Structure of Yutong Bus, 2015
New Energy Bus Output of Yutong Bus, 2014-2016
New Energy Bus Sales Volume of Yutong Bus, 2012-2015
New Energy Bus Sales Volume of Yutong Bus by Type, 2015
R&D Costs of Yutong Bus, 2009-2015
Product Cost Structure of Yutong Bus, 2013-2015
Revenue, Net Income, and Gross Margin of Yutong Bus, 2015-2020E
Main Financial Indicators of Xiamen King Long Motor Group, 2010-2016
Operating Revenue Structure of Xiamen King Long Motor Group by Region, 2013-2015
Revenue and Net Income of Major Subsidiaries of Xiamen King Long Motor Group, 2013-2015
Bus Output of Subsidiaries of Xiamen King Long Motor Group, 2009-2016
Bus Sales Volume of Subsidiaries of Xiamen King Long Motor Group, 2009-2016
New Energy Bus Output of Xiamen King Long Motor Group, 2014-2016
New Energy Bus Sales Volume of Xiamen King Long Motor Group by Length, 2015
New Energy Bus Sales Volume of Xiamen King Long Motor Group by Purpose, 2015
Percentage of Purchased Key Parts for New Energy Bus of Xiamen King Long Motor Group
R&D Costs of Xiamen King Long Motor Group, 2010-2015
Cost Structure of Xiamen King Long Motor Group, 2013-2015
Revenue, Net Income, and Gross Margin of Xiamen King Long Motor Group, 2015-2020E
Main Financial Indicators of Zhongtong Bus, 2010-2016
Operating Revenue Structure of Zhongtong Bus by Business, 2013-2015
Operating Revenue Structure of Zhongtong Bus by Region, 2013-2015
Output and Sales Volume of Zhongtong Bus, 2009-2016
New Energy Bus Output of Zhongtong Bus, 2014-2016
R&D Costs of Zhongtong Bus, 2012-2015
Cost Structure of Zhongtong Bus, 2013-2015
Revenue, Net Income, and Gross Margin of Zhongtong Bus, 2015-2020E
Main Financial Indicators of Beiqi Foton Motor, 2010-2016
Operating Revenue Structure of Beiqi Foton Motor by Business, 2013-2015
Operating Revenue Structure of Beiqi Foton Motor by Region, 2013-2015
Bus Output and Sales Volume of Beiqi Foton Motor by Type, 2009-2016
New Energy Bus Output of Beiqi Foton Motor, 2014-2016
New Energy Bus Sales Volume of FOTON AUV, 2013-2016
New Energy Bus Orders of FOTON AUV, 2016
R&D Costs of Beiqi Foton Motor, 2010-2015
Revenue, Net Income, and Gross Margin of Beiqi Foton Motor, 2015-2020E
Financial Indicators of Anhui Ankai Automobile, 2010-2016
Operating Revenue Structure of Anhui Ankai Automobile by Business, 2013-2015
Operating Revenue Structure of Anhui Ankai Automobile by Region, 2013-2015
Output and Sales Volume of Anhui Ankai Automobile, 2009-2016
New Energy Bus Output of Anhui Ankai Automobile, 2014-2016
R&D Costs of Anhui Ankai Automobile, 2010-2015
Cost Structure of Anhui Ankai Automobile, 2015
Financial Indicators of SG Automotive Group, 2010-2016
Operating Revenue Structure of SG Automotive Group by Business, 2013-2015
Operating Revenue Structure of SG Automotive Group by Region, 2013-2014
Huanghai Bus Output and Sales Volume of SG Automotive Group, 2009-2016
Huanghai New Energy Bus Output of SG Automotive Group, 2014-2016
Cost Structure of SG Automotive Group, 2013-2015
Financial Indicators of Asiastar, 2010-2016
Operating Revenue Structure of Asiastar by Business, 2013-2015
Operating Revenue Structure of Asiastar by Region, 2013-2015
Output and Sales Volume of Asiastar, 2009-2016
New Energy Bus Output of Asiastar, 2014-2016
New Energy Bus Sales Volume of Asiastar, 2014-2015
Asiastar’s Subsidy Income from New Energy Bus, 2015
R&D Costs of Asiastar, 2010-2015
Cost Structure of Asiastar, 2013-2015
Financial Indicators of BYD, 2010-2016
Operating Revenue Structure of BYD by Business, 2013-2015
Operating Revenue Structure of BYD by Region, 2013-2015
Bus Output and Sales Volume of BYD, 2011-2016
Main New Energy Buses of BYD
New Energy Bus Output of BYD, 2014-2016
New Energy Bus Sales Volume of BYD, 2013-2016
BYD Won the Tender of Shenzhen’s Solution Project for Upgrading 3,024 Battery Electric Buses
Revenue, Net Income, and Gross Margin of BYD, 2015-2020E
Financial Indicators of JAC, 2010-2016
Operating Revenue Structure of JAC by Business, 2013-2015
Operating Revenue Structure of JAC by Region, 2013-2015
Bus Output and Sales Volume of JAC, 2009-2016
R&D Costs of JAC, 2010-2015
Cost Structure of JAC, 2015
Revenue, Net Income, and Gross Margin of JAC, 2015-2020E
Financial Indicators of Jinbei Auto, 2010-2016
Operating Revenue Structure of Jinbei Auto by Business, 2013-2015
Operating Revenue Structure of Jinbei Auto by Region, 2013-2015
Bus Output and Sales Volume of Jinbei Auto, 2009-2015
R&D Costs of Jinbei Auto, 2012-2015
Cost Structure of Jinbei Auto, 2013-2015
Revenue, Net Income, and Gross Margin of Jinbei Auto, 2015-2020E
Financial Indicators of JMC, 2010-2016
Operating Revenue Structure of JMC by Business, 2013-2015
Operating Revenue Structure of JMC by Region, 2013-2014
Bus Output and Sales Volume of JMC, 2009-2016
R&D Costs of JMC, 2010-2015
Revenue, Net Income, and Gross Margin of JMC, 2015-2018E
Financial Indicators of Dongfeng Motor, 2010-2016
Operating Revenue Structure of Dongfeng Motor by Business, 2013-2015
Operating Revenue Structure of Dongfeng Motor by Region, 2013-2015
Bus Output and Sales Volume of Dongfeng Motor, 2009-2015
R&D Costs of Dongfeng Motor, 2010-2015
Cost Structure of Dongfeng Motor, 2013-2015
Revenue, Net Income, and Gross Margin of Dongfeng Motor, 2015-2020E
Bus Output and Sales Volume of SAIC MAXUS, 2011-2016
Capacity of SAIC MAXUS (including New Energy), 2015
Ongoing Projects of SAIC MAXUS, 2015
New Energy Vehicle Output, Sales Volume, and Revenue of SAIC MAXUS, 2015
48V Low-voltage Power Distribution Network (PDN) Architecture and Supply Chain Panorama Research Report, 2026
Research on 48V Low-Voltage Power Distribution Network (PDN): An Active 48V Supply Chain, with Priority Deployment in High-Power Scenarios Such as Steer-by-Wire Chassis
The automotive 48V low-voltage...
AI-Defined Vehicle (AIDV) OEMs' Deployment Strategies Research Report, 2026
AIDV Research: Deployment Strategies of 22 OEMs
The AI-Defined Vehicle (AIDV) OEMs' Deployment Strategies Research Report, 2026, released by ResearchInChina, analyzes the AI deployment strategies of ...
OEMs’ Passenger Car Model Planning Research Report, 2026
Vehicle Model Planning Research: Chinese OEMs Launch Sub-Brands Intensively, While Multinational OEMs Apply the Brakes to Electrification Strategies
ResearchInChina released the OEMs’ Passenger Car M...
Autonomous Driving Simulation and World Model Research Report, 2026
Autonomous driving simulation research: "Simulation test + world model"-driven test system has become R&D infrastructure.
The "Autonomous Driving Simulation and World Model Research Report, 2026"...
Cockpit-Driving Integration Central Domain Controller SoC and AI Supercomputing Architecture Research Report, 2026
Cockpit-Driving integration and AI supercomputing research: The One Chip solution is rapidly installed in vehicles, and AI supercomputing architectures are moving towards full-domain integration.
AI ...
Intelligent Driving End-to-End Large Model Research Report, 2026
Research on Intelligent Driving Large Models: A Critical Period for Technological Competition and Paradigm Integration
As autonomous driving technology rapidly iterates from L2 to L3?L4, intelligent...
Automotive Digital Key Industry Trend Report, 2026
Digital Key Research: Automotive BLE, UWB and SLE Hardware Layout
The Automotive Digital Key Industry Trend Report, 2026, released by ResearchInChina, analyzes and predicts the digital key market, co...
Monthly Report on Automotive New Technology (May 2026)
UHD gaze technology, full-color LiDAR, UWB, etc. promote the upgrade of intelligent driving perception capabilities
This report is published once a month and is available for annual subscription.The...
In-Cabin Monitoring Systems (DMS, OMS, etc.) Research Report, 2026
In-Cabin Monitoring System Research: DMS to Become Mandatory in 2027, Expected to be Installed in Over 14 Million Vehicles
ResearchInChina released the In-Cabin Monitoring Systems (DMS, OMS, etc.) Re...
Automotive Service-Oriented Architecture (SOA) and Cross-Domain Middleware Industry Report, 2026
Research on automotive SOA and cross-domain middleware: The era of AI atomic services and AI cross-domain fusion agents is coming.
Automotive SOA evolves towards AI + full SOA servitization Driv...
Automotive Display, Center Console and Cluster Industry Report, 2026
Automotive Display Research: Multi-Screen Application Slows Down, While OLED and MiniLED Are Introduced in Vehicles Quickly
In 2026, automotive displays will no longer excessively pursue the number a...
Global and China Intelligent Vehicle Standard System Construction and Certification Research Report, 2026
Intelligent Driving Standards and Certification: With the Maturing Standardization System, China Will Participate in Formulation of Global Standards
China's automotive industry is transforming from ...
Automotive Intelligent Diagnosis Industry Report, 2026
Automotive Intelligent Diagnosis Research: Powered by AI, Remote Diagnosis Is Being Upgraded towards Intelligence.
ResearchInChina released the Automotive Intelligent Diagnosis Industry Report, 2026....
Automotive Cloud Service Platform Research Report, 2026
Research on automotive cloud service platform: with architecture upgrade and computing power improvement, cloud services enter a new stage
In 2026, the Internet of Vehicles industry generates petaby...
Integrated Battery and Innovative Battery Technology Research Report, 2026
Power Battery Research: Sales of High-Capacity Vehicles Keep Rising, and Solid-State Batteries Begin to Be Installed in Vehicles
I. Sales of High-Capacity Vehicles Sustain Growth, and Those with A C...
Chinese Independent OEMs’ ADAS and Autonomous Driving Report, 2026
Research on OEMs' Intelligent Driving: Era of Physical AI, Standard Configuration of D2D, and Initial Exploration of L3 Commercial Pilot Projects
From 2023 to 2025, the intelligent driving installati...
Intelligent Vehicle New Technology Application Analysis Report, 2025-2026
New Technology Research: Innovative Products such as Bionic Cameras, Vision-LiDAR Fusion Sensors, Auditory Sensors Further Enhance Vehicle Perception Capabilities
ForewordResearchInChina released th...
Automotive Optical Fiber Communication (Optical Fiber Ethernet, PON) and Supply Chain Research Report, 2026
Research on Automotive Optical Fiber Communication: Introduction of Optical Fiber in Vehicles Accelerates, with Priority Deployment in High-Speed Communication Link (10+Gbps) Scenarios
Automotive opt...