China Activated Carbon Industry Report, 2014-2017
-
Apr.2015
- Hard Copy
- USD
$2,250
-
- Pages:105
- Single User License
(PDF Unprintable)
- USD
$2,100
-
- Code:
ZLC018
- Enterprise-wide License
(PDF Printable & Editable)
- USD
$3,300
-
- Hard Copy + Single User License
- USD
$2,450
-
Over the recent years, the global activated carbon consumption has kept growing with an AAGR of 5.5% or so, approximating 1.437 million tons in 2014. With the rising demand from the global industrial environmental protection, home/automotive environmental protection, water purification and other fields, the world’s demand for activated carbon is expected to hit 1.733 million tons in 2017.
The global capacity of activated carbon is mainly concentrated in the United States, Japan, France and a few other developed countries as well as some developing countries like China and the Philippines who abound in raw materials. The United States, Japan and France devote themselves to producing medium and high-end activated carbon products, while China manufactures low- and medium-end products with inferior quality and low added value.
However, China is the world's largest producer of activated carbon in terms of capacity, accounting for 43.2% of the global capacity. China’s activated carbon output was about 588,800 tons in 2014. As China’s environmental awareness gets enhanced and environmental protection policies tightened, China’s demand for activated carbon will present a CAGR of up to 6% in the next 3-5 years, higher than the global level.
China is also a major exporter of activated carbon. However, Chinese activated carbon with a focus on low-end products suffers anti-dumping investigations of some countries, thereby affecting the export in near future. In 2014, China exported 53,960 tons of wooden activated carbon and 191,550 tons of other types of activated carbon.
At present, Chinese medium and high-end activated carbon markets are dominated by Calgon, Meadwestvaco, Cabot, CECA, Kuraray and Osaka Gas Chemicals, who enter China usually by acquisitions or establishing plants with investments. Calgon has established three wholly-owned subsidiaries in China, namely Calgon Carbon (Tianjin), Datong Carbon Corporation and Calgon Carbon (Suzhou).
In China, activated carbon falls into wooden activated carbon and coaly activated carbon, which occupy 65.2% and 34.8% of the total output in 2014 respectively.
The leading Chinese producers of wooden activated carbon are represented by Fujian Yuanli Active Carbon, Fujian Xinsen Carbon, Zhixing Activated Carbon, Zhuxi Activated Carbon, etc.. Fujian Yuanli Active Carbon, a leader of the industry, sold 53,500 tons of activated carbon in 2014, up 11.2% year on year.
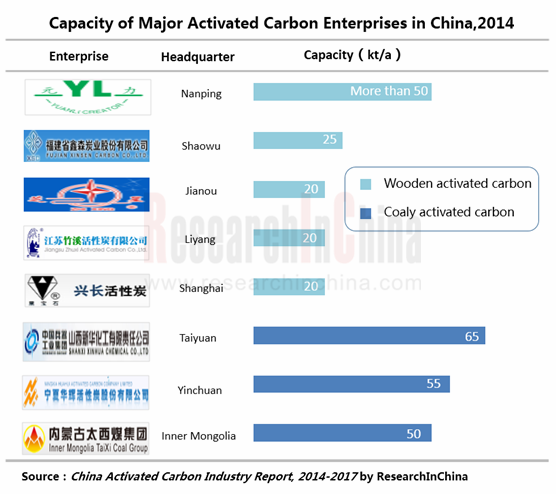
Among Chinese coaly activated carbon enterprises -- Xinhua Chemical, Huahui Activated Carbon and Taixi Coal, Xinhua Chemical ranked first with the capacity of 65,000 tons in 2014. However, Datong Coal Jinding Activated Carbon may surpass Xinhua Chemical to become the champion with the annual capacity of 100,000 tons by the end of 2015.
The report highlights the followings:
 Overview of the global activated carbon industry, including status quo and major countries and regions;
Overview of China activated carbon industry, embracing status quo, development environments, import and export, competitive landscape, upstream and downstream sectors, and development trends;
Six foreign activated carbon manufacturers and 19 Chinese counterparts, covering profile, operation, activated carbon business, etc..
1. Overview of Activated Carbon Industry
1.1 Definition
1.2 Classification
1.3 Application and Sales Model
2. Development of Global Activated Carbon Industry
2.1 Status Quo
2.2 Major Countries and Regions
2.2.1 USA
2.2.2 Japan
2.2.3 Russia
2.2.4 Western Europe
2.2.5 Asia
3. Development of China Activated Carbon Industry
3.1 Status Quo
3.2 Development Environment
3.2.1 Regulatory System
3.2.2 Industry Policy
3.2.3 Trade Policy
3.3 Import and Export
3.3.1 Import
3.3.2 Export
3.4 Competition Pattern
3.5 Upstream and Downstream Sectors
3.5.1 Upstream
3.5.2 Downstream
3.6 Development Trends
3.6.1 Demand for Wooden Activated Carbon Ascends
3.6.2 Some Weak Small Firms will Retreat from the Market
3.6.3 Mergers and Reorganizations will Continue, and the Concentration Rate of the Industry will Climb
3.6.4 The Industry Tends to be Scaled up and Standardized
3.6.5 Product Quality will be Improved
4. Leading Activated Carbon Companies Worldwide
4.1 Calgon
4.1.1 Profile
4.1.2 Operation
4.1.3 Revenue Structure
4.1.4 Gross Margin
4.1.5 R & D and Investment
4.1.6 Development in China
4.1.7 Forecast and Outlook
4.2 Cabot Norit
4.2.1 Profile
4.2.2 Operation
4.2.3 Revenue Structure
4.2.4 Gross Margin
4.2.5 Activated Carbon Business
4.3 Meadwestvaco
4.3.1 Profile
4.3.2 Operation
4.3.3 Revenue Structure
4.3.4 Gross Margin
4.3.5 Activated Carbon Business
4.4 Kuraray
4.4.1 Profile
4.4.2 Development in China
4.5 Osaka Gas Chemicals Group
4.5.1 Profile
4.5.2 Osaka Gas Chemicals (OGC)
4.5.3 Japan EnviroChemicals (JEC)
4.6 CECA
4.6.1 Profile
5. Leading Wooden Activated Carbon Enterprises in China
5.1 Fujian Yuanli Active Carbon
5.1.1 Profile
5.1.2 Operation
5.1.3 Revenue Structure
5.1.4 Gross Margin
5.1.5 R & D and Investment
5.1.6 Customers and Suppliers
5.1.7 Production and Sales
5.1.8 Forecast and Outlook
5.2 Fujian Xinsen Carbon
5.2.1 Profile
5.2.2 Operation
5.2.3 Development
5.3 Fujian Zhixing Activated Carbon
5.3.1 Profile
5.3.2 Operation
5.3.3 R & D
5.3.4 Development
5.4 Jiangsu Zhuxi Activated Carbon
5.4.1 Profile
5.4.2 Operation
5.5 Quzhou Yunhe Carbon
5.5.1 Profile
5.5.2 Operation
5.6 Shanghai Xingchang Activated Carbon
5.6.1 Profile
5.6.2 Operation
5.6.3 Activated Carbon Business
5.7 Hangzhou Hengxing Activated Carbon
5.7.1 Profile
5.7.2 Operation
5.8 Guizhou Qianmin Activated Carbon
5.8.1 Profile
5.8.2 Operation
5.9 Others
5.9.1 Chifeng Zhongsen Zhongtian Chemical Industry
5.9.2 Golden Lake Carbon
5.9.3 Datong Locomotive Coal
6 Major Coaly Activated Carbon Enterprises in China
6.1 Ningxia Huahui Activated Carbon
6.1.1 Profile
6.1.2 Operation
6.2 Datong Municipal Yunguang Activated Carbon
6.2.1 Profile
6.2.2 Operation
6.3 Ningxia Guanghua Cherishmet Activated Carbon
6.3.1 Profile
6.3.2 Operation
6.4 Shanxi Xinhua Chemical
6.4.1 Profile
6.4.2 Shanxi Xinhua Activated Carbon
6.5 Inner Mongolia Taixi Coal
6.5.1 Profile
6.5.2 Operation
6.5.3 Activated Carbon Business
6.6 Datong Coal Jinding Activated Carbon
6.6.1 Profile
6.6.2 Activated Carbon Business
6.7 Others
6.7.1Huairen Huanyu Purification Materials
6.7.2 Shanxi Huaqing Activated Carbon
Classification and Brief Introduction of Activated Carbon
Application and Sales Model of Activated Carbon
Global Demand for Activated Carbon and YoY Growth, 2008-2014
Global Demand for Activated Carbon and YoY Growth, 2012-2017E
Structure of Key Activated Carbon Supply Regions Worldwide (by Capacity), 2014
Global Activated Carbon Demand Structure by Terminal Application, 2014
Activated Carbon Demand Structure in USA by Application, 2014
Activated Carbon Demand Structure in Japan by Application, 2014
Activated Carbon Demand Structure in Western Europe by Application, 2014
Distribution of Main Activated Carbon Production Areas in China
Price Trend of Coconut Shell Activated Carbon in China, 2015
China's Activated Carbon Output and YoY Growth Rate, 2008-2014
China's Activated Carbon Output and YoY Growth Rate, 2012-2017E
China's Activated Carbon Output Structure (by Type), 2014
Activated Carbon Demand Structure in China by Application, 2014
Policies on China Activated Carbon Industry, 2003-2013
Name List of Chinese Activated Carbon Enterprises Exposed to Anti-Dumping Administrative Review Final Launched by USA and Anti-Dumping Duty, 2013
Import Volume and Value of Wooden Activated Carbon in China, 2010-2014
Top 10 Import Sources of Wooden Activated Carbon in China by Import Volume and Value, Jan-Feb 2015
Import Volume and Value of Other Activated Carbon in China, 2010-2014
Top 10 Import Sources of Other Activated Carbon in China by Import Volume and Value, Jan-Feb 2015
Export Volume and Value of Wooden Activated Carbon in China, 2010-2014
Top 10 Export Destinations of Wooden Activated Carbon in China by Export Volume and Value, Jan-Feb 2015
Export Volume and Value of Other Activated Carbon in China, 2010-2014
Top 10 Export Destinations of Other Activated Carbon in China by Export Volume and Value, Jan-Feb 2015
Capacity of Major Wooden Activated Carbon Companies in China, 2014
Capacity of Major Coaly Activated Carbon Companies in China, 2014
China’s Forestry Output Value and YoY Growth Rate, 2008-2014
China's Wood Output and YoY Growth Rate, 2008-2014
China's Log Output and YoY Growth Rate, 2008-2014
China's Log Import Volume and Value, 2008-2014
Price Trend of Phosphoric Acid (85%, Industrial Grade) in China, 2010-2015
China's Anthracite Coal Output and YoY Growth Rate, 2009-2014
Average Price of Anthracite Coal (by Type) in China, 2014
China's Per Capita Water Consumption and YoY Growth Rate in China, 2008-2014
Output and YoY Growth Rate of Bottled (Canned) Drinking Water in China, 2008-2014
Emissions of Domestic Sewage and Industrial Wastewater in China, 2008-2014
China's Starch Sugar Output and YoY Growth Rate, 2008-2014
China's Sugar Output and YoY Growth Rate, 2008-2014
China's Carbonated Beverage Output and YoY Growth Rate, 2008-2014
Demand from China's Fermentation Industry for Activated Carbon (by Product), 2010-2016E
Output Value and YoY Growth Rate of China's Pharmaceutical Manufacturing, 2008-2014
China's Automobile Output and YoY Growth Rate, 2008-2014
China's Automobile Sales Volume and YoY Growth Rate, 2008-2014
Calgon's Revenue and Net Income, 2010-2014
Calgon's Revenue (by Division), 2010-2014
Calgon's Revenue Structure (by Division), 2010-2014
Calgon's Revenue (by Region), 2010-2014
Calgon's Revenue (by Product), 2010-2013
Calgon's Gross Margin, 2011-2013
Calgon's R & D Costs and% of Total Revenue, 2010-2013
Calgon's Capital Expenditure and YoY Growth Rate, 2010-2014
Calgon's Revenue in China, YoY Growth Rate and % of Total Revenue
Calgon's Revenue and Net Income, 2010-2017E
Revenue and Net Income of Cabot, FY2010-FY2014
Revenue of Cabot (by Product), FY2011-FY2014
Revenue Structure of Cabot (by Product), FY2011-FY2014
Revenue of Cabot (by Region), FY2011-FY2014
Revenue Structure of Cabot (by Region), FY2011-FY2014
Gross Margin of Cabot, FY2011-FY2014
Activated Carbon Revenue, YoY Growth Rate and % of Total Revenue of Cabot, FY2011-FY2014
MWV's Revenue and Net Income, 2010-2014
MWV Revenue (by Division), 2012-2014
MWV's Revenue Structure (by Division), 2012-2014
MWV's Revenue (by Region), 2010-2014
MWV's Revenue Structure (by Region), 2010-2014
MWV's Gross Margin, 2010-2014
Kuraray’s Subsidiaries
Layout and Information of Activated Carbon Production Plants of Japan EnviroChemicals
Subsidiaries of Fujian Yuanli Active Carbon
Revenue and Net Income of Fujian Yuanli Active Carbon, 2010-2014
Revenue of Fujian Yuanli Active Carbon (by Product), 2010-2013
Revenue Structure of Fujian Yuanli Active Carbon (by Product), 2010-2013
Revenue of Fujian Yuanli Active Carbon (by Region), 2010-2014
Revenue Structure of Fujian Yuanli Active Carbon (by Region), 2010-2014
Gross Margin of Fujian Yuanli Active Carbon, 2010-2014
Gross Margin of Fujian Yuanli Active Carbon (by Region), 2010-2014
R & D Costs and % of Total Revenue of Fujian Yuanli Active Carbon, 2010-2014
Implementation of Fundraising Projects of Fujian Yuanli Active Carbon, by 2014
Progress of Research Projects of Fujian Yuanli Active Carbon, 2014
Revenue of Fujian Yuanli Active Carbon from Top 5 Clients and % of Total Revenue, 2010-2014
Procurement of Fujian Yuanli Active Carbon from Top 5 Suppliers and % of Total Procurement, 2010-2014
Activated Carbon Output, Sales Volume and Inventory of Fujian Yuanli Active Carbon, 2011-2014
Revenue and Net Income of Fujian Yuanli Active Carbon, 2013-2017E
Capacity of Fujian Xinsen Carbon (by Product), 2014
Activated Carbon Applications of Fujian Xinsen Carbon
Revenue and Total Profit of Fujian Xinsen Carbon, 2007-2009
Gross Margin of Fujian Xinsen Carbon, 2007-2009
Total Assets and Total Liabilities of Fujian Xinsen Carbon, 2007-2009
Revenue and Total Profit of Zhixing Activated Carbon, 2007-2011
Gross Margin of Zhixing Activated Carbon, 2007-2009
Total Assets and Total Liabilities of Zhixing Activated Carbon, 2007-2009
Powdered Wooden Activated Carbon Output of Zhixing Activated Carbon, 2010-2012
50,000 t/a Activated Carbon Deep (Fine) Processing Project Planning of Zhuxi Activated Carbon
Key Financial Data of Zhuxi Activated Carbon, 2008
Revenue and Total Profit of Yunhe Carbon, 2007-2013
Gross Margin of Yunhe Carbon, 2007-2009
Total Assets and Total Liabilities of Yunhe Carbon, 2007-2013
Revenue, Total Profit, Net Income, Total Assets and Total Liabilities of Xingchang Activated Carbon, 2013
Revenue, Total Profit, Net Income, Total Assets and Total Liabilities of Hengxing Activated Carbon, 2013
Qianmin’s Revenue and Net Income, 2012-2013
Registered Capital, Total Assets, Net Assets, Revenue and Net Income of Huahui Activated Carbon, 2011-2013
Revenue and Total Profit of Yunguang Activated Carbon, 2007-2009
Gross Margin of Yunguang Activated Carbon, 2007-2009
Total Assets and Total Liabilities of Yunguang Activated Carbon, 2007-2009
Revenue, Total Profit, Gross Margin, Total Assets and Total Liabilities of Guanghua Cherishmet, 2008-2009
Main Production Lines and Capacity of Xinhua Activated Carbon
Total Assets, Total Revenue, Total Profit, Net Income and Total Liabilities of Xinhua Activated Carbon, 2013-2014
Revenue of Taixi Coal, 2010-2016E
Activated Carbon Output, Sales Volume and Sales-Output Ratio of Taixi Coal, 2010-2013
Total Assets, Total Revenue, Total Profit, Net Income and Total Liabilities of Huaqing Activated Carbon, 2013
Global and China Synthetic Rubber Industry Report, 2021-2027
Synthetic rubber is a polymer product made of coal, petroleum and natural gas as main raw materials and polymerized with dienes and olefins as monomers, which is typically divided into general synthet...
Global and China Carbon Fiber Industry Report, 2021-2026
Carbon fiber is a kind of inorganic high performance fiber (with carbon content higher than 90%) converted from organic fiber through heat treatment. As a new material with good mechanical properties,...
Global and China Dissolving Pulp Industry Report, 2019-2025
In 2018, global dissolving pulp capacity outstripped 10 million tons and its output surged by 14.0% from a year ago to 7.07 million tons, roughly 70% of the capacity. China, as a key supplier of disso...
Global and China 1, 4-butanediol (BDO) Industry Report, 2019-2025
1,4-butanediol (BDO), an essential organic and fine chemical material, finds wide application in pharmaceuticals, chemicals, textile and household chemicals.
As of the end of 2018, the global BDO cap...
Global and China Carbon Fiber and CFRP Industry Report, 2019-2025
Among the world’s three major high performance fibers, carbon fiber features the highest strength and the highest specific modulus. It is widely used in such fields as aerospace, sports and leisure.
...
Global and China Natural Rubber Industry Report, 2019-2025
In 2018, global natural rubber industry continued remained at low ebb, as a result of economic fundamentals. Global natural rubber price presented a choppy downtrend and repeatedly hit a record low in...
Global and China Ultra High Molecular Weight Polyethylene (UHMWPE) Industry Report, 2019-2025
Ultra high molecular weight polyethylene (UHMWPE), a kind of linear polyethylene with relative molecular weight of above 1.5 million used as an engineering thermoplastic with excellent comprehensive p...
China Polyether Monomer Industry Report, 2019-2025
China has seen real estate boom and issued a raft of policies for continuous efforts in improving weak links in infrastructure sector over the years. Financial funds of RMB1,663.2 billion should be al...
Global and China Viscose Fiber Industry Report, 2019-2025
Over the recent years, the developed countries like the United States, Japan and EU members have withdrawn from the viscose fiber industry due to environmental factor and so forth, while the viscose f...
Global and China Synthetic Rubber (BR, SBR, EPR, IIR, NBR, Butadiene, Styrene, Rubber Additive) Industry Report, 2018-2023
In 2018, China boasted a total synthetic rubber capacity of roughly 6,667kt/a, including 130kt/a new effective capacity. Considering capacity adjustment, China’s capacity of seven synthetic rubbers (B...
Global and China Dissolving Pulp Industry Report, 2018-2022
With the commissioning of new dissolving pulp projects, the global dissolving pulp capacity had been up to about 8,000 kt by the end of 2017. It is worth noticing that the top six producers including ...
Global and China Carbon Fiber and CFRP Industry Report, 2018-2022
As a new generation of reinforced fiber boasting intrinsic properties of carbon material and excellent processability of textile fiber, carbon fiber is the one with the highest specific strength and s...
Global and China Ultra High Molecular Weight Polyethylene (UHMWPE) Industry Report, 2017-2021
Ultra High Molecular Weight Polyethylene (UHMWPE), a kind of linear polyethylene with relative molecular weight of above 1.5 million and an engineering thermoplastic with excellent comprehensive prope...
Global and China Aramid Fiber Industry Report, 2017-2021
Global aramid fiber output totaled 115kt with capacity utilization of 76.0% in 2016. As industries like environmental protection and military develop, the output is expected to rise to 138kt and capac...
Global and China Natural Rubber Industry Report, 2017-2021
In 2016, the global natural rubber output edged up 1.1% year on year to 12.4 million tons, and the consumption rose by 3.8% year on year to 12.6 million tons, indicating the gap of 200,000 tons betwee...
China Synthetic Rubber Industry Report, 2017-2021
Synthetic rubber is one of important strategic materials, mainly used in tyres and other industries. In 2016, the global output and consumption of synthetic rubber reached 14.822 million tons and 14.9...
Global and China 1,4-butanediol (BDO) Industry Report, 2017-2021
1,4-butanediol (BDO) is a key raw material for organic and fine chemicals, capable of generating various derivatives like THF, PTMEG and GBL. BDO and its derivatives find wide application in PBT plast...
Global and China Ethylene Oxide (EO) Industry Report, 2017-2021
Ethylene oxide (EO) is one of the major derivatives of the ethylene industry. Featured with special reactivity, it can generate a series of fine chemical products for a wide range of applications.
In...