Global and China Dissolving Pulp Industry Report, 2014-2017
-
Apr.2015
- Hard Copy
- USD
$2,450
-
- Pages:102
- Single User License
(PDF Unprintable)
- USD
$2,300
-
- Code:
HK058
- Enterprise-wide License
(PDF Printable & Editable)
- USD
$3,600
-
- Hard Copy + Single User License
- USD
$2,650
-
Dissolving pulp refers to the pulp with cellulose content above 90%, mainly including wood pulp, bamboo pulp and cotton pulp (dissolving pulp in this report just involves wood and bamboo pulps), and finding application mainly in viscose fiber downstream.
In 2014, there were a great number of newly-added capacities for dissolving pulp, such as Sappi’s 330 t/a capacity in North America, Double A (Thailand)’s 175 kt/a capacity, and 110 kt/a capacity of OJI (Japan). However, due to constantly-depressed downstream viscose fiber market, price of dissolving pulp continued to drop, being USD800/ton around at the end of 2014.
In 2015, there are still several dissolving pulp projects under construction, for instance, Lenzing is expanding its dissolving pulp capacity, Aditya Birla builds a 200 kt/a capacity in Laos.
The world’s dissolving pulp industry features quite high concentration and key industrial players consist of Sappi, Aditya Birla, Lenzing, Bracell, Rayonier, etc. In 2014, the total dissolving pulp capacity of the aforesaid five producers accounted for roughly 53.3% of global total, in particular, Sappi owned 1.34 million t/a capacity, holding 18.9% in global total, and set up production bases in South Africa and North America.
China’s dissolving pulp capacity soared from 2011, and had climbed to 1.2 million tons around at the end of 2014, making up 17% of the global total, but due to lack of forest resources, Chinese dissolving pulp requires high production costs and thus shows weak competitiveness.
In 2014, influenced by sluggish downstream viscose fiber industry in China and cheap dissolving pulp in international market, China dissolving pulp industry suffered a huge loss, so some dissolving pulp devices were switched to other products or even halted production, for example, Sun Paper’s dissolving pulp devices were switched to production of paper pulp in April, equipment of Yueyang Forest & Paper began to produce bleached softwood pulp in July, and Fujian Nanping Paper’s devices stopped production.
In April, 2014, Ministry of Commerce of PRC publicized final judge on anti-dumping investigation, which indicated that China would impose anti-dumping rate of 17%, 13% and 6.8% on dissolving pulp imported from United States, Canada and Brazil in the next five years. In addition, newly-added dissolving pulp capacity in China will be relatively few in the future, at that time, excessive supply is predicted to be eased and China dissolving pulp industry will gradually bottom out.
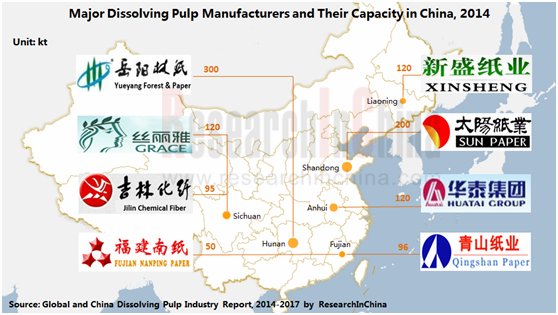
In China, companies owning dissolving pulp production devices are mainly medium and large paper-making enterprises and chemical fiber manufacturers; wherein, the paper-making enterprises is chiefly composed of Yueyang Forest & Paper, Sun Paper and Huatai Paper which mainly provide wood dissolving pulp, and possess 300 kt/a capacity, 200 kt/a capacity and 120 kt/a capacity respectively; and chemical fiber enterprises include Yibin Grace Group and Jilin Chemical Fiber Group whose major product is bamboo dissolving pulp, among which the 95 kt/a bamboo dissolving pulp project of Jilin Chemical Fiber had started trial operation in September, 2014.
Global and China Dissolving Pulp Industry Report, 2014-2017 released by ResearchInChina highlights the followings:
 Market size, competitive landscape, price analysis, etc. of global dissolving pulp industry;
Market size, competition pattern, import & export, price analysis, development forecast, etc. of China dissolving pulp industry;
Market size, competition pattern, import & export, price analysis, development forecast, etc. of China viscose fiber industry;
Operation, dissolving pulp business analysis, prediction & prospects, etc. of 13 global and Chinese dissolving pulp manufacturers.
1. Overview of Dissolving Pulp Industry
1.1 Definition & Classification
1.2 Industrial Chain
2. Global Dissolving Pulp Industry
2.1 Status Quo
2.2 Price Analysis
3. China Dissolving Pulp Industry
3.1 Status Quo
3.2 Anti-dumping Investigation
3.3 Supply
3.4 Demand
3.5 Import & Export
3.5.1 Import Volume & Export Volume
3.5.2 Importing Sources & Importing Regions
3.6 Competition Pattern
3.7 Price Analysis
4. Downstream Viscose Fiber Market
4.1 Capacity
4.2 Output
4.3 Import & Export
4.3.1 Import Volume & Export Volume
4.3.2 Importing Sources & Export Destinations
4.3.3 Importing & Exporting Provinces
4.4 Price Analysis
5. Major Dissolving Pulp Companies Worldwide
5.1 Bracell
5.1.1 Profile
5.1.2 Operation
5.1.3 Revenue Structure
5.1.4 Gross Margin
5.1.5 Dissolving Pulp Business
5.1.6 Business in China
5.2 Sappi
5.2.1 Profile
5.2.2 Operation
5.2.3 Revenue Structure
5.2.4 Dissolving Pulp Business
5.2.5 Business in China
5.3 Aditya Birla Group
5.3.1 Profile
5.3.2 Operation of Grasim
5.3.3 Dissolving Pulp Business of Grasim
5.3.4 Business in China
5.4 Lenzing Group
5.4.1 Profile
5.4.2 Operation
5.4.3 Operation of Fiber Business Division
5.4.4 Dissolving Pulp Business
5.4.5 Business in China
6. Main Dissolving Pulp Producers in China
6.1 Sun Paper
6.1.1 Profile
6.1.2 Operation
6.1.3 Revenue Structure
6.1.4 Gross Margin
6.1.5 Dissolving Pulp Business
6.1.6 Prediction & Outlook
6.2 Jilin Chemical Fiber Group
6.2.1 Profile
6.2.2 Operation
6.2.3 Revenue Structure
6.2.4 Gross Margin
6.2.5 Dissolving Pulp Business
6.2.6 Prediction & Outlook
6.3 Fujian Nanping Paper
6.3.1 Profile
6.3.2 Operation
6.3.3 Revenue Structure
6.3.4 Gross Margin
6.3.5 Dissolving Pulp Business
6.3.6 Prediction & Outlook
6.4 Yanbian Shixian Bailu Papermaking
6.4.1 Profile
6.4.2 Operation
6.4.3 Revenue Structure
6.4.4 Gross Margin
6.4.5 Clients & Suppliers
6.4.6 Dissolving Pulp Business
6.4.7 Prediction & Outlook
6.5 Fujian Qingshan Paper Industry
6.5.1 Profile
6.5.2 Operation
6.5.3 Revenue Structure
6.5.4 Gross Margin
6.5.5 Dissolving Pulp Business
6.5.6 Prediction & Outlook
6.6 Yueyang Forest & Paper
6.6.1 Profile
6.6.2 Operation
6.6.3 Revenue Structure
6.6.4 Gross Margin
6.6.5 Dissolving Pulp Business
6.6.6 Prediction & Outlook
6.7 Shandong Chenming Paper Holdings
6.7.1 Profile
6.7.2 Operation
6.7.3 Revenue Structure
6.7.4 Gross Margin
6.7.5 Clients & Suppliers
6.7.6 Dissolving Pulp Business
6.7.7 Prediction & Outlook
6.8 Huatai Paper
6.8.1 Profile
6.8.2 Operation
6.8.3 Revenue Structure
6.8.4 Gross Margin
6.8.5 Dissolving Pulp Business
6.8.6 Prediction & Outlook
6.9 Yibin Grace Group Company
6.9.1 Profile
6.9.2 Dissolving Pulp Business
7 Conclusion & Prediction
7.1 Conclusion
7.2 Prediction
7.2.1 Supply & Demand Prediction
7.2.2 Downstream Prediction
Mainstream Industrial Chain of Dissolving Wood Pulp
Other Downstream Products and Applications of Dissolving Pulp
Major Dissolving Pulp Manufacturers Worldwide and Their Capacities, 2014
Major Dissolving Pulp Projects Planned or Under Construction Worldwide, 2015
Price Tendency of Dissolving Pulp Worldwide, 2011-2015
Capacity and Output of Dissolving Pulp in China, 2010-2014
Capacities of Dissolving Pulp Manufacturers in China, 2014
Apparent Consumption of Dissolving Pulp in China, 2010-2014
Import & Export Volume of Dissolving Pulp in China, 2010-2014
Average Import & Export Price of Dissolving Pulp in China, 2010-2014
Import Source Structure of Dissolving Pulp in China by Import Volume, 2014
Average Import Price of Dissolving Pulp in China by Country, 2014
Major Dissolving Pulp Import Provinces/Municipalities and Their Import Volume in China (%), 2014
Dissolving Pulp Manufacturers in China and Their Capacities (%), 2014
Dissolving Pulp Market Price in China, 2012-2015
Major Viscose Fiber Manufacturers in China and Their Capacities, 2014
Major Viscose Staple Fiber Manufacturers in China and Their Capacities (%), 2014
Output and YoY Growth Rate of Viscose Fiber in China, 2006-2014
Import and Export Volume of Viscose Staple Fiber in China, 2010-2014
Average Import and Export Price of Viscose Staple Fiber in China, 2010-2014
Export Destinations of Viscose Staple Fiber in China by Export Volume, 2014
Import Sources of Viscose Staple Fiber in China by Import Volume, 2014
Major Viscose Staple Fiber Export Cities and Their Export Volume in China (%), 2014
Major Viscose Staple Fiber Import Cities and Their Import Volume in China (%), 2014
Market Price of Viscose Staple Fiber and Viscose Filament Yarn in China, 2008-2015
Bracell’s Product Chain and Product Application
Revenue and Net Income of Bracell, 2010-2014
Revenue of Bracell by Product, 2012-2014
Revenue Structure of Bracell by Product, 2012-2014
Gross Margin of Primary Products of Bracell, 2010-2014
Categories and Application of Bracell’s Dissolving Wood Pulp
Revenue and EBITDA of Bracell’s Dissolving Pulp Business, 2013-2014
Revenue of Bracell’s Dissolving Pulp Business by Region, 2013-2014
Revenue Structure of Bracell’s Dissolving Pulp Business by Region, 2013-2014
Output and Sales Volume of Bracell’s Dissolving Wood Pulp, 2013-2014
Viscose Pulp Sales Volume and % in Total of Bracell’s Dissolving Pulp Business, 2013-2014
Special Pulp Sales Volume and % in Total of Bracell’s Dissolving Wood Pulp Business, 2013-2014
Average Selling Price of Sateri’s Dissolving Wood Pulp Product, 2010-2014
Three Major Production Bases of Sappi and Capacities of Its major Products, 2014
Sales and EBITDA of Sappi, 2010-2014
Sales of Sappi by Branch, 2012-2014
Sales Structure of Sappi by Branch, 2012-2014
Sales Structure of Sappi by Product, 2013-2014
Sales of Sappi by Region, 2012-2014
Sales Structure of Sappi by Region, 2012-2014
Dissolving Pulp Plants of Sappi and Their Capacities, 2014
Revenue and EBITDA of Sappi’s Dissolving Pulp Business, 2012-2014
Revenue and Net Income of Grasim, FY2010-FY2014
Revenue Structure of Grasim by Product, FY2012-FY2014
Major Plants of Grasim’s Primary Products and Their Capacities, 2014
Revenue and YoY Growth Rate of Grasim’s Viscose Staple Fiber and Dissolving Pulp Business, FY2010-FY2014
Sales and EBITDA of Lenzing Group, 2010-2014
Sales Structure of Lenzing Group by Segment, 2012-2014
Sales Structure of Lenzing Group by Region, 2012-2014
Sales and EBITDA from Fiber Business Division of Lenzing Group, 2010-2014
Sales from Fiber Business Division of Lenzing Group by Product, 2012-2014
Sales Structure from Fibre Business Division of Lenzing Group by Product, 2012-2014
Dissolving-pulp-related Subsidiaries of Lenzing Group and Their Capacities, 2014
Revenue and Net Income of Lenzing Group (Nanjing), 2010-2014
Revenue and Net Income of Sun Paper, 2010-2014
Revenue of Sun Paper by Product, 2012-2014
Revenue Structure of Sun Paper by Product, 2012-2014
Revenue of Sun Paper by Region, 2012-2014
Revenue Structure of Sun Paper by Region, 2012-2014
Gross Margin of Sun Paper’s Hit Products, 2012-2014
Revenue and Net Income of Sun Paper, 2013-2017E
Capacities of Jilin Chemical Fiber Group’s Hit Products, 2014
Revenue and Net Income of Jilin Chemical Fiber Group, 2010-2014
Revenue of Jilin Chemical Fiber Group by Product, 2012-2014
Revenue Structure of Jilin Chemical Fiber Group by Product, 2012-2014
Revenue of Jilin Chemical Fiber Group by Region, 2012-2014
Revenue Structure of Jilin Chemical Fiber Group by Region, 2012-2014
Gross Margin of Jilin Chemical Fiber Group’s Major Products, 2012-2014
Revenue and Net Income of Jilin Chemical Fiber Group, 2013-2017E
Revenue and Net Income of Fujian Nanping Paper, 2010-2014
Revenue of Fujian Nanping Paper by Product, 2012-2014
Revenue Structure of Fujian Nanping Paper by Product, 2012-2014
Revenue of Fujian Nanping Paper by Region, 2012-2014
Revenue Structure of Fujian Nanping Paper by Region, 2012-2014
Gross Margin of Fujian Nanping Paper’s Main Products, 2012-2014
Dissolving Pulp Products and Features of Fujian Nanping Paper
Revenue and Net Income of Yanbian Shixian Bailu Papermaking, 2010-2014
Revenue of Yanbian Shixian Bailu Papermaking by Product, 2012-2014
Revenue Structure of Yanbian Shixian Bailu Papermaking by Product, 2012-2014
Revenue of Yanbian Shixian Bailu Papermaking by Region, 2012-2014
Revenue Structure of Yanbian Shixian Bailu Papermaking by Region, 2012-2014
Gross Margin of Yanbian Shixian Bailu Papermaking’s Main Products, 2012-2014
Yanbian Shixian Bailu Papermaking’s Revenue from Top Five Clients and % of Total Revenue, 2012-2014
Name List and Revenue Contribution of Yanbian Shixian Bailu Papermaking’s Top 5 Clients, 2014H1
Yanbian Shixian Bailu Papermaking’s Procurement from Top Five Suppliers and % in Total, 2013-2014
Name List and Procurment Proportion of Yanbian Shixian Bailu Papermaking’s Top Five Suppliers, 2014H1
Output and Sales Volume of Yanbian Shixian Bailu Papermaking’s Dissolving Pulp, 2012-2014
Revenue and Net Income of Yanbian Shixian Bailu Papermaking, 2013-2017E
Revenue and Net Income of Fujian Qingshan Paper Industry, 2010-2014
Revenue of Fujian Qingshan Paper Industry by Product, 2012-2014
Revenue Structure of Fujian Qingshan Paper Industry by Product, 2012-2014
Revenue of Fujian Qingshan Paper Industry by Region, 2012-2014
Revenue Structure of Fujian Qingshan Paper Industry by Region, 2012-2014
Gross Margin of Fujian Qingshan Paper Industry’s Main Products, 2012-2014
Revenue and Net Income of Fujian Qingshan Paper Industry, 2013-2017E
Revenue and Net Income of Yueyang Forest & Paper, 2010-2014
Revenue of Yueyang Forest & Paper by Product, 2013-2014
Revenue Structure of Yueyang Forest & Paper by Product, 2013-2014
Revenue of Yueyang Forest & Paper by Region, 2012-2014
Revenue Structure of Yueyang Forest & Paper by Region, 2012-2014
Gross Margin of Yueyang Forest & Paper’s Main Products, 2014
Revenue and Net Income of Hunan Juntai Pulp & Paper, 2011-2014
Revenue and Net Income of Yueyang Forest & Paper, 2013-2017E
Revenue and Net Income of Shandong Chenming Paper Holdings, 2010-2014
Revenue of Shandong Chenming Paper Holdings by Product, 2012-2014
Revenue Structure of Shandong Chenming Paper Holdings by Product, 2012-2014
Revenue of Shandong Chenming Paper Holdings by Region, 2012-2014
Revenue Structure of Shandong Chenming Paper Holdings by Region, 2012-2014
Gross Margin of Shandong Chenming Paper Holdings’s Major Products, 2012-2014
Shandong Chenming’s Revenue from Top Five Clients and % of Total Revenue, 2012-2014
Name List and Revenue Contribution of Shandong Chenming’s Top 5 Clients, 2014
Shandong Chenming’s Procurement from Top Five Suppliers and % in Total, 2012-2014
Name List and Procurement Proportion of Shandong Chenming’s Top Five Suppliers, 2014
Revenue and Net Income of Shandong Chenming. 2013-2017E
Revenue and Net Income of Shandong Huatai Paper, 2010-2014
Revenue of Shandong Huatai Paper by Product, 2012-2014
Revenue Structure of Shandong Huatai Paper by Product, 2012-2014
Revenue of Shandong Huatai Paper by Region, 2012-2014
Revenue Structure of Shandong Huatai Paper by Region, 2012-2014
Gross Margin of Shandong Huatai Paper’s Major Products, 2012-2014
Revenue and Net Income of Anhui Huatai, 2012-2014
Revenue and Net Income of Shandong Huatai Paper, 2013-2017E
Capacities of Yibin Grace Group Company’s Main Products, 2014
Operation Comparison among Major Dissolving Pulp Manufacturers in China and Worldwide, 2013-2014
Supply and Demand of China Dissolving Pulp Industry, 2013-2017E
Supply and Demand of China Viscose Fiber Industry, 2013-2017E
Global and China Synthetic Rubber Industry Report, 2021-2027
Synthetic rubber is a polymer product made of coal, petroleum and natural gas as main raw materials and polymerized with dienes and olefins as monomers, which is typically divided into general synthet...
Global and China Carbon Fiber Industry Report, 2021-2026
Carbon fiber is a kind of inorganic high performance fiber (with carbon content higher than 90%) converted from organic fiber through heat treatment. As a new material with good mechanical properties,...
Global and China Dissolving Pulp Industry Report, 2019-2025
In 2018, global dissolving pulp capacity outstripped 10 million tons and its output surged by 14.0% from a year ago to 7.07 million tons, roughly 70% of the capacity. China, as a key supplier of disso...
Global and China 1, 4-butanediol (BDO) Industry Report, 2019-2025
1,4-butanediol (BDO), an essential organic and fine chemical material, finds wide application in pharmaceuticals, chemicals, textile and household chemicals.
As of the end of 2018, the global BDO cap...
Global and China Carbon Fiber and CFRP Industry Report, 2019-2025
Among the world’s three major high performance fibers, carbon fiber features the highest strength and the highest specific modulus. It is widely used in such fields as aerospace, sports and leisure.
...
Global and China Natural Rubber Industry Report, 2019-2025
In 2018, global natural rubber industry continued remained at low ebb, as a result of economic fundamentals. Global natural rubber price presented a choppy downtrend and repeatedly hit a record low in...
Global and China Ultra High Molecular Weight Polyethylene (UHMWPE) Industry Report, 2019-2025
Ultra high molecular weight polyethylene (UHMWPE), a kind of linear polyethylene with relative molecular weight of above 1.5 million used as an engineering thermoplastic with excellent comprehensive p...
China Polyether Monomer Industry Report, 2019-2025
China has seen real estate boom and issued a raft of policies for continuous efforts in improving weak links in infrastructure sector over the years. Financial funds of RMB1,663.2 billion should be al...
Global and China Viscose Fiber Industry Report, 2019-2025
Over the recent years, the developed countries like the United States, Japan and EU members have withdrawn from the viscose fiber industry due to environmental factor and so forth, while the viscose f...
Global and China Synthetic Rubber (BR, SBR, EPR, IIR, NBR, Butadiene, Styrene, Rubber Additive) Industry Report, 2018-2023
In 2018, China boasted a total synthetic rubber capacity of roughly 6,667kt/a, including 130kt/a new effective capacity. Considering capacity adjustment, China’s capacity of seven synthetic rubbers (B...
Global and China Dissolving Pulp Industry Report, 2018-2022
With the commissioning of new dissolving pulp projects, the global dissolving pulp capacity had been up to about 8,000 kt by the end of 2017. It is worth noticing that the top six producers including ...
Global and China Carbon Fiber and CFRP Industry Report, 2018-2022
As a new generation of reinforced fiber boasting intrinsic properties of carbon material and excellent processability of textile fiber, carbon fiber is the one with the highest specific strength and s...
Global and China Ultra High Molecular Weight Polyethylene (UHMWPE) Industry Report, 2017-2021
Ultra High Molecular Weight Polyethylene (UHMWPE), a kind of linear polyethylene with relative molecular weight of above 1.5 million and an engineering thermoplastic with excellent comprehensive prope...
Global and China Aramid Fiber Industry Report, 2017-2021
Global aramid fiber output totaled 115kt with capacity utilization of 76.0% in 2016. As industries like environmental protection and military develop, the output is expected to rise to 138kt and capac...
Global and China Natural Rubber Industry Report, 2017-2021
In 2016, the global natural rubber output edged up 1.1% year on year to 12.4 million tons, and the consumption rose by 3.8% year on year to 12.6 million tons, indicating the gap of 200,000 tons betwee...
China Synthetic Rubber Industry Report, 2017-2021
Synthetic rubber is one of important strategic materials, mainly used in tyres and other industries. In 2016, the global output and consumption of synthetic rubber reached 14.822 million tons and 14.9...
Global and China 1,4-butanediol (BDO) Industry Report, 2017-2021
1,4-butanediol (BDO) is a key raw material for organic and fine chemicals, capable of generating various derivatives like THF, PTMEG and GBL. BDO and its derivatives find wide application in PBT plast...
Global and China Ethylene Oxide (EO) Industry Report, 2017-2021
Ethylene oxide (EO) is one of the major derivatives of the ethylene industry. Featured with special reactivity, it can generate a series of fine chemical products for a wide range of applications.
In...